
Applicability of Thermal Comfort Models to Car Cabin Environments
Diana Hintea
1
, John Kemp
1
, James Brusey
1
, Elena Gaura
1
and Neil Beloe
2
1
Coventry University, Priory Lane, Coventry, CV1 5FB, U.K.
2
Jaguar Land Rover Ltd, Abbey Road, Whitley, Coventry, CV3 4LF, U.K.
Keywords:
PMV, Thermal Comfort Model, HVAC Control, Skin Temperature.
Abstract:
Car cabins are non-uniform and asymmetric environments in relation to both air velocity and temperature.
Estimating and controlling vehicle occupant thermal comfort is therefore a challenging task. This paper fo-
cuses on evaluating the suitability of four existing thermal comfort models, namely the Predicted Mean Vote
(PMV), Taniguchi’s model, Zhang’s model and Nilsson’s model in a variety of car cabin conditions. A series
of comfort trials were performed ranging from controlled indoor trials to on-road driving trials. The outputs
of all four models were compared to the sensation index reported by the subjects situated in the driver seat.
The results show that PMV and Nilsson’s model are generally applicable for the car cabin environment, but
that they are most accurate when there is a small air temperature rate of change (of under 1.5
◦
C per minute),
giving correlation levels of 0.91 and 0.93 for the two models respectively. Taniguchi’s and Zhang’s models
were found unsuitable for all conditions, with correlation levels ranging between 0.03 and 0.60. Nilsson’s
model is recommended by the authors based on the level of agreement with the subjective reports, its ability
to estimate both local and overall thermal sensation and the smaller number of input parameters.
1 INTRODUCTION
Car cabins are environments with inherent non-
uniformity and asymmetry in both air velocity and
temperature fields. Steady-state trends can be encoun-
tered for journeys in excess of 15-20 minutes, how-
ever 85% of journeys are of shorter duration (Cistern-
ino, 1999). Predicting passengers’ thermal comfort
for efficient Heating, Ventilation and Air Condition-
ing (HVAC) control is therefore a complex problem.
More than forty years after its development,
Fanger’s Predicted Mean Vote (PMV) (Fanger, 1973)
remains the most used method for assessing occu-
pant thermal comfort in a range of environments.
Although designed specifically for use in buildings,
PMV continues to drive research into vehicle HVAC
control algorithms (Ueda and Taniguchi, 2000; Busl,
2011; Farzaneh and Tootoonchi, 2008). The main
reasons are the simplicity of measuring the air tem-
perature and humidity parameters, combined with the
ability to estimate the remaining parameters within
controlled tests. Nilsson (Nilsson, 2004) proposed
thermal comfort zones for 18 different body parts and
overall based on equivalent temperatures. Nilsson’s
model uses similar parameters with PMV (air temper-
ature, air flow, mean radiant temperature and clothing
index). However, the model has the advantage of es-
timating local thermal sensation, as well as overall.
Skin temperature is shown to be a good predictor
of local and overall thermal sensation in the state of
art (Bogdan, 2011; Wang et al., 2007). Taniguchi’s
model (Taniguchi et al., 1992) was designed for ve-
hicular applications and is based on face skin tem-
perature only. Zhang’s thermal sensation and comfort
model (Zhang, 2003), on the other hand, is a more re-
cent model developed with transient, inhomogeneous
environments in mind. The model, however, has been
criticized in the literature for having too many coeffi-
cients, for the limitations of the experimentation and
for the body part set-point temperature approach (Luo
et al., 2007). Moreover, no validation of these two
skin temperature based models within daily driving
scenarios or other typical conditions encountered in
vehicular environments exists in the literature.
Considering the above, this paper evaluates PMV,
Taniguchi’s model, Zhang’s model and Nilsson’s
model on empirical data gathered in a variety of car
cabin conditions, establishing whether they are suit-
able for comfort-oriented vehicular control.
The main contributions of this paper are: 1) illus-
trating the range of conditions in which these mod-
els could be applied to drive comfort-oriented HVAC
control algorithms and 2) establishing which of the
four thermal comfort models is a better match of cabin
769
Hintea D., Kemp J., Brusey J., Gaura E. and Beloe N..
Applicability of Thermal Comfort Models to Car Cabin Environments.
DOI: 10.5220/0005101707690776
In Proceedings of the 11th International Conference on Informatics in Control, Automation and Robotics (ICINCO-2014), pages 769-776
ISBN: 978-989-758-039-0
Copyright
c
2014 SCITEPRESS (Science and Technology Publications, Lda.)

occupant thermal comfort in typical vehicular condi-
tions based on gathered empirical data.
The paper is structured as follows: Section 2
presents an overview of the the four thermal com-
fort models. Section 3 describes the data gathering
methodology, focusing on the instrumentation used,
the participating subjects and the range of conditions
encountered in the car cabin. Section 4 presents the
results obtained when comparing the sensation index
corresponding to the four models with the subjects’
reported sensation. Finally, Section 5 concludes the
paper.
2 BACKGROUND
Based on the review provided by Cheng et al. (Cheng
et al., 2012), the following thermal comfort models
were implemented and evaluated on the data gath-
ered: PMV, Taniguchi’s model, Nilsson’s model and
Zhang’s model. These thermal comfort models are re-
viewed in (Alahmer et al., 2011; Cheng et al., 2012;
Orosa, 2009) and discussed in the following subsec-
tions.
With regard to other models, Matsunaga et
al. (Matsunaga et al., 1993) adopted, for example, the
concept of Average Equivalent Temperature (AET) in
order to compute the PMV sensation index. The AET
is a surface area-weighted value for three body parts:
the head with a weight of 0.1, the abdomen with a
weight of 0.7 and the feet with a weight of 0.2. Be-
cause the end product is the PMV index, this tech-
nique is not evaluated in this paper. Also, the Berke-
ley advanced human thermal comfort model (Arens
et al., 2006) is used as a cabin occupant comfort es-
timator in multiple works. The virtual manikin in the
software model estimates occupant skin temperatures
and Zhang’s model uses the latter to calculate thermal
sensation and thermal comfort. As this paper is con-
cerned with empirical results rather than simulation,
only Zhang’s model is evaluated.
2.1 Predicted Mean Vote (PMV)
Fanger (Fanger, 1970) developed the PMV model
in 1967 based on thermo-regulation and heat bal-
ance theories. These theories are based on human
bodies employing physiological processes in order
to maintain a balance between the heat produced by
metabolism and the heat lost from the body. The PMV
index provides a score that corresponds to the Ameri-
can Society of Heating, Refrigerating and Air Condi-
tioning Engineers (ASHRAE) thermal sensation scale
shown in Table 1 and it is defined as the average
Table 1: PMV thermal sensation index.
3 Hot
2 Warm
1 Slightly warm
0 Neutral
-1 Slightly cool
-2 Cool
-3 Cold
thermal sensation felt by a large group of people in
a space. The PMV model combines four physical
variables (air temperature, air velocity, mean radiant
temperature and relative humidity) and two personal
variables (clothing insulation and activity level). The
mathematical equations used to derive the PMV index
are given in the ISO 7730 standard (ISO, 2005).
Fanger validated and refined the comfort equation
with data from other previous thermal comfort studies
combined with his own, summing to approximately
1400 participants. Fanger stated that the PMV model
should be used with care for indexes below −2 and
above +2 and that significant errors can appear in hot
environments. PMV’s main advantages are the stan-
dardisation of the implementation and that if some of
the constituent parameters cannot be measured, they
can be approximated without introducing a significant
error in the outputted PMV index.
However, PMV was never intended to be
applied in transient, inhomogeneous conditions.
Van Hoof (van Hoof, 2008) discussed PMV’s applica-
bility to transient conditions, concluding that there is
a lack of PMV assessment in transient environments
and that extensive research is still required. Also,
body parts experience local discomfort and thermal
sensation levels differ from each other and from the
overall sensation (Arens et al., 2006; Nakamura et al.,
2008). With the introduction of heated/cooled seats
and steering wheels the impact on individual body
part sensation is even higher. Therefore, a big disad-
vantage of the PMV model is that it is unable to dif-
ferentiate between sensations at different body parts,
which is an important capability in the case of vehic-
ular HVAC control systems.
2.2 Taniguchi’s Model
Skin temperature is shown to be a good predictor of
local and overall thermal sensation in the state of art
(Bogdan, 2011; Wang et al., 2007), especially in case
of extremities such as face and hands. Taniguchi et
al. (Taniguchi et al., 1992) developed a multiple linear
regression model relating the average facial skin tem-
perature and its rate of change to the Overall Thermal
Sensation (OTS) in a vehicle environment. The model
ICINCO2014-11thInternationalConferenceonInformaticsinControl,AutomationandRobotics
770

was proposed based on a series of human subject tests
and OTS is calculated as:
OTS = 0.81 (T
f
− 33.9) + 39.1
dT
f
dt
where T
f
is the face skin temperature and
dT
f
dt
is the
face skin temperature rate of change.
A significant disadvantage of this model is not tak-
ing into account that the thermal sensation of body
segments other than the face also impact the overall
body thermal sensation. Moreover, it does not allow
the computation of local thermal sensation.
2.3 Zhang’s Model
Zhang (Zhang, 2003) developed local and over-
all thermal sensation and comfort models tar-
geted at transient, non-uniform conditions. Unlike
Taniguchi’s model, Zhang’s models are based on skin
temperatures at multiple sites along with core temper-
ature, if available. A nine point analogue scale (shown
in Table 2) is used for expressing thermal sensation.
Experimental tests were carried out at UC Berkeley,
with subjects placed into chambers of uniform tem-
perature and with heated or cooled air applied indi-
vidually to 19 separate body areas. The tests were
carried out in a climate-controlled chamber, consist-
ing of both cold and hot test cases. Throughout these
tests, subjects were allowed to adjust the HVAC set-
tings to their preference. Skin temperature was mea-
sured at 19 locations using thermocouples, while core
temperature was measured using an ingestible tem-
perature device. Local and overall sensation equa-
tions were developed, using the measured skin tem-
perature, mean skin temperature and core tempera-
ture along with subjective reports. Zhang validated
the model against subjective reports and acceptable
results were obtained. The coefficient of determina-
tion (R
2
) for the overall sensation model was 0.95 and
the standard deviation of residuals was 0.54.
Luo et al. (Luo et al., 2007) criticize the model,
citing that “the mathematical model is not practicable
as it is limited by having too many coefficients, and
because of the experiment’s limitation, the regression
analysis result cannot be assured either”. Further-
more, they criticize the body part set-point tempera-
ture approach of the model. Also, Cheng et al. (Cheng
et al., 2012) points out that during the experiments,
they focused more on cooling local body parts in
warm environments than on warming local body parts
in cool environments. In addition, the influence of lo-
cal stimulation duration and intensity were not var-
ied in the test. Moreover, no validation of the model
Table 2: Zhang’s thermal sensation scale.
4 Very Hot
3 Hot
2 Warm
1 Slightly Warm
0 Neutral
-1 Slightly Cool
-2 Cool
-3 Cold
-4 Very Cold
within daily driving scenarios or other typical condi-
tions encountered in vehicular environments exists in
the literature. The main advantage of Zhang’s model
over PMV is its ability to determine local sensation
indexes.
2.4 Nilsson’s Model
Nilsson (Nilsson, 2004) proposed clothing indepen-
dent thermal comfort zones for 18 different body parts
based on equivalent temperatures. Equivalent temper-
ature is formally defined as the uniform temperature
of an imaginary enclosure with air velocity equal to
zero in which a person will exchange the same dry
heat by radiation and convection as in the actual non-
uniform environment (Nilsson and Holmer, 2002).
Equivalent temperature can be computed based on en-
vironmental parameters such as air temperature, mean
radiant temperature, air flow and clothing index or
it can be directly measured with appropriate instru-
ments (Nilsson and Holmer, 2002). Once the equiv-
alent temperature is calculated, the local or overall
thermal sensation level can be estimated using the di-
agrams in Figure 1. Nilsson developed this model
through experimentation with approximately 500 sub-
jects.
A gap in the literature that this paper responds to
is the lack of empirical evaluation of the thermal com-
fort models presented within vehicular environments
in order to establish whether any of them is suitable
for comfort-oriented HVAC control. According to the
authors’ knowledge, no empirical data based evalua-
tion of these models in vehicular environments exists
in the state of art.
3 METHODOLOGY
In order to address this lack of empirical evaluation,
car cabin data and subjective comfort readings were
gathered over a wide range of experimental condi-
tions. This section provides a description of the par-
ApplicabilityofThermalComfortModelstoCarCabinEnvironments
771
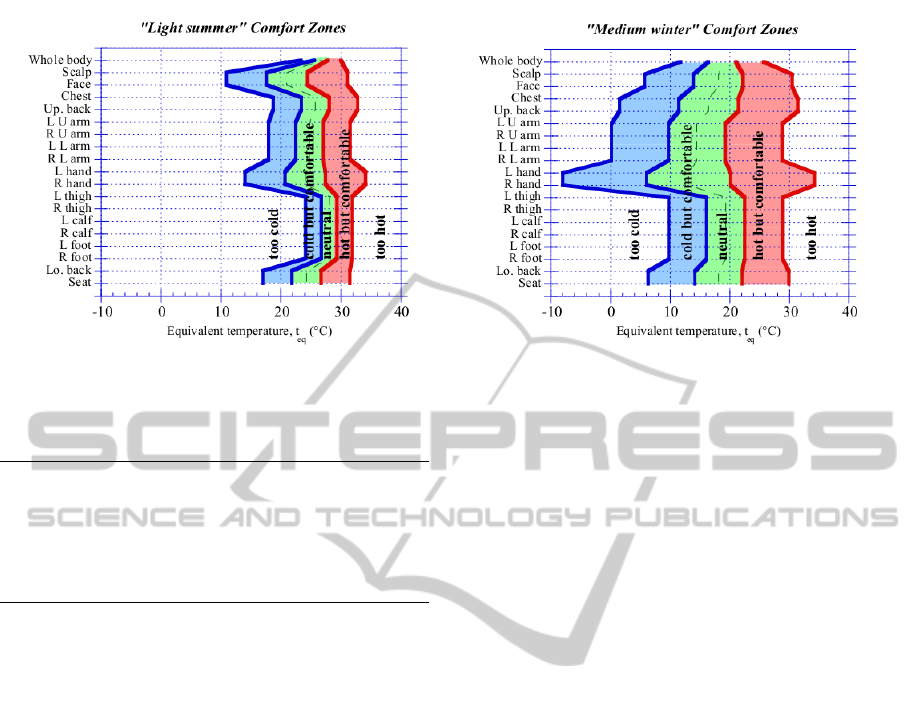
Figure 1: Nilsson’s clothing independent thermal sensation diagrams (Nilsson, 2004).
Table 3: Subject details.
Subject Gender Age Height (cm) Weight (kg)
1 Male 46 173 78
2 Female 37 157 73
3 Male 56 166 70
4 Male 49 178 75
5 Female 24 162 48
6 Male 26 176 77
7 Female 34 160 55
ticipating subjects in the comfort trials, the instrumen-
tation used and the variety of conditions encountered
throughout the trials.
3.1 Participating Subjects
Seven adults (four males and three females) were se-
lected as experimental subjects. Their ages were be-
tween 24 and 56 years old, with heights between
1.57 cm and 1.78 cm and weights between 48 kg and
78 kg, as presented in Table 3. The subjects occu-
pied the driver seat and were asked by the observer
in the right-hand rear passenger seat for their overall
thermal sensation throughout the experimental trials
(as detailed in Section 3.3). The thermal sensation
scale used was the ASHRAE seven point scale (coin-
cides with the PMV scale) shown in Table 1. Cloth-
ing was standardised across all trials and subjects,
consisting of long trousers and a short-sleeved, light-
coloured shirt or blouse, corresponding to a clothing
index value of 0.7.
3.2 Measured Variables
Throughout all trials, equivalent temperature was
monitored at eight locations (corresponding to head,
chest, left lower arm, right lower arm, left upper arm,
right upper arm, thigh and calf) using the INNOVA
Flatman support manikin, shown in Figure 2 (right)
and the associated INNOVA 1221 thermal comfort
data-logger. Throughout the trials, the Flatman was
positioned in the front passenger seat, continuously
calculating equivalent temperature via the dry heat
loss sensors and computing the PMV thermal sensa-
tion level. Cabin air and surface temperature data was
gathered from 19 points using type K thermocouples
and was recorded by a Grant Instruments DataTaker
DT85 data logger. Near-body air temperature and rel-
ative humidity were measured at eight points (close
to the neck, wrist, chest, thigh and calf locations)
using type T thermocouples and Honeywell S&C
HIH-5031 humidity sensors and also recorded by a
SQ2040 data-logger. Solar loading at the driver sun-
roof location was measured using automotive solar
sensors and recorded by a Grant Instruments Squirrel
SQ2040 data-logger. The driver’s center and outboard
face vent air temperatures were monitored using type
K thermocouples and recorded by the SQ2040 data-
logger. Finally, subject skin temperature was also
monitored at eight points (neck, left and right wrist,
chest, left and right thigh and left and right calf) using
Grant Instruments EUS-UU-VL2-0 thermistors and
recorded by the SQ2040 data-logger.
3.3 Experimental Procedure
The trials were performed from the 8
th
to the 29
th
of
August 2011. The test car used was a Jaguar XJ (2010
model year). Three types of trials were performed,
with 78 trials in total, as described in the following
sections.
ICINCO2014-11thInternationalConferenceonInformaticsinControl,AutomationandRobotics
772

Figure 2: Experimental data gathering. Left: Mean radi-
ant temperature sensor. Right: Upper body of the Flatman
thermal manikin.
3.3.1 Variable Cabin Temperatures Within
Steady State External Conditions (T1)
These trials were performed within an enclosed space
in order to eliminate wind and precipitation effects.
Both the subjects and the test car were preconditioned
for 20 minutes to 22
◦
C. At the outset of the experi-
ment the subject, occupying the driver seat, remained
in static conditions for 10 minutes. The temperature
was then increased by 1
◦
C every 3 minutes until it
reached 28
◦
C. The subject then left the car, which
was again conditioned to 22
◦
C. After the subject re-
turned, they again remained in static conditions for 10
minutes. Then the temperature was decreased by 1
◦
C
every 3 minutes until it reached 16
◦
C. The air flow
from the HVAC system was set to high or medium
settings. During the static conditions, the subject re-
ported thermal sensation and comfort at the 5, 7, and
9 minute marks and one minute before each tempera-
ture change when the HVAC set point was varied.
These trials are characterized by the following
conditions: 1) absolute average car cabin temperature
rates of change peaking at around 1.5
◦
C per minute,
but usually under 1
◦
C per minute; 2) precondition-
ing of the cabin and subject at the same temperature;
3) no precipitation or wind effects; 4) steady ambient
temperature (between 19
◦
C and 24
◦
C ) varying by
less than 1
◦
C within an individual trial.
3.3.2 User Control with Steady State External
Conditions (T2)
These trials were performed within an enclosed space.
The car and the subjects were preconditioned to a neu-
tral (22
◦
C), hot (28
◦
C), or cold (16
◦
C) tempera-
ture. The subjects entered the car and remained inside
for 15 minutes time, during which they were permit-
ted to adjust the air conditioning at will in order to
make themselves more comfortable. The control ad-
justments they made were logged in addition to the
previously described parameters. Thermal comfort
and sensation was reported every two minutes, with
the first report being at the start of the test.
These trials are characterized by the following
conditions: 1) absolute average car cabin temperature
rates of change peaking at 8
◦
C per minute; 2) precon-
ditioning of the cabin and subject at the same temper-
ature; 3) no precipitation or wind effects; 4) steady
outside temperature (between 17
◦
C and 25
◦
C) vary-
ing by less than 1
◦
C within an individual trial.
3.3.3 User Control in Driving Conditions (T3)
These trials are similar to the previous ones (T2), ex-
cept that the subjects drove the car on private roads
and there was no additional solar loading applied be-
yond that naturally falling on the car. Drivers were
required to turn and change speed at frequent inter-
vals in order to simulate to an extent the daily driv-
ing routine. This provided a comparison against the
baseline established in the previous type of trials, as
it was expected that the acceptable temperature range
would widen as the driver was required to concen-
trate on driving. Thermal comfort and sensation was
reported every two minutes, with the first report being
at the start of the test.
These trials are characterized by the following
conditions: 1) absolute average car cabin temperature
rates of change peaking at 10
◦
C per minute; 2) pre-
conditioning of the cabin and subject at the same tem-
perature; 3) ambient solar load and wind; 4) ambient
outside temperature (between 12
◦
C and 28
◦
C) vary-
ing by less than 2
◦
C within an individual trial.
The first set of trials were aimed at determining
the extents of passenger thermal comfort with no ex-
treme conditions, while the second set offered infor-
mation on what control adjustments were required
in order for the cabin occupants to feel comfortable
and how quickly thermal neutrality was reached. The
third set of trials aimed to capture the comfort ranges
during daily driving and therefore with the subject
less focused on their comfort. Altogether, the mul-
titude of conditions (solar load, stationary or driving,
different blower speeds, different initial temperatures)
allowed a thorough evaluation of the validity of the
selected thermal comfort models. Table 4 provides a
summary of the trials performed.
Throughout the three sets of trials, the Flatman
was positioned in the front passenger seat, with the
subject occupying the driver seat. In order to ensure a
valid comparison between the thermal sensation com-
puted/reported by the two sides the following were
ensured: 1) the front passenger vent and driver vent
had the same orientation and delivered the same set-
point temperature; 2) both the test car (with the Flat-
man inside) and the driver were preconditioned to the
same temperature prior to each trial.
ApplicabilityofThermalComfortModelstoCarCabinEnvironments
773

Table 4: Summary of the experimental conditions in all trials.
Trial Duration (mins) Blower speed Solar load Driving Pre-conditioning Subjects
T1 56 High or Medium Controlled No 22
◦
C 7
T2 15 User Controlled No 16
◦
C, 22
◦
C or 28
◦
C 7
T3 15 User Ambient Yes 16
◦
C, 22
◦
C or 28
◦
C 6
4 RESULTS
This section provides an evaluation of the four ther-
mal comfort models based on the gathered data de-
scribed in Section 3. The purpose is to establish
whether they can accurately predict car cabin occu-
pant thermal sensation in any of the conditions in or-
der to be used for comfort based HVAC control. For
this purpose the overall thermal sensation reports of
the drivers were compared to i) the PMV index as
computed by the Flatman, ii) Zhang’s index computed
from the measured skin temperatures, iii) Taniguchi’s
index computed from the measured facial skin tem-
perature and iv) Nilsson’s index computed from the
measured average body equivalent temperature.
PMV is widely used for car cabin comfort
based HVAC controllers (Busl, 2011; Farzaneh and
Tootoonchi, 2008). The reason is the simplicity of
estimating the PMV index. However, does PMV ac-
tually reflect the reported sensation levels of the occu-
pants? Table 5 presents the correlation coefficient and
the determination coefficient R
2
between the subjec-
tive and experimental data for all models. The corre-
lation coefficient quantifies the degree of correlation
between two variables, while the R
2
coefficient indi-
cates how well data points fit the linear regression.
The p-value for a regression gives the probability that
the result is not derived by chance. For all results pre-
sented, the p-value is smaller than the threshold (p ¡
0.001) and the results are therefore significant.
In the case of PMV, the highest level of agree-
ment corresponds to trials T1, with a correlation index
of 0.91. The high correlation is somewhat expected
due to the stable conditions encountered throughout
trials T1 (interior temperature rates of change less
than 1.5
◦
C per minute, stable outside temperature
and no wind or precipitation). The experimental data
matches less accurately the subjective reports in trials
T2 and T3. The correlation index between the two is
0.76 for T2 and 0.78 for T3. Overall Flatman’s PMV
tended towards colder reports than the subjective re-
ports. For example, for T1, drivers reported thermal
sensations of up to 4 (corresponding to “very hot”),
whereas Flatman’s PMV did not go beyond 3 (corre-
sponding to “hot”).
The results indicate that PMV can be applied in
vehicle cabins to infer passenger comfort within a
limited set of conditions, however the model brings
forward another important issue in this type of envi-
ronment, the inability to differentiate between differ-
ent parts of the body. Due to the non-uniform nature
of the environment, the difference in thermal sensa-
tion over small distances is considerable and so effec-
tive HVAC control should be able to warm up or cool
down separately different body parts.
With PMV’s accuracy limited to a narrow range of
conditions, the authors further investigated two skin
temperature based models: Taniguchi’s model and
Zhang’s model. For Taniguchi’s model, as Table 5
illustrates, the highest level of agreement corresponds
to trials T1, with a correlation index of 0.56, while
in trials T2 and T3 the match is poor, with correla-
tion indexes of 0.03 and 0.15, respectively. Face skin
temperature seems to have a higher impact on over-
all thermal sensation when the rate of change of air
temperature is low (less than 1.5
◦
C per minute), as
suggested by the higher correlation for trials T1. As
Taniguchi’s model was developed only with respect
to facial skin temperature, it is further interesting to
see if Zhang’s model improves on this by taking into
consideration 8 different body parts.
Zhang’s model was developed, like Taniguchi’s,
for transient environments such as car cabins. Dur-
ing experimentation, skin temperature was sampled
at only 8 sites, compared to the 19 sites specified by
Zhang. This is justified by the fact that within real-
time vehicular comfort control, it would be infeasible
to monitor skin temperature at all locations specified
by Zhang. However, in order to ensure that the sum
of skin temperature segment weights is 1, the weights
for the contribution of local thermal sensations to the
overall sensation were normalised. Mean skin tem-
perature was calculated as a proxy for core tempera-
ture (this approach being suggested by Zhang). The
body part skin temperatures recorded at the beginning
of each trial were used as the set point temperatures
of the body segments in the model. As table 5 shows,
the correlation levels are poor: 0.10 for T1, 0.50 for
T2 and 0.60 for T3. As it stands, for trials T1, facial
skin temperature alone proved to be a better estimator
than the combination of 8 different body parts. The
performance of the two skin temperature based mod-
els does not appear to be sufficient to support vehicu-
lar HVAC comfort control.
ICINCO2014-11thInternationalConferenceonInformaticsinControl,AutomationandRobotics
774

Table 5: Statistic metrics between the models’ thermal sensation index and the reported sensation.
PMV Taniguchi Zhang Nilsson
Type Correlation R
2
Correlation R
2
Correlation R
2
Correlation R
2
T1 0.91 0.85 0.56 0.32 0.10 0.0001 0.93 0.86
T2 0.76 0.57 0.03 0.001 0.50 0.25 0.77 0.59
T3 0.78 0.61 0.15 0.02 0.60 0.35 0.79 0.62
In order to compute the overall thermal sensation
index of Nilsson’s model, the equivalent temperature
at 8 different body parts was averaged based on body
area weights. Once the average equivalent temper-
ature is computed, the overall thermal sensation in-
dex can be found from Figure 1, using the diagram
corresponding to light clothing (the participants wore
light clothing throughout the experiments). Nilsson’s
model had a similar performance to the PMV model.
The highest level of agreement with the subjective re-
ports corresponds to trials T1, with a correlation index
of 0.93. For trials T2 and T3, the correlation index
is lower, of 0.77 and 0.79, respectively. The simi-
lar performance is somewhat expected, because Flat-
man’s PMV index is also based on the measured aver-
age equivalent temperature. The advantage Nilsson’s
model has over PMV is that local thermal sensation
can also be computed and used for control.
5 CONCLUSIONS AND
DISCUSSION
In this paper we evaluated the applicability of four
thermal comfort models, namely PMV, Taniguchi’s
model, Zhang’s model and Nilsson’s model in a range
of conditions specific to cars. A first step towards this
aim was to design experimental trials covering a wide
range of conditions: with preconditioning of the oc-
cupants and cabin at different temperatures, with or
without ambient solar load, wind and precipitations,
with steady or varying outside ambient temperature
and with different temperature rates of change within
the cabin.
Based on the experimentally gathered data, the
PMV index and Nilsson’s index accurately matched
(with correlations of 0.91 and 0.93, respectively) the
occupant reported thermal sensation within a limited
set of conditions: preconditioning of the passenger
and the cabin at the same temperature, a steady out-
side temperature and low rates of change of the in-
terior temperature (lower than 1.5
◦
C per minute).
Higher interior temperature rates of change (up to
9
◦
C per minute), ambient solar load and wind leads
to lower correlation factors, between 0.76 and 0.79.
The overall sensation computed using the two
skin temperature based thermal comfort models
(Taniguchi’s model and Zhang’s model) poorly
matched the subjective reports throughout all trial
types (correlations between 0.10 and 0.60). Overall,
the two skin temperature based models appear to have
little success and their accuracy is not sufficient to
support vehicular HVAC comfort control.
Capitalizing on our findings, Nilsson’s model is
recommended by the authors in preference to the
other three models for vehicular comfort oriented
control. The model provided similar results to PMV.
However, an important advantage Nilsson’s model
has over PMV is its ability to estimate local ther-
mal sensation, which the authors see as an impor-
tant capability for the new generation of vehicular
HVAC control systems. Moreover, Nilsson’s model
only requires two input parameters—equivalent tem-
perature and clothing index—rather than six parame-
ters in PMV’s case, some of which could not feasibly
be determined by an automated system.
The deviation between the Flatman’s PMV out-
put and the subjective responses may be because the
subjects were in contact with the seat and the steer-
ing wheel whereas the Flatman’s dry heat loss sen-
sors were not. This could be confirmed via further
experimentation. Another related avenue for future
work is in regard to heated/cooled seats and steering
wheels. These are becoming more widespread and
will clearly have an impact on thermal sensation and
comfort, which should be evaluated through empirical
work.
It is known that no thermal comfort model can
provide a perfect match for what people feel. The
description of PMV, for example, acknowledges that
any given environment will leave at least 5% of peo-
ple dissatisfied. One reason is the subjective nature of
thermal sensation and comfort in terms of how they
are felt and, also, how they are reported. However,
adopting Nilsson’s model as a basis for estimating oc-
cupant comfort control and further integrating online
learning within the car for tuning individual prefer-
ences would lead to a more thermally comfortable ve-
hicular environment.
ApplicabilityofThermalComfortModelstoCarCabinEnvironments
775

ACKNOWLEDGEMENTS
The Low Carbon Vehicle Technology Project
(LCVTP) was a collaborative research project be-
tween leading automotive companies and research
partners, revolutionising the way vehicles are pow-
ered and manufactured. The project partners included
Jaguar Land Rover, Tata Motors European Techni-
cal Centre, Ricardo, MIRA LTD., Zytek, WMG and
Coventry University. The project included 15 au-
tomotive technology development work-streams that
will deliver technological and socio-economic out-
puts that will benefit the West Midlands Region. The
19 million project was funded by Advantage West
Midlands (AWM) and the European Regional Devel-
opment Fund (ERDF).
The authors would like to thank the anonymous
reviewers for their insightful comments.
REFERENCES
Alahmer, A., Mayyas, A., Mayyas, A., Omar, M., and
Shan, D. (2011). Vehicular thermal comfort models; a
comprehensive review. Applied Thermal Engineering,
31:995–1002.
Arens, E., Zhang, H., and Huizenga, C. (2006). Partial
and whole-body thermal sensation and comfort, part
ii: Non-uniform environmental conditio. Journal of
Thermal Biology, 31:60–66.
Bogdan, A. (2011). Case study assessment of local and gen-
eral thermal comfort by means of local skin temper-
ature. International Journal of Ventilation, 10:291–
300.
Busl, M. (2011). Design of an energy-efficient climate con-
trol algorithm for electric cars. Master’s thesis, Lund
University.
Cheng, Y., Niu, J., and Gao, N. (2012). Thermal comfort
models: A review and numerical investigation. Build-
ing and Environment, 47:13–22.
Cisternino, M. (1999). Thermal climate in cabs and mea-
surement problems. In CABCLI Consortium.
Fanger, P. (1970). Thermal Comfort. Danish Technical
Press.
Fanger, P. (1973). Assessment of man’s thermal comfort
in practice. British Journal of Industrial Medicine,
30:313–324.
Farzaneh, Y. and Tootoonchi, A. (2008). Controlling au-
tomobile thermal comfort using optimized fuzzy con-
troller. Applied Thermal Engineering, 28:1906–1917.
ISO (2005). Ergonomics of the Thermal Environment.
Luo, X., Hou, W., Li, Y., and Wang, Z. (2007). A fuzzy
neural network model for predicting clothing thermal
comfort. Computers and Mathematics with Applica-
tions, 53:1840–1846.
Matsunaga, K., Sudo, F., Tanabe, S., and Madsen, T. (1993).
Evaluation and measurement of thermal comfort in the
vehicles with a new thermal manikin. Technical re-
port, SAE Paper.
Nakamura, M., Yoda, T., Crawshaw, L., Yasuhara, S., Saito,
Y., Kasuga, M., Nagashima, K., and Kanosue, K.
(2008). Regional differences in temperature sensation
and thermal comfort in humans. Journal of Applied
Physiology, 105:1897–1906.
Nilsson, H. (2004). Comfort Climate Evaluation with Ther-
mal Manikin Methods and Computer Simulation Mod-
els. PhD thesis, Royal Institute of Technology.
Nilsson, H. and Holmer, I. (2002). Definitions and mea-
surements of equivalent temperature. Technical re-
port, The Climate Group, National Institute for Work-
ing Life, Solna, Sweden.
Orosa, J. (2009). Research on general thermal comfort mod-
els. European Journal of Scientific Research, 2:217–
227.
Taniguchi, Y., Hiroshi, A., and Kenji, F. (1992). Study
on car air conditioning system controlled by car oc-
cupants’ skin temperatures - part 1: research on a
method of quantitative evaluation of car occupants.
Technical report, SAE Paper.
Ueda, M. and Taniguchi, Y. (2000). The prediction of the
passenger’s thermal sensation level using a neural net-
work and its application to the automobile hvac con-
trol.
van Hoof, J. (2008). Forty years of fanger’s model of ther-
mal comfort:l comfort for all? Indoor Air Journal,
18:182–201.
Wang, D., Zhang, H., Arens, E., and Huizenga, C. (2007).
Observations of upper-extremity skin temperature and
corresponding overall-body thermal sensations and
comfort. Building and Environment, 42:3933–3943.
Zhang, H. (2003). Human Thermal Sensation and Comfort
in Transient and Non-Uniform Thermal Environments.
PhD thesis, University of California, Berkeley.
ICINCO2014-11thInternationalConferenceonInformaticsinControl,AutomationandRobotics
776
