
A Visual Programming Language for Soccer
António Belguinha
1
, Pedro Rodrigues
1
, P. J. S. Cardoso
1
,
J. M. F. Rodrigues
1,2
and Domingos Paciência
1
1
ISE, University of the Algarve, Faro, Portugal
2
Vision Laboratory, LARSyS, University of the Algarve, Faro, Portugal
Keywords: Visual Programming Language, Web Application, Sports Analysis.
Abstract: The use of Information Technologies (IT) in high competition sports is an instrument often used. However,
the majority of the performers, including technical teams, do not have skills to program those IT tools to
their needs. In this paper we present the low level implementation of a visual programming language (VPL)
that allows the user without programming expertise to produce relatively complex programs by drawing
them on a web application. The VPL tool application is illustrated by applying it to detect programmed
situations from a soccer game, using previously obtained tracking data. The tool can be applied to other
collective ball sports.
1 INTRODUCTION
Aiming for excellence is the keyword to everyone
involved in soccer. While players need to show their
physical and tactical skills on the pitch, coaches and
their remaining staff need to have their own tools so
that they can perform at higher levels. Granting to
all the parts a multi-functional information system,
with the objective of minimizing the adverse effects
from the most critical and sensitive points of soccer
is then critical. A match analysis, for example, can
generate a huge amount of raw data and statistics.
Consequently, it is very important to have a way to
process that data, providing only the most important
information to the coach, as soon as possible.
Furthermore, a manual match analysis of soccer
games represents a huge amount of work, which
whenever possible should be done by an automatic
or semi-automatic process.
Footdata (Rodrigues, et al., 2013) is a project in
development by the University of the Algarve,
Inesting, S.A., and the soccer coach Domingos
Paciência. The goal is to build a web application
product for soccer, which integrates two
fundamental components of this sport's world: i) a
social network (FootData-Social), which provides
the typical features adapted to the soccer reality, and
ii) the professional component (FootData-PRO),
which can be considered as a Soccer Resource
Planning (SRP), featuring a system for acquisition
and processing of information to meet all the soccer
management needs. The latter includes (between
other things) an automated platform to gather
information from the teams. This platform will be
based on a system that will process live images
acquired on-site, using a single or a group of
cameras placed together in the stands, or images
gathered from a Full HD Handycam. One of the
main objectives is to automatically collect
information and on-the-fly alert the technical staff
about specific events. All the above should be
presented in a web (browser) environment,
accessible from a personal computer or a mobile
device (smartphone or tablet).
Furthermore, each technical staff has data that
they would like to be treated and analyses but, in the
majority of the cases, they do not have the
programming skills to implement software capable
of such. In order to detect the different game
situations from different coaches, we had to develop
a tool that allows passing from a visual component
to a programming (code) component, i.e., a Visual
Programming Language (VPL) framework for
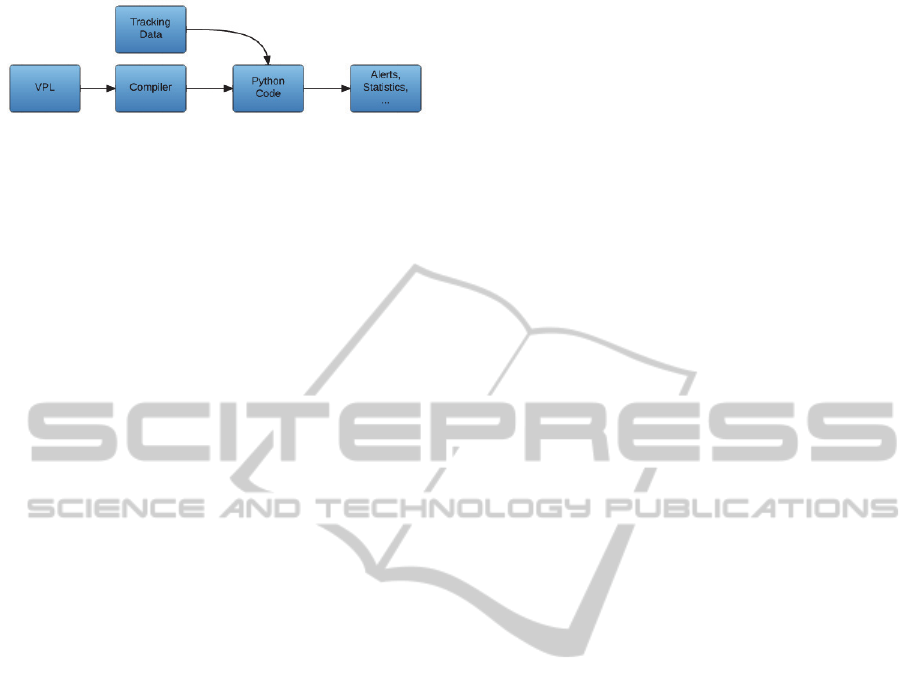
soccer (see Figure 1). The main feature consists in
the design of an Interface Development
Environment (IDE) and a compiler to transform the
sketch into a programming language.
121
Belguinha A., Rodrigues P., Cardoso P., Rodrigues J. and Paciência D..
A Visual Programming Language for Soccer.
DOI: 10.5220/0005105901210127
In Proceedings of the 9th International Conference on Software Paradigm Trends (ICSOFT-PT-2014), pages 121-127
ISBN: 978-989-758-037-6
Copyright
c
2014 SCITEPRESS (Science and Technology Publications, Lda.)
In more detail, a VPL is any programming
language that allows users to create programs by
using graphical elements rather than specifying them
textually. Many VPLs are based on the idea of
"boxes and arrows," where boxes or other screen
objects are treated as entities, connected by arrows,
lines or arcs which represent relations. Usually,
VPLs are used in the context where the programmer
has limited programming knowledge.
For example the KTechlab (KTechlab, 2014) is a
VPL for microcontrollers and electronics that uses
flowcharts to program microcontrollers graphically.
Another VPL example is Scratch (Scratch, 2014)
(Resnick, et al., 2009) which uses an intuitive
interface with blocks shaped to fit together only in
ways that make syntactic sense, allowing to program
various actions easily without having programming
knowledge. Because of this features, Scratch is
successfully being used to teach new programmers
and for educational propose. Another similar web-
based VPL application is a Google project called
Blockly (Blockly, 2014), which allows making short
programs in a web environment by dragging and
dropping programming blocks to interact with
virtual objects on the computer screen.
Even for more advanced programmers, there are
VPLs. For example, Simulink® (Tyagi, 2012) is a
block diagram environment for multi-domain
simulation and Model-Based Design integrated with
Matlab®. Simulink supports system-level design,
simulation, automatic code generation, and
continuous test and verification of embedded
systems. With some similarity we have the Scicos
(Scicos, 2014), which is a graphical dynamical
system modeler and simulator. With Scicos the user
can create block diagrams to model and simulate the
dynamics of hybrid dynamical systems and compile
models into executable code. Scicos is used for
signal processing, systems control, queuing systems,
and to study physical and biological systems. Other
examples of Visual Processing Languages applied to
specific situations are presented in (Dobesova,
2011), (Marchiori & al., 2011) and (Tekli, et al.,
2013).
In this paper we describe the low level
implementation of a system that aims at creating an
interface which allows coaches to “program” their
team's movements and specific game situations
using a web-browser VPL environment. Satisfying
the prerequisites, and based on the transmitted
experience of the consultant technical teams, the
interface is prepared to be intuitive and easy to use,
providing the necessary tools for the coaches to
describe their team procedures. Besides, the
developed application is a web application that runs
on the majority of the most common web browsers
(e.g., Firefox, Chrome, Safari and Internet Explorer).
The application includes tools to represent several
aspects of soccer, namely areas, movements from
players and ball, and passes. In this sense, there are
obviously a large number of scenarios where VPL
are useful. This paper main focus isn't the design
itself (i.e., the IDE building) but passing from the
visual representation to code, and further testing in
soccer game environment. Our main objective in this
paper is to propose our low level implementation off
a VPL that can be applied to most collective ball
sports.
The remaining document is structured as follows.
Section 2 presents our soccer visual programming
language. Section 3 and 4 show how the VPL is
compiled and executed and Section 5 presents some
experimental tests. Finally, we conclude the paper
with a brief discussion and the presentation of some
future work in Section 6.
2 FOOTDATA’S VISUAL
PROGRAMMING LANGUAGE
The FootData’s development environment interface
is called Field Editor (FE), which in the front end
can be considered as a visual IDE web-based tool,
created using HTML 5, CSS, and Javascript. The FE
allows the coaches to draw the desired team
movements and other specific situations for future
statistical compilation. The features already
implemented in the FE include tools to draw and edit
the settings of players, ball, areas and distances.
Figure 2 shows an example of a situation drawn
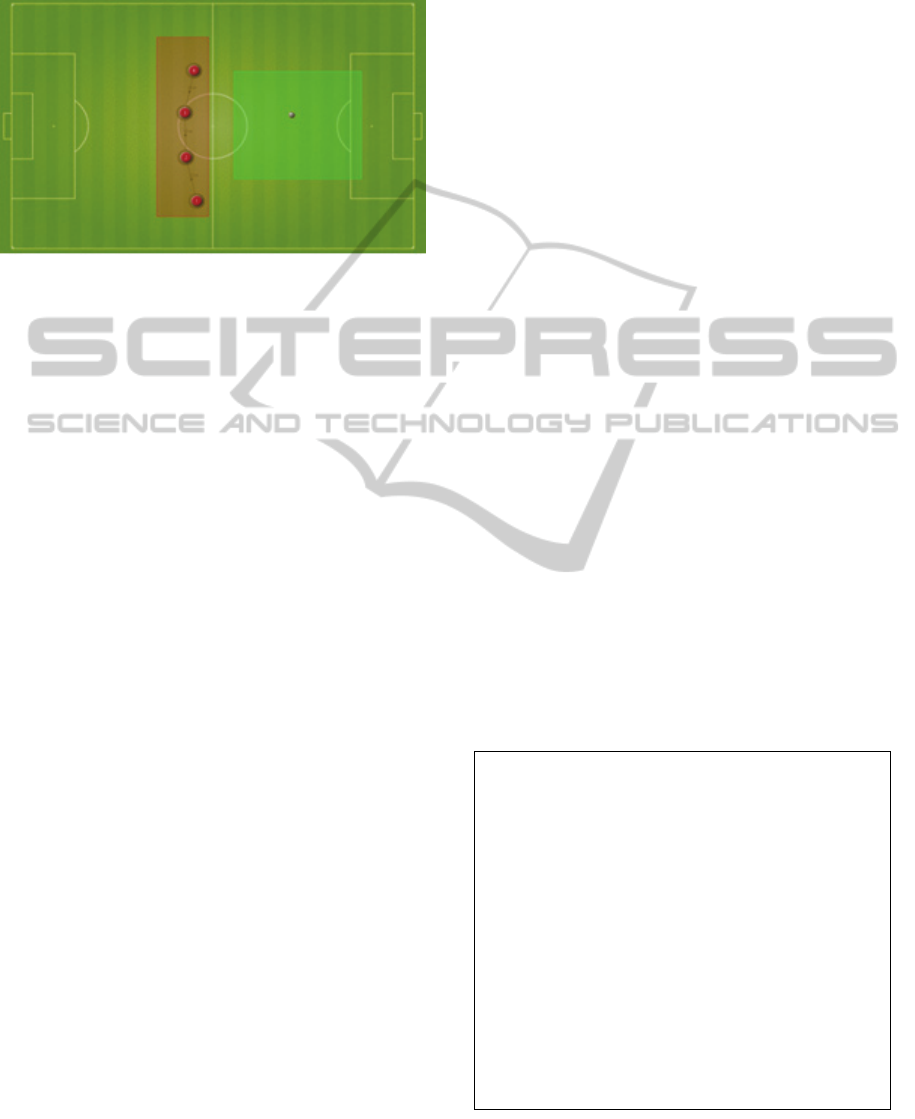
in the Field Editor that contains four players
(represented by red circles), a ball, three distances
lines between the players and two zones. The
objective of this drawing is to verify that whenever
the ball is inside the green zone, the players should
be inside the red zone keeping a distance of 12
meters between them. We should notice that
although it is not shown in the picture, the distance
between the players admits an error of 3 meters,
value configurable in the FE interface. As mentioned
Figure 1: Architecture of the system.
ICSOFT-PT2014-9thInternationalConferenceonSoftwareParadigmTrends
122
before, the main focus of this paper is not to explore
the FE interface, so for more details about the FE
interface please refer to (Rodrigues, et al., 2013).
Figure 2: Example of a draw made on the Field Editor
representing four players that should be at the red zone
when the ball is inside the green one.
When the user completes the draw of the desired
team movement, typically the coaches or some other
member of the technical team, this has to be passed
to the FootData datacenter so that the depicted
movement is committed to the database (allowing
posterior load and re-edition), and transformed into
code which is then matched against the
acquired/tracked images.
Also outside the scope of this paper is the
tracking framework, developed inside the FootData
project. In resume the tracking framework is
composed by an application capable of doing the
tracking of the players and ball, given images of the
full size pitch. Please refer to (Rodrigues, et al.,
2013) for further details.
3 SERIALIZATION OF THE
DRAWN SCHEMAS
Returning to the communication between the FE
(web application) and the FootData datacenter, a
serialization process was thought tacking into
consideration the fact that the FE is implemented
over JavaScript and the FootData’s libraries used for
the verification of the procedures were programmed
in Python. In this case, the draw is converted to a
JSON document (JSON, 2014), which is a
lightweight data-interchange format. Using the
JSON type of format allowed us to take advantage of
(1) the JavaScript facilities to treat JSON
documents, (2) the fact that those documents are
very similar to Python dictionaries avoiding intricate
parsing procedures, and (3) the fact that the database
used to store the document is MongoDB
(MongoDB, 2014). MongoDB is a cross-platform
document-oriented database system, classified as a
noSQL database, which eschews the traditional
table-based relational database structure in favor of
JSON-like documents.
Figure 3 shows an example of the JSON
document generated by the FE to translate the
procedure depicted in Figure 2. The JSON document
has a predefined structure, that include the scheme
name, the type, the field dimensions, the field scale,
the players, the ball, the lines, the distances and a list
of conditions.
In more detail, the name attribute refers to the
name given by the coach to the drawn schema and
the type is used to categorize the procedures. The
attributes field_dimension and field_scale have also
to be passed, because the soccer pitch image used in
the field editor has been designed to a normalized
field dimension, which in general will not match the
dimensions of the majority of the stadiums, who
have slightly varying sizes. Knowing the field
dimensions where the game will occur and drawn
the specific game schemas to be detected, it is then
possible to adjust the depicted procedure to a
particular stadium.
The players attribute has an array that takes an
embed JSON object, a subdocument, for each player
inserted in the field editor, following the structure:
{"id":#, "number":#, "team":"#", "points": [#, #]}. A
different id is attributed to each object inserted in the
FE, so we can refer to any object by its id. The
subdocument has also the player's team, number,
field points (which is the player's coordinates on the
pitch, in pixels) and radius (value in meters in which
the player position can vary).
Figure 3: Example of JSON document generated at the
FE.
{“name”: “schema 1”, “description”: “BP”,
“type”: “DP”, “field_dimension”: [105, 68],
“field_scale”: [0.1, 0.1],
“players”:[{“id”:1,“number”:1,”team”:“A”,“points”:[514
,559],“radius”:3},{“id”:2,“number”:2,“team”:“A”,
“points”:[486, 438],“radius”:3},{“id”:3,“number”:3,
“team”:“A”,“points”:[483,314],“radius”: 3},{“id”:4,
”number”:4,”team”:“A”,“points”:[507,197],“radius”:3}
],
“ball”:{“id”:5,”points”:[762, 320],“owner”: “None”},
“zones”:[{“id”:7,“name”:“Zone 7”,“points”:[[945,498],
[945,198],[611,198],[611,498]]},{“id”:6,“name”:“Zone
6”,“points”:[[546,603],[546,103],[409,103],[409,
603]]}],
“lines”:[{“id”:10,”objects”:[3,4]},{“id”: 9,”objects”:
[2,3]},{“id”:8,”objects”:[1, 2]}],
“distances”:[{“objects”:[3,4],“distance”:12,“margin”:3
},{“objects”:[2,3],“distance”:12,“margin”:3},
{“objects”: [1, 2], “distance”: 12, “margin”: 3}],
“conditions”:[[{“verify_location”:[1,“IN”,6]},
{“verify_location”:[2,“IN”,6]},{“verify_location”:[
3,“IN”,6]},{“verify_location”:[4,“IN”,6]},
{“verify_location”:[5,“IN”,7]},{“verify_distances”:
true}],[{“alert”:“True”,msg”:“Pressing the ball “}],
[{“alert”: “False”,”msg”: ““}]]
}
AVisualProgrammingLanguageforSoccer
123

When inserting the distances between two
players, a line object is created containing a self id
and the ids of the objects which define the distance
line (start and end). The result is the structure {"id":
8, "objects": [1, 2]} which indicates that there is a
line between players with id 1 and 2. The distances
information is then placed in another attribute called
distances, which contains an array with objects
having the information about the objects ids, the
distance and an error margin in meters. For instance,
the object with that information has the following
structure {"objects": [3, 4], "distance": 12, "margin":
3}, which for the presented case means that objects
with id 3 and 4 (corresponding to the players with id
3 and 4, respectively) should maintain a distance of
12 meters, allowing an error of 3 meters.
The zones inserted in the FE can be elliptical,
rectangular or free draws, but they are all treated as
polygons. Those polygon vertices, that represent
coordinates in the soccer field, are then inserted into
a zones array in the JSON document. As before,
each zone as also an unique id and a representation
that follows, e.g., the structure {"id": 6, "name":
"Zone 6", "points": [[546, 603], [546, 103], [409,
103], [409, 603]]}.
Having all this information gathered, we added
one last attribute to the JSON document to allow the
program to know what is to be detected. That
attribute is called conditions. As the name suggest,
in this field it is possible to create conditions, more
specifically, if-then-else statements. To do it, we
defined a structure with an array with 3 entries: the
first one is the if condition, the second one is the
then statement and the last one is what to do if the
condition is false (i.e., the else statement).
Some combinations providing more complex
programs are also possible. For example: it is
possible to program chained if-then-else statements,
by adding inside the then or else statements others if-
then-else statement, i.e., including more “three
element arrays” that follow the previously presented
structure. There are also some keywords. For
example, verify_location will
call a function,
implemented in the mentioned Python library, which
verifies if a certain object is inside or outside a zone.
The verify_distances has a similar behavior, i.e., it
calls a function which returns a boolean value upon
the verification of the distances defined in the JSON
document (see Figure 3).
4 CONVERTING THE
SERIALIZED DOCUMENT
Having the serialization as a JSON structure it is
now necessary convert it to Python code. First the
variables corresponding to the players, distances,
lines and zones are instantiated from the pre-
implemented Python classes. These Python instances
are saved to a file using a serializer, so that the
objects will be simply loaded avoiding their creation
every time the verification of the schema is run. This
process is also justified by the fact that data from the
FE is saved in a MongoDB and having the files with
the objects already instantiated will speed up the
initialization process. The next step is to convert the
conditions to Python code, which is done by
recursively accessing the conditions array, and
creating the if-then-else code from the sent
statements. The conditions names are matched to
their correspondent methods already implemented in
our Python library. For example, the matching
method to the “verify_location": [5, "IN", 7]” in the
JSON document (Figure 3) corresponds to the
function verify_location(frame, ['ball', 'IN', zone7])
in our Python code, which receives a frame from the
tracking system and checks if the ball is inside the
region defined as zone7. Figure 4 shows the Python
code which corresponds to the JSON document
presented in Figure 3.
Figure 4: Python code generated from the JSON
document.
Now that we have the code generated, information
about the players and the ball position is needed in
order to check the depicted procedures. As already
mentioned, this information is obtained using a
tracking system (Rodrigues, et al., 2014) that
returns, for each frame, the players’ and ball’s
positions in meters from the top left corner of the
from lib import gpm
def run():
result = False
if pm.verify_location(frame,['ball','IN',zones7]):
if
gpm.verify_location(frame,[players2,'IN',zones6]):
if gpm.verify_location(frame,
[players3,'IN',zones6]):
if gpm.verify_location(frame,
[players4,'IN',zones6]):
if gpm.verify_location(frame,
[players1,'IN',zones6]):
if gpm.verify_distances(frame,
distances) :
gpm.sendmsg('Pressing the ball')
gpm.sendalert('True')
result = True
else:
gpm.sendmsg('')
gpm.sendalert('False')
result = False
return result, gpm
ICSOFT-PT2014-9thInternationalConferenceonSoftwareParadigmTrends
124

pitch, u
s
p
lace t
h
field.
The
m
of pre-i
m
game a
n
each me
the file
that is r
e
Python
f
objects.
the alre
a
drawn
m
The
c
set of n
o
returned
Figure 5
Figure
In o
u
verified
in the g
r
the pla
y
distance
s
verificat
i
statistic
s
Figure
6
from th
e
verify t
h
compos
e
each di
p
layers’
b
etween
name T
r
is correc
Fig
u
'ver
i
objec
t
8
object>
{'play
s
ing homogr
a
h
e objects (p
l
m
odule gpm
m
plemented
n
d also recor
d
thod that is
e
name is pas
s
e
sponsible to
i
f
ile (Figure 4
)
The objects
a
a
dy imported
m
m
ovemen
t
.
c
ode can no
w
o
f frames. At
with the re
s
resumes the
a
5: Architectur
e
u
r example,
s
if the ball is
i
r
een zone it
i
y
ers are in t
h
s
are corr
e
i
ons result a
r
s
for what or
6
shows an e
x
e
verify_dista
n
h
e distances
b
e
d by an arra
y
stance verif
i
objects, the
the objects i
n
r
ue or False
f
c
t or not.
u
re 6: Output fr
o
i
fy_distances':
t
>),'False':Non
e
.04}, {'player
s
),'True': None,
ers':(<Player
o
'distance_de
f
a
phy (Sebe
&
l
ayers and b
a
imported in
F
methods use
d
d
s the inform
a
e
xecuted. To
r
s
ed by pa
r
a
m
i
mport the pr
e
)
, and the pr
e
a
re deserializ
e
m
odule with
t
w
be run for e
a
the end, a P
y
s
ult for ever
y
a
rchitecture e
x
e
used to run t
h
s
ketched in F
i
i
n the green
z
i
s then verifi
e
h
e red zone
a
e
ct. For e
r
e stored, ena
b
who is faili
n
x
ample of th
e
n
ces method,
b
etween play
e
y
with a Pyt
h
i
ed. The di
c
defined dist
a
n
that frame
a
f
or easily ver
i
o
m verify_dist
a
[{'players':(<
P
<Player
e
,'distance_def
s
':(<Player obj
e
'distance_def'
9.95},
o
bject>,<Player
None,
f
': 12,'distanc
e
&
Lew, 200
3
a
ll) in the
m
F
igure 4 has
a
d
to analyze
a
tion gathere
d
r
un the code,
m
eter to a mo
e
viously gene
r
viously seria
l
e
d and loaded
t
he code fro
m
a
ch frame or
f
y
thon dictiona
r
y
frame anal
y
x
plained abo
v
h
e game schem
a
i
gure 4, first
z
one. If the b
a
e
d individual
l
a
nd at last i
f
ach frame
b
ling us to c
r
g in this sch
e
e
output obt
a
which is us
e
e
rs. The outp
u
h
on dictionar
y
c
tionary has
a
nce, the dist
a
a
nd a key wit
h
i
fy if the dist
a
a
nces function.
P
layer object>,
':12,'distance'
e
ct>,<Player
: 12, 'distanc
e
object>),'True'
e
': 11.65}]
3
) to
m
odel
a
set
the
d
by
first
o
dule
r
ated
l
ized
into
m
the
f
or a
ry is
y
zed.
v
e.
a
s.
it is
a
ll is
ly if
f
the
the
r
eate
e
ma.
a
ined
e
d to
u
t is
y
for
the
a
nce
h
the
a
nce
5
In
fro
m
lan
g
an
a
sof
t
5.
1
Fig
u
Fig
u
Th
e
ins
i
cor
r
obt
a
9.
T
fea
t
ver
i
ins
i
F
b
e
'N
u
obj
e
out
{T
r
:
e
':
'
:
"t
1
"c
r
fro
m
def
r
e
i
f
el
r
e
COMP
U
this section
w
m
the appli
c
g
uage. For t
e
a
lyze the socc
t
ware and has
1
Test 1
u
re 7: Situatio
n
u
re 8: JSON d
o
e
first test i
s
i
de a zone (
s
r
esponding J
S
a
ined after th
e
T
his example
t
ure “player
i
fied if play
e
i
de that zone.
F
igure 9: Comp
i
Two exampl
e
(1){'verify_l
o
u
mbe
r
: 6, ‘
T
e
ct>, 'condit
i
s
ide the defi
n
r
ue: None, '
fi
{
"name": "Test
1
"
field
_
dimensi
o
0
.099], "ball"
:
t
eam": "B", "po
i
1
, "name": "Zon
a
[2
c
onditions":[[{
"
r
t": "True", "m
s
m
lib import gp
m
run():
e
sult = False
f
gpm.verify_lo
c
gpm.sendmsg('E
v
gpm.sendalert(
'
result = True
se:
gpm.sendalert(
'
result = False
e
turn result, g
p
U
TATION
A
w
e present s
c
ation of t
h
e
sting propo
s
er game is re
a length of 2
:
drawn in the
F
cument for Te
s
s
a simple e
x
s
ee Figure 7
)
S
ON docume
n
e
compilatio
n
shows a sim
p
inside zone”
,
e
r number ‘
6
i
led Python co
d
e
s of the outp
u
o
cation': {Fa
l
T
eam’: B',
i
on':'IN'}, 't':
2
n
ed zone; an
d
fi
rst_arg': 'N
u
1
", "descriptio
n
o
n": [105, 68 ],
{},"players":
[
i
nts": [324, 63
3
a
1", "points":
[
2
36,571],[236,6
8
"
verify
_
locatio
n
s
g": "Event Y"}]
]]}
m
c
ation(frame,[p
l
v
ent Y')
True')
False')
p
m
A
L TEST
S
s
ome tests a
n
h
e visual pr
s
es,
t
he dat
a
e
turned by th
e
:30 minutes.
F
E, player insid
s
t1 example (F
i
x
ample with
)
. Figure 8 s
h
n
t and the Py
t
n
is presented
m
ple applicati
o
, in which i
t
6
’, from tea
m
d
e from Test1
e
u
t for this sit
u
l
se: None, '
f
'second_arg'
2
58} if the
d
(2){'verify
_
u
mbe
r
: 6, ‘T
e
n
": "","type":
"
,
"field
_
scale"
:
[
{"id":2,"numbe
r
3
]}],"zones":
[
[
[421,686],[421
,
8
6]]}],
n
":[2,"IN",1]}]
,
]
,[{"alert": "F
a
l
ayers2,'IN',zo
n
S
n
d results
o
graming
a
used to
e
tracking
e
a zone.
gure 8).
a player
h
ows the
t
hon code
in Figure
o
n for the
t
will be
m
‘B’, is
xample.
ation will
f
irst_arg':
: <Zone
player is
_
location':
e
am’: B',
"
PO",
:
[0.1,
r
":6,
[
{"id":
,
571],
,
[{"ale
a
lse"}
n
es1]):
AVisualProgrammingLanguageforSoccer
125

'second_arg': <Zone object>, 'condition': 'IN'},
't':538} if the player is inside the zone.
In this case, the difference between the two
outputs is the existence of a dictionary key with the
name True or False to validate or not the situation.
A simple analysis of the output can be the counting
of how long the player stayed in the area. In our
example of 2:30 minutes, the player was 39,4% of
the time in that zone.
5.2 Test 2
The second test analyzes the results obtained from
the example in Figure 2, explained along the
previous sections of this paper.
Figure 10, returned by the tracking software,
depicts frame 947 of the analyzed soccer game,
along with the zones and distances between players
in the pitch. The image is a screenshot from a
development tool used for the visualization of what
is being processed.
Figure 10: Visual scheme being processed.
As mentioned before, for each frame we will
have a Python dictionary with the information
gathered by the methods executed to detect if the
“drawing” is being accomplished.
Figure 11: Output from frame 947.
Figure 11 shows the output for frame 947, in
which is presented the result from the
verify_location and verify_distances. In
verify_location each array element contains the
result from one object, in our case the ball and four
players, each element has a key with the name True,
that means that the players and the ball are inside
their predefined zone. The verify_distances follows
the same principle, having one element of the array
for each distance verified. As all the players are
complying the distances between them, being inside
the predefined zone when the ball is at the other
zone, the output from Figure 11 confirms that they
are doing what was drawn in the Field Editor.
6 CONCLUSIONS
This paper presented our implementation aspects of
a VPL for soccer analysis, built to help the coaches
and technical teams in the improvement of their
players and team’s performance by allowing them to
drawn the expected procedures and verifying if the
players are complying with them. This VPL can also
be applied to other collective ball sports.
This web tool allows, without previous
programing knowledge, to make fairly complex
analysis just by using some of the implemented
features. The tool analyses the pretended procedures
for each frame, giving the chance to the coach to
analyze thoroughly a great number of game aspect
that previously would require programming
knowledge skills or exhaustive man work. The tool
allows to send alerts to a mobile device during a
game if some particular event happens or not,
making real time adjustments to the team possible,
in order to accomplish the pretended performance.
For being used with other sports, it would be
only necessary make some minor adjust, like icons
and the background pitch, since de functionalities
implemented are not specific for soccer.
It is also important to refer that this tool can be
used to study the opposite team procedures after or
during a game. This gives the coaches an
opportunity to be better prepared when playing
against other teams, or once more, if used during a
game, to be notified in the bench and adjust how the
team is performing. This tool can become a game
changer for the ones who use it, bringing soccer to a
whole new level.
ACKNOWLEDGEMENTS
This work was supported by FCT project PEst-
OE/EEI/LA0009/2013 and project FootData QREN
I&DT, n.º 23119. We also thanks to project leader
{'verify_location':[{‘True’:None,'first_arg':'ball',
'second_arg':Zones7,'condition':'IN'},
{‘True’:None,'first_arg':'Number:2,Team:A’,'second_arg'
:Zones6, 'condition': 'IN'},
{True: None, 'first_arg': 'Number: 3, Team: A
','second_arg':Zones6,'condition': 'IN'},
{True: None, 'first_arg':'Number:4, Team:A',
'second_arg': Zones6, 'condition': 'IN'},
{True:None, 'first_arg': 'Number:1, Team:A '
'second_arg': Zones6, 'condition': 'IN'}],'t': 947,
'verify_distances':[{'players': ('Number:3, Team:A',
'Number:4, Team:A'), 'True':None, 'distance_def':12,
'distance':9.83},{'players':('Number:2,Team:A','Number:
3,Team:A'),'True':None,'distance_def':12,'distance':11.
44},{'players':('Number:1,Team:A','Number:2,Team:A'),
'True': None,'distance_def': 12, 'distance': 14.14}]}
ICSOFT-PT2014-9thInternationalConferenceonSoftwareParadigmTrends
126

Inesting, S.A. [www.inesting.com], and the
consultant soccer coach Domingos Paciência and
our colleague Carlos Gomes.
REFERENCES
Blockly, 2014. [Online] Available at:
http://code.google.com/p/blockly [Accessed 04 04
2014].
Dobesova, Z., 2011. Visual programming language in
geographic information systems. s.l., s.n.
JSON, 2014. [Online] Available at: http://www.json.org
[Accessed 04 04 2014].
KTechlab, 2014. [Online] Available at:
https://github.com/ktechlab [Accessed 04 04 2014].
Marchiori, E. J. & al., e., 2011. A visual language for the
creation of narrative educational games. Journal of
Visual Languages & Computing, Volume 22, pp. 443-
452.
MongoDB, 2014. [Online] Available at:
https://www.mongodb.org [Accessed 04 04 2014].
Resnick, M. et al., 2009. Scratch: programming for all.
Commun. ACM, 11, 52(11), pp. 60-67.
Rodrigues, J. et al., 2014. A computer vision based web
application for tracking soccer players. 16th Int. Conf.
on Human-Computer Interaction. Crete, Greece, 22-27
Jun.
Rodrigues, P. et al., 2013. Open Source Technologies
Involved in Constructing a Web-Based Football
Information System. Advances in Information Systems
and Technologies, vol. 206, pp. 715–723. Springer
Berlin Heidelberg.
Rodrigues, P., Cardoso, P. & Rodrigues, J., 2013. A Field,
Tracking and Video Editor Tool for a Football
Resource Planner. In Proc. 8th Iberian Conf. on
Information Systems and Technologies. Lisbon,
Portugal, pp. 734-739.
Scicos, 2014. [Online] Available at: http://www.scicos.org
[Accessed 04 04 2014].
Scratch, 2014. [Online] Available at:
http://scratch.mit.edu/ [Accessed 04 04 2014].
Sebe, N. & Lew, M., 2003. Robust computer vision:
Theory and applications. The Netherlands: Kluwer
Academic Publishers.
Tekli, G., Chbeir, R. & Jacques, F., 2013. A visual
programming language for XML manipulation.
Journal of Visual Languages & Computing, Volume
24, pp. 110-135.
Tyagi, A. K., 2012. MATLAB and SIMULINK for
Engineers. Oxford University Press.
AVisualProgrammingLanguageforSoccer
127
