
Monitoring Protected Areas Using Remote Sensing Technology
Zahra Ghofrani
1
, Kali Prasad Nepal
1
, and Adham Beykikhoshk
2
1
School of Engineering, Faculty of Science, Engineering and Built Environment, Deakin University, Geelong, Australia
2
Centre for Pattern Recognition and Data Analytics, Deakin University, Geelong, Australia
ghofrani@deakin.edu.au, kali.nepal@deakin.edu.au, abeyki@deakin.edu.au
Keywords: change detection, remote sensing, protected areas
Abstract: Due to irrational use of natural resources, human society is facing unprecedented threats. Remote sensing is
one of the essential tools to determine changes in various forms of biological diversity over time. There are
many methods to determine changes in protected areas, using satellite images. In this paper after introducing
different change detection methods and their advantages and disadvantages, a hybrid method is used to
analyse changes in forests and protected areas in a national park. Two Landsat images of Golestan National
Park in Iran (taken in 1998 and 2010) were used. This hybrid approach combines Change Vector Analysis
(CVA) for flagging the occurrence of changes, followed by signature extension to assign labels to changed
pixels. The main objective of this paper is to propose a method for discovering and assessing environmental
threats to natural treasures.
1 INTRODUCTION
Selecting the most appropriate change detection
method for a given application is difficult, and
requires consideration of the change type of interest
(Fraser, Olthof, and Pouliot, 2009). Wide range of
change detection algorithms are now available which
may be broadly grouped as classification methods
(Chen and Chen, 2012), (Hermitte, Verbesselt,
Verstraeten, and Coppin, 2011) and spectral
approaches (Fraser et al., 2009). If sources of image
noise are adequately controlled, spectral approaches
quantify the magnitude of reflectance changes
between different dates, which relate to a land surface
change.
One advantage is the potential to fine-tune change
detection sensitivity, while a limitation is the inability
to provide information on the nature of change e.g.
class label (Xiaolu and Bo, 2011). Examples of
spectral-based methods include: image differencing,
regression and change vector analysis (Fraser, Li, and
Cihlar, 2000), (Johnson and Kasischke, 1998),
(Prakash and Gupta, 1998), (Fraser, Olthof, and
Pouliot, 2009).
Classification approaches such as post-
classification comparison and two-date image
clustering, in contrast identify both the occurrence of
changed pixels and the type of change by directly
labelling land cover at two time periods. However,
they are susceptible to generating high levels of
commission error due to the multiplication of
individual errors (Yuan, Sawaya, Loeffelholz, and
Bauer, 2005), (Fraser, Olthof, and Pouliot, 2009).
There are also hybrid change detection procedures
that exploit the advantages of each approach, while
attempting to minimize their limitations (Luque,
2000), (Petit, Scudder, and Lambin, 2001),
(Silapaswan, Verbyla, and McGuire, 2001).
This paper presents a hybrid change detection
algorithm. In this approach, a mask of potential
changed pixels is first created by thresholding a two-
date change vector analysis (CVA) product. Land
cover class is then updated for changed areas only by
spectral signature extension, whereby changed pixels
are matched to the most similar labelled cluster from
a baseline land cover map.
This method exploits the benefits of both spectral
and classification type methods, and reduces their
weaknesses (Fraser et al., 2009). Thus, the accuracy
of this hybrid method is expected to be higher than
each method individually. It is also focused on
decreasing the role of human operators in the process.
This method extracts image data better than the others
and also enables labelling to be done automatically
using post classification comparison and pre-existing
knowledge of the land cover data.
This paper is organized as follows: Section 2
describes the case study area and the required data for
107
Ghofrani Z., Nepal K. and Beykikhoshk A.
Monitoring Protected Areas Using Remote Sensing Technology.
DOI: 10.5220/0005422001070113
In Proceedings of the Third International Conference on Telecommunications and Remote Sensing (ICTRS 2014), pages 107-113
ISBN: 978-989-758-033-8
Copyright
c
2014 by SCITEPRESS – Science and Technology Publications, Lda. All rights reserved
analysis. Section 3 represents the proposed change
detection algorithm. Section 4 describes the
environmental analysis. Finally, in section 5, our
conclusions are drawn.
2 CASE STUDY AND REQUIRED
DATA
Golestan National Park with 92,000 hectares area is
the biggest and oldest registered national park in Iran.
This forest was registered with the UNESCO World
Heritage List in 1976 as one of the 50 vital protected
areas on earth. The geographical area of Golestan
National Park is between 55° 43’ 16” to 56° 15’ 31”
longitudes and 37° 16’ 51” to 37° 32’ 27” latitudes.
The average elevation of this park is 1378 meters.
Different data types used in this study are
introduced below.
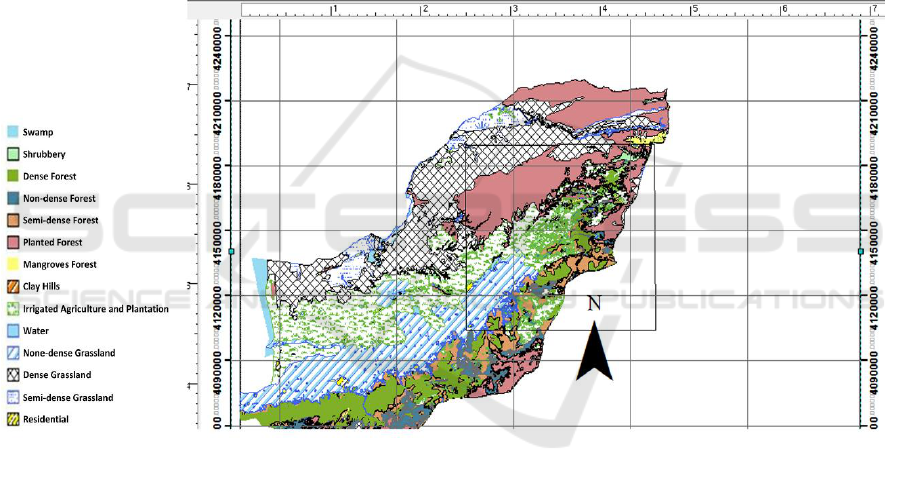
2.1 Topographic Map
The only map available for the study area is a
1:250,000 topographic map produced in the spring of
1998 by a group of forestry research organizations
using Landsat ETM+ images (Figure 1).
Figure 1: The topographic map of the study area in 1998
2.2 Landsat Images
For this research, two Landsat images taken in August
1998 and 2010 (a period of 12 years, which is an
appropriate period for assessing environmental
changes) were used. The radiometric and geometric
calibration parameters of these images are available
and cloud cover over the area in the images is
negligible. Image dimensions are 8091 × 7231 pixels
and the field of view is about 185 × 175 km (Figure
2). For Landsat TM images, the UTM system and
WGS84 ellipsoid were used for geo-referencing.
2.3 High Resolution Images
Since there was no updated map for the case study
area, in order to evaluate the accuracy of the method,
we used Geoeye high-resolution images for 2010.
The mosaic Geoeye images have been cut to the
thresholds of Landsat images’ latitude and longitude
(Figure 3).
Third International Conference on Telecommunications and Remote Sensing
108
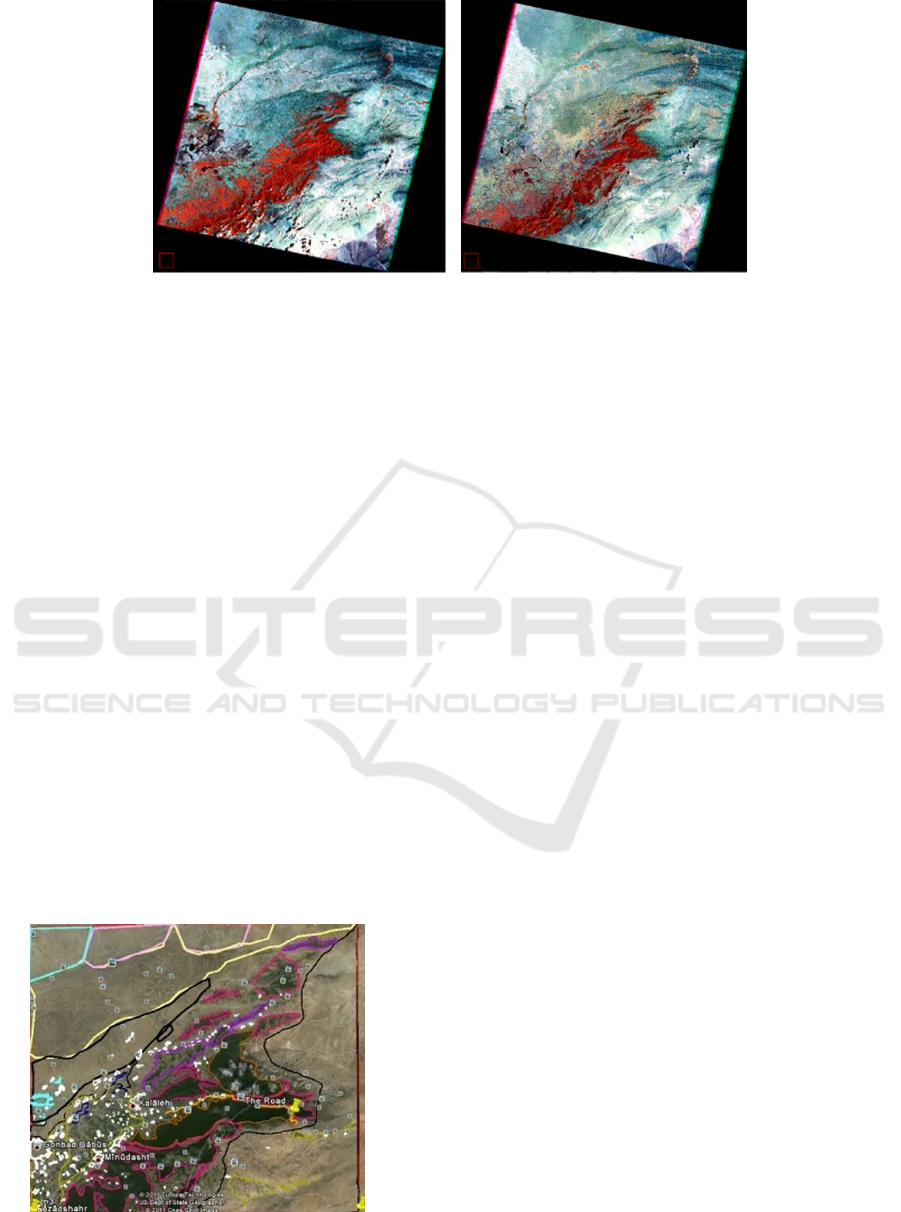
(a) (b)
Figure 2: Landsat images (false colour composites), of the study area (a) August 1998 and (b) August 2010.
3 CHANGE DETECTION
ALGORITHM
This method consists of four main steps. Pre-
processing level as the first step, includes obtaining
images and reference maps, image registration and
normalization. The purpose of this step is to prepare
the images for the next step.
In the second step, thematic map is produced from
satellite images and available maps of the area, by
clustering an image as the baseline (master) image
and labelling the clusters based on the reference
maps. Then based on the post- classification
comparison method, the changes’ nature are labelled.
Post-classification comparison applies a comparison
between the feature vector of each changed pixel and
the centre of the labelled clusters. Based on this
comparison the changed pixels will be labelled
(change map).
Finally in the last step, a reference map is
produced using the high-resolution Geoeye image
which is needed for accuracy assessment.
Figure 3: Mosaic Geoeye image of the study area, 2010.
3.1 Pre-processing
Image pre-processing stage, includes both the
geometric correction and normalization of images
that have been taken at different times from the same
area. Pre-processing consists of the following
operations.
3.1.1 Geometric Correction
In this study, the geo-referencing of the 1998 image
is performed using the 1:250,000 topographic maps.
After geo-referencing of 1998 image, the 2010 image
is registered to 1998 image. Sub-pixel accuracy for
image registration is obtained.
3.1.2 Image Normalization
After a careful image-to-image spatial registration the
images must be radiometrically normalized. Accurate
normalization is essential for the combined CVA and
post classification comparison change detection
approach, since both methods assume that a pixel's
reflectance is stable through time unless a land cover
change occurs (Fraser, Olthof and Pouliot, 2009).
Histogram Matching is a common technique for this
reason which uses the histograms for image
processing and colour adjustment between images.
3.2 Thematic Map Generation
The change detection procedure requires a baseline
land cover classification from which changes are
detected at nominal 12-year intervals. The thematic
map is produced using an unsupervised clustering
approach that combines features of the Enhancement
Classification (ECM) and Classification by
Progressive Generalization (CPG) methods.
Monitoring Protected Areas using Remote Sensing Technology
109

The enhanced imagery is clustered to a number of
spectral clusters. Visual quality checking is an
important part of this and each subsequent
generalization step, and is performed by comparing
the previous generalization with the current one to
ensure that no significant land cover information is
lost. The overall coverage of the Earth's classes such
as soil, water, plant and etc., are determined.
Generalization proceeds by progressively merging
spectrally similar and spatially adjacent clusters to
generate conceptual classes. Final cluster merging
and labeling to a land cover classification is based on
expert image interpretation and available reference
data (Fraser, Olthof, and Pouliot, 2009).
In this research the 1998 Landsat image is divided
into 22 clusters using Iso-data clustering method. The
number of clusters is chosen to be twice as the number
of conceptual classes which are 11 in the case of this
study area. The output for this level is a clustered
image (22 clusters), which is labelled based on
1:250,000 topographic map and converted to 11
conceptual classes.
3.3 Change Detection Process
In this section, the sub-steps of change detection
process will be explained in the following stages.
3.3.1 Tasseled Cap Transformation
Tasseled Cap transformation is a well-known
methods of enhancing spectral information content
for Landsat TM data. Tasseled Cap transformation
especially optimizes data viewing for vegetation
studies. Tasseled Cap index was calculated from data
of the related six TM bands (King and O'Hara, 2001).
Three of the six tasseled cap transform bands are
often used:
Band 1, brightness as a measure of soil
Band 2, greenness as a measure of vegetation
Band 3, wetness as interrelationship of soil and
canopy moisture
This transformation is used to calculate brightness
and greenness of both images (1998 and 2010), which
are the input for CVA analysis.
3.3.2 Applying Change Vector Analysis
A change vector can be described by an angle of
change (vector direction) and a magnitude of change
from date 1 to date 2 (Fraser et al., 2009), (Chen,
Gong, He, and Shi, 2003). We used brightness and
greenness as inputs of CVA to measure and monitor
reforestation and deforestation of the region of study.
The bands are observed in measurement space with
brightness placed along the X-axis and greenness
placed along the Y-axis.
Change direction is achieved by measuring the
angle between corresponding pixels in different times
(1998 - 2010) and the magnitude of change is
achieved using Euclidean distance between vectors.
Magnitude of change vector and its direction are
described by Eq. (1) and Eq. (2) respectively.
(1)
(2)
G1, G2, B1, and B2 are values of greenness and
brightness in two images, which are obtained from
Tasseled cap transformation. To specify the
reforestation and deforestation of the jungles,
greenness and brightness values should be compared
(Kuzera, 2005). Angles measured between 90 and
180 degrees, show reduction in brightness and
increase in greenness, this change is considered as
reforestation. Angles measured between 270 and 360
degrees, show reduction in greenness and increase in
brightness, this change is considered as deforestation
(Kuzera, 2005). Angles measured from 0 to 90 and 90
to 180 degrees, show reduction or increase for both
greenness and brightness, respectively. This is known
as a stable condition, indicating no change in the
vegetation of the area (Kuzera, 2005).
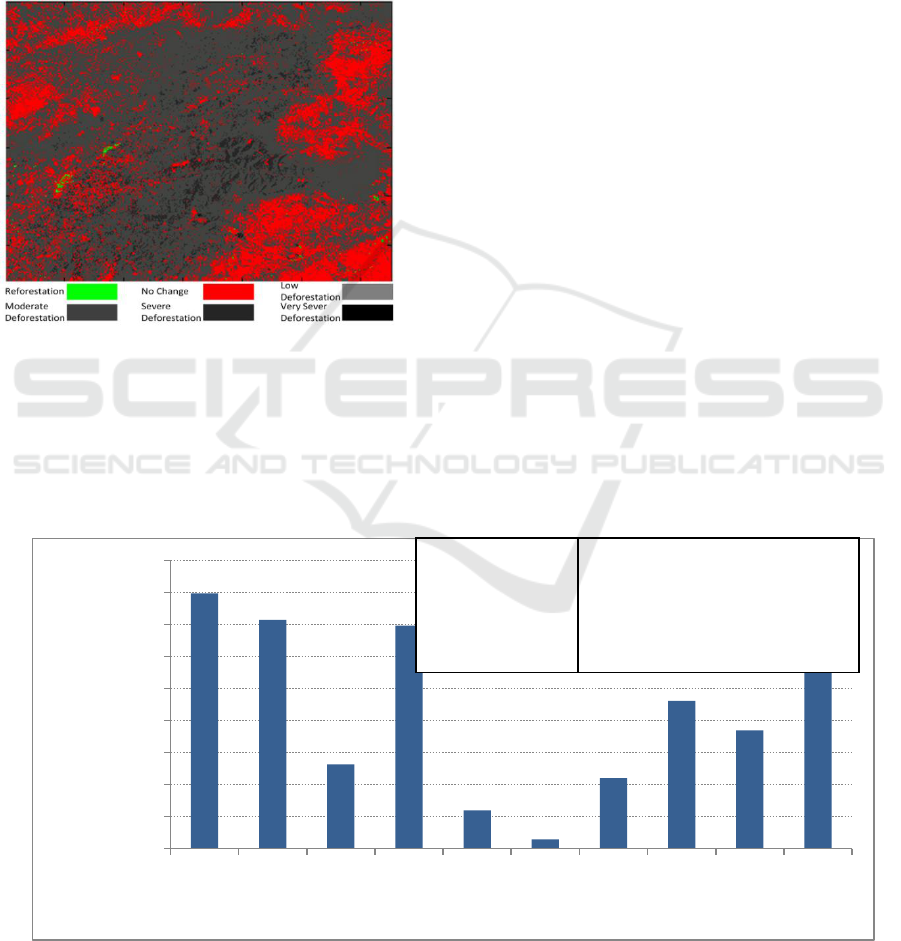
According to the magnitude of change vectors,
damaged pixels are categorized into 4 levels of low,
moderate, severe and very severe deforestation. For
this reason four equal intervals are applied as below:
Interval [1-100]: Low change
Interval [100-200]: Moderate change
Interval [200-300]: Severe change
Interval [300-400]: Very severe
Values less than 1 are considered as noise and values
higher than 400 as outlier. The thresholds defined are
quite tentative. In Figure 4, the various degrees of
grayscale represent different degrees of degradation,
the darker shades show more severe deforestation and
vice versa.
3.3.3 Post Classification Comparison
Change labeling is accomplished by iteratively
updating land cover starting from the baseline
classification for only those pixels identified as
Third International Conference on Telecommunications and Remote Sensing
110
changed in the CVA change mask. Post-classification
comparison method involves comparison of the new
feature vector of each changed pixel with the major
feature vector of the cluster centres (determined in the
first image). New classes of land cover pixels are
determined by assigning a pixel to the most similar
cluster and corresponding existing land cover maps,
so the new cluster of changed pixels are achieved.
Figure 4: Result of applying the CVA method to two
Landsat images of the study area, for 1998 and 2010.
Figure 4: Result of applying the CVA method to two
Landsat images of the study area, for 1998 and 2010
To understand the change trends, the feature vector of
each changed pixels of 2010 image, is compared with
feature vector of classification cluster centres of 1998
image. The changed pixel is assigned to the
cluster with the most similarity with cluster centre.
Since in 1998 image, each cluster has a distinct
relation with an information class, finding the most
similar cluster is the same as labelling changed pixels
in 2010 image with a new information class.
This model is used for cost-effective classification in
large and remote areas and regions where it is difficult
to collect data. The main benefit of this approach is
that by using post-classification comparison method
and a strong knowledge of land cover data the
labelling process will be done automatically.
3.4 Accuracy Evaluation
Since there is no updated reference map available for
the area, in order to evaluate the accuracy of the
obtained change detection results, a reference map is
produced by using both the Landsat (2010) and a
high-resolution Geoeye image. Geoeye image is
taken at the same time as the Landsat image (2010)
and covers the whole Golestan national park. It is
later cropped so it covers the same latitudes and
longitudes that Landsat image covers.
To produce the reference map, Landsat 2010
image is first clustered into 33 clusters. The obtained
clusters are compared to the information classes
recognized from the high-resolution Geoeye image.
In this way the correspondence between clusters and
conceptual classes are determined which leads to the
classification of 2010 Landsat image. This image is
used as the reference map to evaluate the change
detection results. We gained 85% accuracy for the
proposed change detection method.
Figure 5: Changes of classes in terms of pixels
0
50 000
100 000
150 000
200 000
250 000
300 000
350 000
400 000
450 000
1→8 2→8 2→9 2→10 3→4 3→7 6→10 8→10 10→8 10→9
Number of pixels
Changes of classes in terms of pixels
1: Dense grassland
2: Planted forest
3: Dense forest
4: Road
5: Non- dense forest
6: Semi-dense forest
7: Shrubbery
8: Irrigated agriculture and plantations
9: Residential
10: Non-dense grassland
11: Water
Monitoring Protected Areas using Remote Sensing Technology
111

4 ENVIRONMENTAL ANALYSIS
Figure 5 shows the classes which have the most
change rate and magnitude of their change in terms of
pixels. As the statistics show from 1998 to 2010 the
number of pixels which converted from planted
forest, semi-dense forest, dense forest, and dense
grassland classes to road, residential, low density
grassland, irrigated agriculture, plantations,
shrubbery and non-dense forest classes is very high
and this represents a serious degradation in this area.
Road construction in forests regardless of its negative
effects on the forest, inappropriate urban
development, human progression in nature, cutting
trees for fuel, human farming in the forests to provide
food supply, and etc. are some main reasons for
degradation in this area.
A similar research was developed and
demonstrated by Fraser using six national parks in
Canada. It covered a range of geographical and
ecological conditions and was subject to a variety of
change agents including forest harvesting, wildfire,
land use development, and climate/weather (Fraser,
Olthof and Pouliot, 2009). In contrast to Golestan
National Park area that is located on one Landsat
scene and there is no need to mosaic Landsat images,
the area of Fraser’s study was vast and required more
than one Landsat frame to provide complete
coverage. They used 30m resolution Landsat EM and
ETM+, from 1990 to 2005 to generate baseline land
cover classification at five years intervals. Due to
huge height difference, removing haze and
topographic effects for Canada’s national parks was
necessary. However in Golestan National Park,
topographical elevations are fairly smooth and there
was no need to apply topological corrections in pre-
processing. Moreover, radiometric normalization in
Canada national parks was done by using filtering,
while for Golestan National Park it was done by
histogram matching. In both methods, identifying the
changed pixels and labelling them, were determined
using CVA and signature extension. Finally in
Canada baseline land cover and changes were
validated by updated available maps and in Golestan
National Park by high-resolution Geoeye images (due
to the lack of updated maps). Fraser reported 92%
correctly identified changed pixels and 8% omission
error rate in Canada’s parks.
5 CONCLUSION
Timely and accurate change detection of Earth’s
surface features is extremely important for
understanding relationships and interactions between
human and natural phenomena in order to promote
better decision making. Remote sensing data are
primary sources extensively used for change
detection in recent decades and many change
detection techniques have been developed based on
them. The common goal of all these algorithms is to
improve the accuracy of the information extracted
from remote sensing images. In this paper, a change
detection method was proposed to determine changes
in the forests of Northern Iran (Golestan National
Park). Using the combination of spectral and
classification methods lead to an acceptable accuracy.
In comparison with the conducted research on
national parks of Canada, lack of updated reference
maps, has a direct impact on the final accuracy. The
results of the assessment indicated that change
detection method should be developed based on local
knowledge. While this method provides a set of
generic procedures and tools for change detection, its
successful application requires an analyst
experienced in land cover interpretation and image
processing. In particular, the baseline land cover
labeling, assessing results from the image correction
methods, determining a CVA change threshold, and
development of signature extension rules, are
subjective and will determine the final accuracy of the
land cover change products. This algorithm is a cost-
effective change detection method in large areas and
tries to minimize the role of the human operator. It
can be implemented for most forests regardless of
their vegetation. This study is intended to explorer use
of high resolution images in the future in order to
investigate its capabilities to determine the change of
plant species. In future this method also can be
elevated using optimisation methods to find the best
values for CVA thresholds, number of clusters, and
similarity measure and result in an extended
intelligent version of current change detection
method.
REFERENCES
Chen, J., Gong, P., He, C., Shi, R. & P. (2003). Land-
Use/Land-Cover Change Detection Using Improved
Change-Vector Analysis.
Chen, X., Chen, J. (2012). An automated approach for
updating land cover maps based on integrated change
Third International Conference on Telecommunications and Remote Sensing
112

detection and classification methods. ISPRS Journal
of Photogrammetry and Remote Sensing, 71, 86-95.
Fraser, R. H., Li, Z., Cihlar, J. (2000). Hotspot and NDVI
differencing synergy (HANDS): A new technique for
burned area mapping over boreal forest. Remote
Sensing of Environment, 74, 362-376.
Fraser, R. H., Olthof, I., Pouliot, D. (2009). Monitoring land
cover change and ecological integrity in Canada’s
national parks. Remote Sensing of Environment, 113,
1397-1409.
Hermitte, S. L., Verbesselt, J., Verstraeten, W. W., Coppin,
P. (2011). A comparison of time series similarity
measures for classification and change detection of
ecosystem dynamics. Remote Sensing of Environment,
115 (12), 3129-3152.
Johnson, R. D., Kasischke, E. S. (1998). Change vector
analysis: A technique for the multi spectral monitoring
of land cover and condition. International Journal of
Remote Sensing, 19, 411-426.
King, R., O'Hara, C. (2001). Tasseled Cap Transformation.
Computational Geospatial Technologies Center,
Mississippi State University.
Kuzera, K. (2005). Monitoring vegetation regeneration and
deforestation using change vector analysis: Mount St.
Helen's study area.
Luque, S. S. (2000). Evaluating temporal changes using
Multi-Spectral Scanner and Thematic Mapper data on
the landscape of a natural reserve: The New Jersey Pine
Barrens, a case study. International Journal of Remote
Sensing, 21, 2589-2611.
Petit, C., Scudder, T., Lambin, E. (2001). Quantifying
processes of land-cover change by remote sensing:
Resettlement and rapid land-cover changes in south-
eastern Zambia. International Journal of Remote
Sensing, 22, 3435-3456.
Prakash, A., Gupta, R. P. (1998). Land-use mapping and
change detection in a coal mining area—a case study in
the Jharia coalfield, India. International Journal of
Remote Sensing, 19, 391-410.
Silapaswan, C., Verbyla, D., McGuire, A. (2001). Land
cover change on the Seward Peninsula: The use of
remote sensing to evaluate the potential influences of
climate warming on historical vegetation dynamics.
Canadian Journal of Remote Sensing, 27, 542-554.
Xiaolu, S., Bo, C. (2011). Change Detection Using Change
Vector Analysis from Landsat TM Images in Wuhan.
Procedia Environmental Sciences, 11(A), 238-244.
Yuan, F., Sawaya, K. E., Loeffelholz, B. C., Bauer, M. E.
(2005). Land cover classification and change analysis
of the Twin Cities (Minnesota) Metropolitan Area by
multitemporal Landsat remote sensing. Remote
Sensing of Environment, 98, 317-328.
Monitoring Protected Areas using Remote Sensing Technology
113
