
Study on Synchronization of Brain Waves and Injection Technology
Naohisa Kishida, Atsushi Ishigame and Yukie Majima
Osaka Prefecture University, Graduate School of Engineering, 1-1, Naka-ku gakuencho, Sakai-shi, Osaka, Japan
Keywords: Synchronization, α Wave Band Content, Mean Power Frequency.
Abstract: In recent years, the inheritance to the next generation the skills and know-how which the skilled technician
has have become problems. In this paper, we focused the inheritance of technology that nurse injected into
the patient among that problems. Compared to rookie nurses, it is often said that a skilled nurse’s injection
is less degree of pain. It is thought that the reason is that a skilled nurse make a patient relaxed state and
reduces the pain of injection. In order to relax the patient state, the authors believe that nurses make
themselves relaxed and synchronize their states to the patients. In this paper, we stated the relationship
between synchronous and relaxed state in between nurse-patient. In particular, we paid attention to the alpha
waves of brain waves to evaluate the state of relaxation, and discussed synchronization of brain waves.
1 INTRODUCTION
In recent years, the difficulty of inheriting the skills
trained technician has to the next generation become
a problem. We focused on the fact that when rookie
nurses and skilled nurses give an injection to
patients in clinical setting, skilled nurses can give an
injection with less degree of pain (
Jung, 2012
). Then
we have regarded the skill as tacit knowledge and
done a study on how to inherit the skill to rookie
nurses (Murase, 2000). Figure 1 and 2 show that the
conceptual diagrams of failure and success in
injection.
The authors believe that there is an effect that the
state of relaxation during the injection can relieve
pain. Patient’s relaxed state could be brought by the
state that nurses being relaxed themselves. However,
sufficient verification whether a relaxed state can
reduce pain or not has not been made.
Also, we are thinking that not only brain wave
synchronization phenomena but also α wave is
important. For example, if the speaker and the hearer
Figure 1: Conceptual diagram (failure).
talk with face-to-face in conversation, the former
can occur synchronization will be occurred by
attracting of the breathing of each other compared
with non-face-to-face and communication will
become smoothly in many cases (Watanabe, 1998)
(Shimizu, 2007).
When the nurses give an injection to the patients,
it is inferred that, injection is smoothly done without
the pain in that state which the synchronization
phenomenon of brain waves, so-called breath-
matched occurs. In other words, skilled nurses
attract α wave to the patients by giving α wave
themselves and using the synchronization
phenomena. So we consider “α wave and
synchronization phenomena can reduce the pain of
injection”.
Therefore, it is considered that (1) To clarify the
relationship of α waves and synchronization
phenomena and pain, (2) To review of technology
inheritance technique are necessary to inherit the
injection technology.
Figure 2: Conceptual diagram (success).
592
Kishida N., Ishigame A. and Majima Y..
Study on Synchronization of Brain Waves and Injection Technology.
DOI: 10.5220/0005279605920597
In Proceedings of the International Conference on Health Informatics (HEALTHINF-2015), pages 592-597
ISBN: 978-989-758-068-0
Copyright
c
2015 SCITEPRESS (Science and Technology Publications, Lda.)

For the purpose of conducting the verification of
(1), we analysed with experiments on brain wave
synchronization and injection in this paper.
2 SYNCHRONIZATION
PHENOMENA
Human society is made up to take the
communication people who had the personality
involved in complex. In the communication, such as
the rhythm of speech and behavior of each person is
unsynchronized in the same way as personality, but
gesture or nod during a conversation evokes
"synchronization" which attracts each other
unconsciously. Previous psychological studies have
shown that this synchronization can improve the
efficiency of the collaborative work and increase
empathy with others (
Shiga, 2004
). However it is not
clear that the mechanism which causes the
synchronization and the synchronization is specific
between people communication (or bio together). On
the other hand, as well as the synchronization of the
visible behavioral rhythm such as gestures, in order
to realize the cognitive functions such as thinking
and memory, the human brain has also been active
in synchronization with a rhythm of a certain nerve
cell population. These synchronizations are detected
as a brain wave rhythm. In recent years, advances in
measurement technology of brain wave rhythm, the
study of social related to communication is also
progressing. But to analyze the brain activity of one
individual is still the main research issue. What
synchronization of the brain between individuals of
more than one brain is and mostly the relationship
actually remains unknown.
In this paper, we focused on synchronization in
power system. In the power system defining
synchronizations that multiple synchronous
generator kept at a constant value of the frequency
of the alternating electric, and they are running with
maintaining the synchronization. We thought the
idea of synchronization of the power system can be
applied for the synchronization of the multiple
brains of human beings. Therefore, about the
synchronization between individuals of multiple
human brains we regarded a brain wave’s rhythm as
a synchronous generator. And we defined the
synchronization of brain wave rhythm as the
consistency of the value of the frequency values
shown in Chapter 3.
3 VERIFICATION EXPERIMENT
OF THE SYNCHRONIZATION
OF BRAIN WAVES
3.1 Experimental Outline
As described in the previous section, the authors
believe that there are two points involved in the
difference of failure and success in injection. That is,
a synchronization of brain waves and relaxed state.
Also, we believe this synchronization to be
implemented in a relaxed state. To verify the
hypothesis, a pseudo clinical setting and three
subjects who obtained their consent to the
experiment are provided. However, a practice arm
model was used on a desk, instead of the actual arm,
for ethical issues. And the injection was carried out
at the model. At that time, the patients were
indicated to look at the model as their arm. Thus,
classification wasn’t done by pain but the success or
failure of injection. Here success means that the
needle is properly inserted into a blood vessel of the
model. Failure means that a case it is not. And we
measured changes in the brain waves both of nurse
and patient with setting the electrode of
electroencephalogram measurement system on their
occiput in two places and both earlobe when they
perform the procedure of the injection. We show a
conceptual diagram of the experiments in Figure 3.
3.2 Used Equipment and Measuring
Method
The used instruments were as follows.
-Electroencephalogram measurement system
-Syringe
-Practice arm model
We were decided that two of the three persons of
the subject were the nurses, and made a combination
of three sets in the patient part and nurses. Then we
conducted an experiment for this combination to do
injection into the practice arm model. The procedure
was performed for 5 times for each combination.
Figure 3: Conceptual diagram of the experiments.
StudyonSynchronizationofBrainWavesandInjectionTechnology
593

Then it was analyzed by the method described
below for the measured brain waves.
-α wave band content (Kawakami, 2008)
To evaluate the relaxed state of the subject, we
determined the content of the α wave band. The
brain waves are different in each frequency of brain
waves. α wave band (8 ~ 13Hz) content is a
percentage of component of α wave of brain wave.
-MPF(Mean Power Frequency) method (Matsuda,
1997)
We broke down the measured brain waves into
frequency components with performing a Fast
Fourier Transform (FFT) to 25 (Hz) in the 1 (Hz)
distance. At that time, a value obtained by averaging
the spectra of each frequency is called Mean Power
Frequency. In this paper, we represented the state of
the brain and brain wave frequency value which is
determined by this equation.
The equation of MPF was shown in the
following.
MPF
∑
∗
∑
(1)
Here, fl, fh represents the frequency analysis section
and fl is minimum interval, fh is maximum interval,
p represents the power spectrum.
4 EXPERIMENTAL RESULT
2 nurses is as N-1, N-2 , 3 patients is as P-1, P-2, P-3,
we show the measurement results for each
combination (N-1:P-1 、 N-1:P-2 、 N-2:P-3). We
show the results of the injection and combination of
nurses and patients in Table 1.
Table 1: The results and combination.
N-1:P-1 N-1:P-2 N-2:P-3
1st Failure Success Success
2nd Failure Failure Success
3rd Failure Failure Failure
4th Success Success Success
5th Success Success Success
4.1 Case N-1: P-1
In the procedures of five times trial, it succeeded
twice, failed three times in the combination of N-
1:P-1. We show an example of the time change of
MPF below during the procedure of each of the
success and failure at the time. In addition, we show
the average value of α wave content in each of the
case.
4.1.1 Injection Success
Figure 4 shows an example of a time change of the
MPF of the brain waves when the procedures of
injection were successful in combination N-1: P-1.
Red line represents the P-1, blue line represents N-1
in the figure.
4.1.2 Injection Failure
Figure 5 shows an example of a time change of the
MPF of the brain waves when the procedures of
injection were failure in combination N-1: P-1. Red
line represents the P-1; blue line represents N-1 in
the figure.
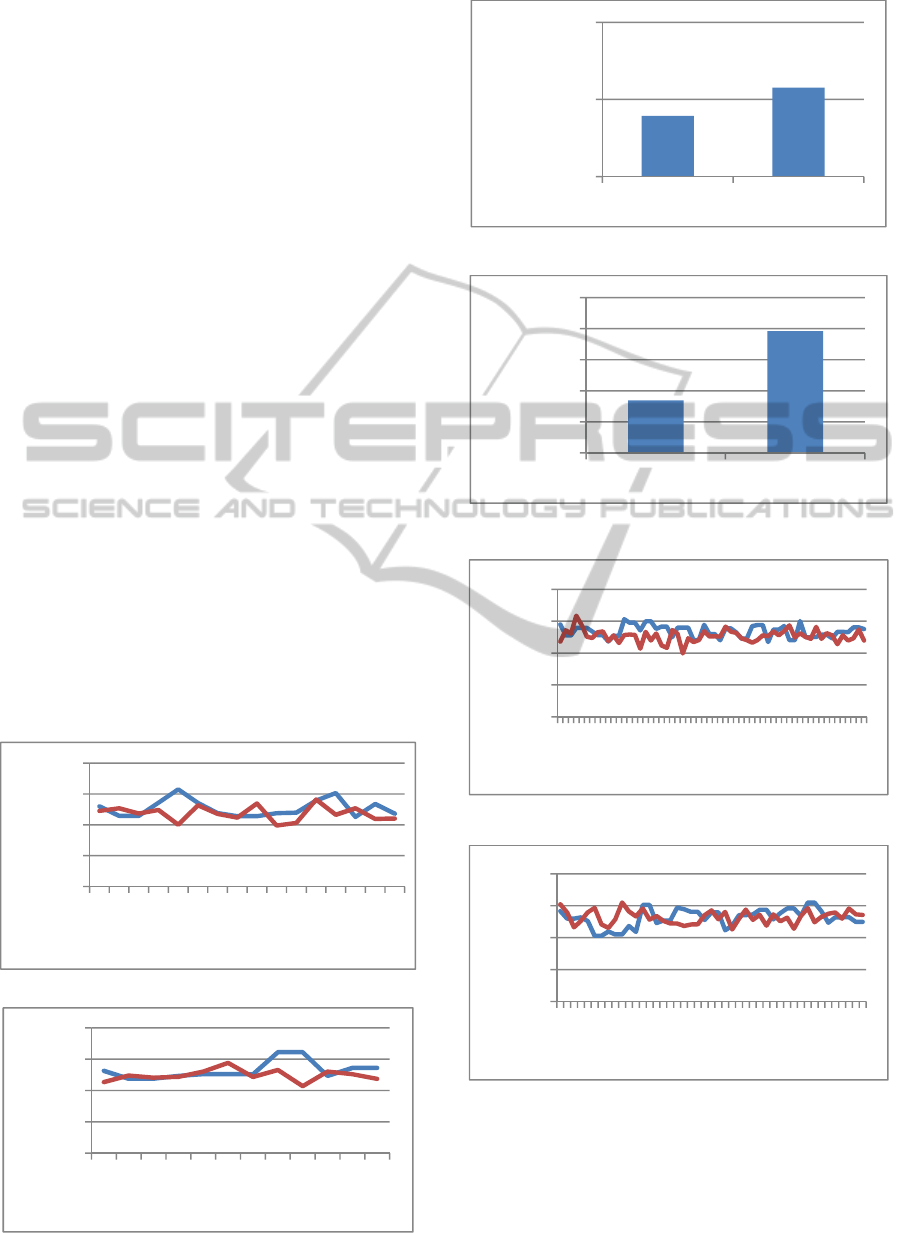
4.1.3 Α Wave Band Content
Figure 6 and 7 show the average value of α wave
band content of N-1 and P-1 during the procedure of
injection in twice succeeded attempts and three
failed attempts.
4.2 Case N-1: P-2
In the procedures of five times, succeeded three
times, failed twice in the combination of N-1:P-2.
We show an example of the time change of MPF
during the procedure of each of the success and
failure at the time below. In addition, we show the
average value of α wave content in each of the case.
4.2.1 Injection Success
Figure 8 shows an example of a time change of the
MPF of the brain waves when the procedures of
injection were successful in combination N-1: P-2.
Red line represents the P-2; blue line represents N-1
in the figure.
4.2.2 Injection Failure
Figure 9 shows an example of a time change of the
MPF of the brain waves when the procedures of
injection were failure in combination N-1: P-2. Red
line represents the P-2, blue line represents N-1 in
the figure.
4.2.3 Α Wave Band Content
Figure 10 and 11 show the average value of α wave
band content of N-1 and P-2 during the procedure of
injection in three times succeeded attempts and
HEALTHINF2015-InternationalConferenceonHealthInformatics
594
twice failed attempts.
4.3 Case N-2: P-3
In the procedures of five times, succeeded four times,
failed once in the combination of N-2: P-3. We show
an example of the time change of MPF during the
procedure of each of the success and failure at the
time below. In addition, we show the average value
of α wave content in the each of the case.
4.3.1 Injection Success
Figure 12 shows an example of a time change of the
MPF of the brain waves when the procedures of
injection were successful in combination N-2: P-3.
Red line represents the P-3, blue line represents N-2
in the figure.
4.3.2 Injection Failure
Figure 13 shows an example of a time change of the
MPF of the brain waves when the procedures of
injection were failure in combination N-2: P-3. Red
line represents the P-3, blue line represents N-2 in
the figure.
4.3.3 Α Wave Band Content
Figure 14 and 15 show the average value of α wave
band content of N-2 and P-3 during the procedure of
injection in four times succeeded attempts and once
failed attempts.
Figure 4: Time transition of MPF (N-1: P-1: success).
Figure 5: Time transition of MPF (N-1: P-1: failure).
Figure 6: Average value of α wave band content (N-1).
Figure 7: Average value of α wave band content (P-1).
Figure 8: Time transition of MPF (N-1: P-2: success).
Figure 9: Time transition of MPF (N-1: P-2: failure).
4.4 Discussion
We showed the time change of MPF of the brain
wave of nurses and patients in the success and
failure of the injection in Figure 4 and 5, 8 and 9, 12
0
5
10
15
20
12345678910111213141516
Frequency(Hz)
Time(s)
0
5
10
15
20
123456789101112
Frequency(Hz)
Time(s)
36,5
37
37,5
Failure Success
α wave band
content(%)
35
36
37
38
39
40
Failure Success
α wave band
content(%)
0
5
10
15
20
1 5 9 131721252933374145495357
Frequency(Hz)
Time(s)
0
5
10
15
20
1 4 7 101316192225283134374043
Frequency(Hz)
Time(s)
StudyonSynchronizationofBrainWavesandInjectionTechnology
595
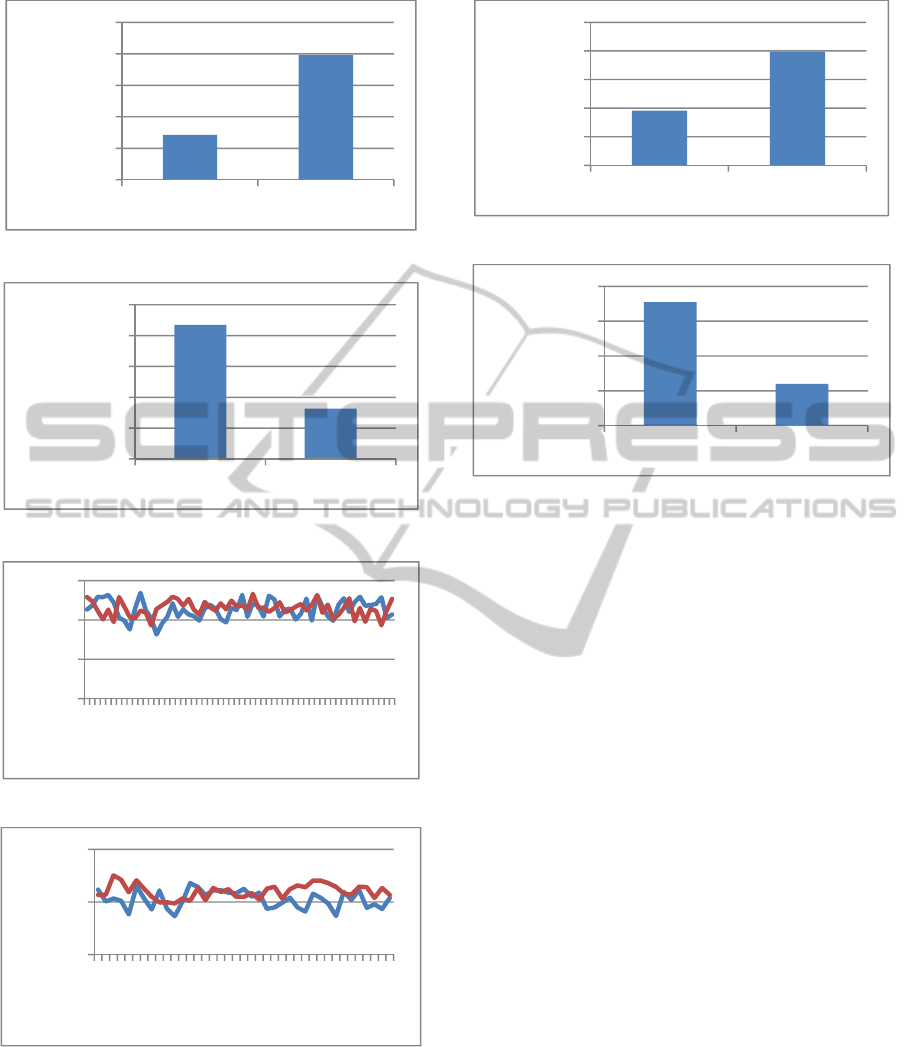
Figure 10: Average value of α wave band content (N-1).
Figure 11: Average value of α wave band content (P-2).
Figure 12: Time transition of MPF (N-2: P-3: success).
Figure 13: Time transition of MPF (N-2: P-3: failure).
and 13. However, a regular trend such as the
consistency of the value (definition of
synchronization in this paper) was not seen at the
time of the success and failure. That is, it is
considered that synchronization phenomenon wasn’t
going in the case where it has been successful since
the value of MPF didn’t change with the value
Figure 14: Average value of α wave band content (N-2).
Figure 15: Average value of α wave band content (P-3).
matching between nurses and patients. Two points
are considered as the reason. The first is that because
the definition of synchronization in human brain
wave is different from the definition of
synchronization in power system. In this experiment,
we have defined synchronization between brain
waves referring to the power system, but we thought
that there is a need to consider the definition of
synchronization to suit the characteristics of the
human brain waves. The second is that the
synchronization between brain waves has not
occurred in the successful injection. In this paper,
we conducted the experiment assumed that the
success or failure is related to the synchronization of
brain waves. However, it is considered that the
synchronization of brain waves is not always related
to the success or failure of injection. As the reason,
it is considered that the procedure was carried out at
the arm model instead of the actual patient’s arm.
Therefore, less influence of the patient’s feelings
didn’t bring synchronization phenomenon. For the
same reason, regular trend of patients wasn’t seen in
this experiment. Next, α wave band content of
subjects are shown in Figure 6 and 7, Figure 10 and
11, Figure 14 and 15. When the procedure is
successful, a trend that α wave band content of
nurses are higher is seen compared to the failure.
From this result, it is considered that nurses can give
injection successful when they are relaxed and the
success or failure of the injection is affected by the
mental state of the nurses.
34
35
36
37
38
39
Failure Success
α wave band
content(%)
35,5
36
36,5
37
37,5
38
Failure Success
α wave band
content(%)
0
5
10
15
1 5 9 131721252933374145495357
Frequency(Hz)
Time(s)
0
10
20
1 4 7 10 13 16 19 22 25 28 31 34 37
Frequency(Hz)
Time(s)
28
30
32
34
36
38
Failure Success
α wave band
content(%)
35
35,5
36
36,5
37
Failure Success
α wave band
content(%)
HEALTHINF2015-InternationalConferenceonHealthInformatics
596

5 CONCLUSIONS
In this paper, we examined the relationship
synchronization of brain waves and injection
technology. Experiments were performed for the
injection to the arm model, and we defined the
synchronization of brain waves by reference to
synchronization of power system. Then we analyzed
for the α wave band content and synchronization of
brain waves. As a result, we found that the nurses
those who had high α wave band content leads to the
success of the injection. So we will establish the
definition of the synchronization of brain waves
considering the characteristics of the brain waves of
humans and explore the trend of brain waves for a
patient upon injection in the future.
REFERENCES
Jung, Eun-Young, 2012. Evaluation of practical exercises
using an intravenous simulator incorporating virtual
reality and haptics device technology. Nurse
Educational Today Vol.32, pp.458-463.
Kawakami., Izumi, 2008. The Effects of the Music
stimulation on the Electroencephalogram. Japan
Society of Mechanical Engineers Kanto branch block
Joint Conference Papers, pp169-170.
Shiga., Kazumasa, 2004. Synchronization in Brain Wave
between Healer and Clients. Parapsychology
Research, Vol.9, No.12, pp.27-34.
Murase., Kiyomi, 2000. A Study of the action of
“Musicalknowledge” upon Music comprehension.
Information Processing Society of Japan Study Report
pp.85-91.
Matsuda., Tetsuya, 1997. In the process of muscle fatigue,
and muscle fiber conduction velocity relationship
between the average power frequency EMG integral
value. Japanese Physical Therapy Association Society
special issue, Vol.24, p.370.
Watanabe, Tomio, 1998. Physiological Analysis of
Entrainment in Communication. Processing Society of
Japan Journal Information, Vol.39, No.5, pp.1225-
1231.
Shimizu, Toshio., 2007. Capturing Entrainment-based
Interpersonal Communication Using Omnidirectional
Camera. The 21st Annual Conference of the Japanese
Society for Artificial Intelligence.
StudyonSynchronizationofBrainWavesandInjectionTechnology
597
