
Image-based Location Recognition and Scenario Modelling
Carlos Orrite, Juan Soler, Mario Rodríguez, Elías Herrero and Roberto Casas
Institute of Engineering Research, Zaragoza University, Zaragoza, Spain
Keywords: Wearable Camera, Structure from Motion, Graphs, Scene Recognition, Video Blog.
Abstract: This work presents a significant improvement of the state regarding intelligent environments developed to
support the independent living of users with special needs. By automatically registering all the pictures
taken by a wearable camera and using them to reconstruct the living scenario, our proposal allows tracking
of a subject in living scenario, recognising the localization of new images, and contextually organize them
along the time, to make feasible the subsequent context - dependent recall. This application can be useful
from an entertainment point of view (in the same way we like to see old pictures) to more serious
applications related to cognitive rehabilitation through recall.
1 INTRODUCTION
This paper shows the preliminary work
accomplished in the project entitled Memory Lane.
Memory lane aims at providing a tool to
automatically and unobtrusively create a
contextualized life-blog for people with special
needs and make it available for later context-
dependent retrieval. Such life-blog will contain
images and sounds as perceived by the person,
chronologically ordered and automatically tagged by
the system providing them with contextual meaning.
Thus, it will be possible to make searches of events
or applying different algorithms to create different
applications such as exercising the memory by
revising emotional bindings with the past, serving as
task tutorial when memory worsens, and working as
alarm detection, evaluating person’s quality of life
or just for entertainment. The main aspects in
Memory Lane are:
(1) By capturing the individual's activities as
images, audio (by a wearable camera and
microphone) and contextually organize them along
the time, place, and action, it will make the
subsequent dependent recall feasible. Memory Lane
can be considered from an entertainment point of
view (as browsing old pictures taken some time ago)
to more serious applications related to cognitive
rehabilitation through recall.
(2) The ability to search for keywords enables
the support at short and medium term memory. This
can be very useful for people in the early stages of
dementia to make them visible the way they faced
certain activities of daily living, such as cooking,
driving appliances, etc.
(3) The analysis of large amount of information
available through various data mining techniques
makes it possible to detect changes in human
behaviour patterns. These changes, for example in
daily habits or increased forgetfulness, can help to
identify early degenerative diseases such as
Alzheimer's or Parkinson's.
1.1 Overview of the Paper
The goal of the work presented in this paper is to
automatically register all the pictures taken by the
user and to use the resulting 3D camera and scene
information to facilitate a couple of application in
image browsing, location and visualization. This
section provides an overview of our approach and
summarizes the rest of the paper.
The primary technical challenge is to robustly
match and reconstruct 3D information from
hundreds or thousands of images that exhibit large
variations in viewpoint, illumination, weather
conditions, resolution, etc., and may contain
significant clutter and outliers.
In order to tackle this problem, we use two recent
breakthroughs in computer vision, namely feature-
matching and Structure from Motion (SfM), as
reviewed in Sect. 2. The backbone of our work is a
robust SfM approach that reconstructs 3D camera
positions and sparse point geometry for large
216
Orrite C., Soler J., Rodriguez M., Herrero E. and Casas R..
Image-based Location Recognition and Scenario Modelling.
DOI: 10.5220/0005352702160221
In Proceedings of the 10th International Conference on Computer Vision Theory and Applications (VISAPP-2015), pages 216-221
ISBN: 978-989-758-089-5
Copyright
c
2015 SCITEPRESS (Science and Technology Publications, Lda.)
datasets. In Sect. 3 we provide a method to graph-
based location recognition. In Sect. 4 we introduce
two applications following the aim of Memory Lane:
indoor navigation, and video transitions to generate
a video blog. In Sect. 5 we expose the main
conclusions of the current work and provide some
insight of the future work.
2 SCENARIO MODELLING
Reconstructing the scenario deals with the problem
of obtaining the relative location, orientation for
each picture, as well as to get sparse 3D scene
geometry (see Fig. 1).
For this purpose we took 533 pictures
corresponding to an author’s home. We proceed to
calibrate the camera in order to obtain the intrinsic
parameters and afterwards we provide the location,
orientation and geometry using computer vision
techniques as described in [Snavely].
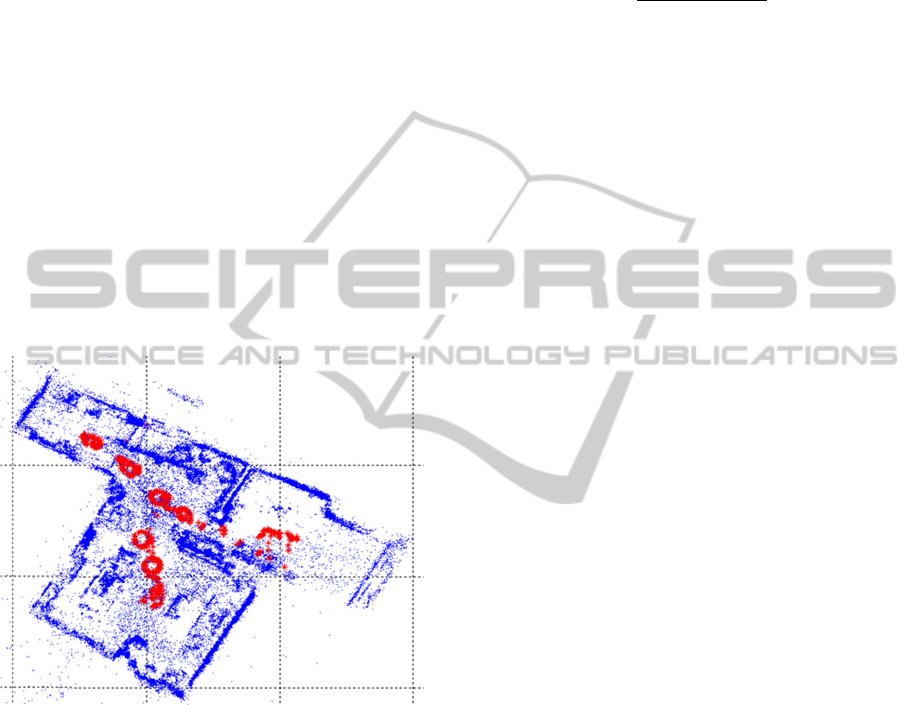
Figure 1: flat sketch (blue) and camera positions (red),
obtained automatically from the pictures.
For the sake of clarity we next describe in the
following subsections each of the steps involved.
2.1 Keypoint Detection and Matching
The first step is to find feature points in each image.
For this purpose we use SIFT [Lowe] feature points.
SIFT is designed to be invariant to scale changes and
linear brightness changes. We use an approximate
searching method to find correspondences between
two images. After matching features for an image
pair (Ii, Ij), we robustly estimate a fundamental
matrix for the pair using RANSAC [Fischler].
During each RANSAC iteration, we compute a
candidate fundamental matrix using the eight-point
algorithm [Hartley], normalizing the problem to
improve robustness to noise.
In order to assess the match’s quality between
two images we use the following expression.
,
2
,
|
|
(1)
where, Ii and Ij are two images, S(I) is the set of
features descriptors calculated from image I and
M(Ii,Ij) is the set of feature matches for images Ii
and Ij. Intuitively, k(Ii,Ij) Є [0,1] is close to 1 when
two images contain common features and, therefore,
they are similar.
2.2 Structure from Motion
The process of reconstructing the scene depicted by
a set of images is usually called Structure from
Motion (SfM). Now, we recover a set of camera
parameters. (e.g., rotation, translation, and focal
length) for each image and a 3D location for each
track. The recovered parameters should be consistent
in such a way the reprojection error is minimized.
This minimization problem can be formulated as a
non-linear least squares problem and solved using
bundle adjustment. For this purpose we use the
VisualFSM package [Changchang]. A sparse
reconstruction of the living scenario is depicted in
Figure1. In this image we have noted the position of
all cameras by red dots.
3 LOCATION RECOGNITION
Taking into account that the system can be reset at
any moment and reboot after some time, recognizing
the location of the new picture after reset by
matching it to the scenario dataset becomes an
important problem. Inspired by other works [Cao],
this paper addresses the location recognition
problem by representing places as graphs encoding
relations between images, and explores how this
representation can aid in recognition.
3.1 Graph Representation
We construct an image graph following a standard
image matching pipeline: we extract features from
each image then; we explore the spatial relationship
between two neighbouring images and create an
edge in our graph. In order to assess whether two
images are similar or not we follow the equation (1).
Image-basedLocationRecognitionandScenarioModelling
217
It takes into account the feature correspondences
after RANSAC-based geometric verification.
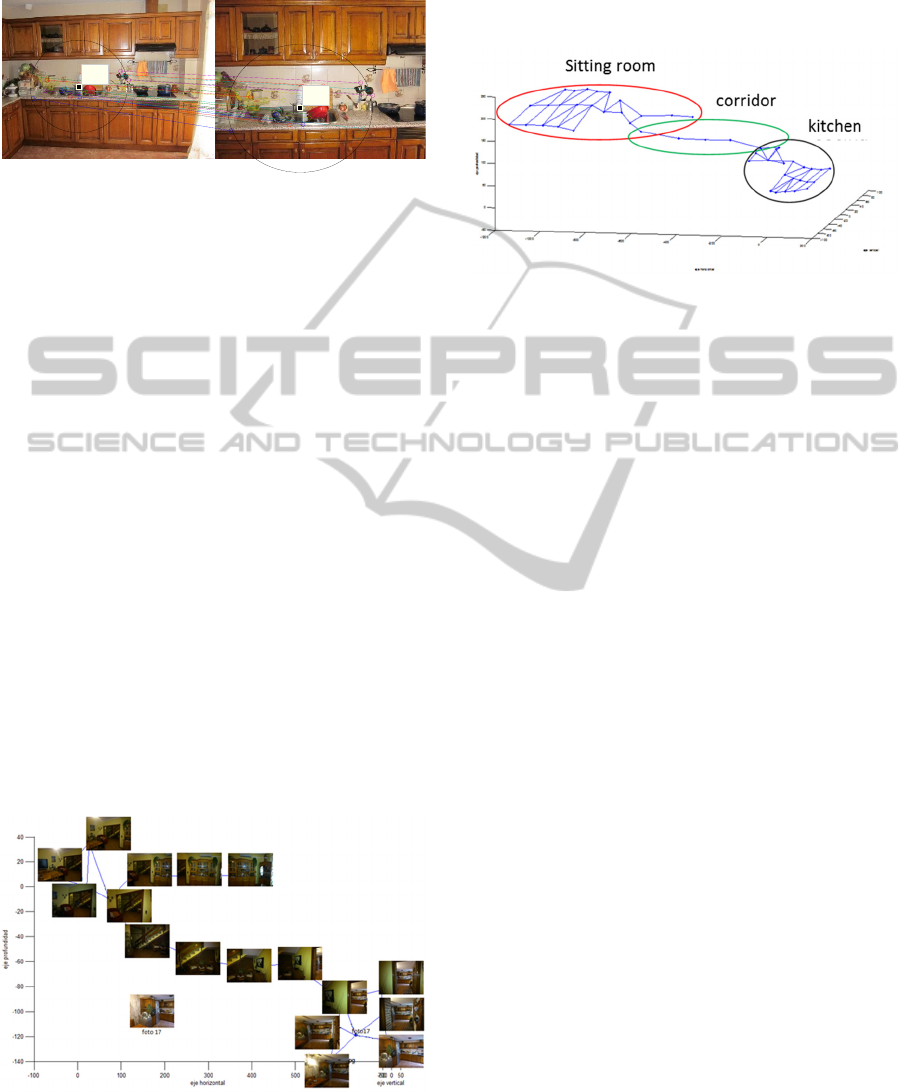
Figure 2: The feature cloud is expanding in the second
picture meaning the subject is getting closer to the
scenario.
Our graph is based on spatial relationships,
similar in the way a subject can move in the
scenario. In order to identify when two images are
neighbour from a deep point of view we follow a
match correspondence among features based on
scale. It can be noticed in Figure 2 that when the
subject gets closer to the scene, the cloud of feature
points in next picture tends to expand, shrinking
when he/she is moving away. Therefore, the adopted
solution is to generate a variable circle cantered at
the average position of the feature cloud in both
pictures, and gradually increasing the radius until it
contains most of the points. If the radius is greater in
the second picture in relation to the previous one, it
means that the feature cloud has expanded, so the
subject is moving closer. Otherwise, if the cloud
shrinks the subject is moving away. In this way, we
have obtained a graph like the one depicted in Figure
3. This graph is useful for indoor navigation as
described in section 4.1. In addition, it allows us
clustering the database into a set of subgraphs,
which will be helpful for recognizing the location of
a new image in a short time.
Figure 3: The same scenario but now represented by some
snapshots.
In this particular case, there are three main scenarios
in our dataset: the sitting room, the corridor and the
kitchen, as depicted in figure 4, but some of them
are in turn composed of several subgraphs.
Figure 4: Transition graph for tree rooms. The three
expected rooms have been manually marked by an ellipse.
We could establish in advance a partitioning of
this scenario into several rooms. But, this solution
would only work for this specific case. Our purpose
is to make the system intelligent enough to find by
itself a plausible partition of the living scenario.
More precisely, we want to find a set of subgraphs
(clsuters) to cover the graph completely, so that we
could find a set of representative exemplar images
that would form a dominating set of the graph. To
be able to cluster the spatial graph into subgraphs we
have followed the spectVAT algorithm [Wang].
SpectVAT is a generalization of the Visual
Assessment of Cluster Tendency (VAT) algorithm
which allows automatically determining the number
of clusters (graphs) in unlabelled data sets. Equation
(1) is used to obtain the similarity matrix for a set of
images, see Figure 5 top-left. The cluster
partitioning provided by the SpectVAT is shown on
the top-right of Figure 5, where every partition
(cluster) is depicted in different colour. As it can be
seen, the algorithm has found four clusters instead of
three. In Figure 5 below the most representative
images for each cluster are shown. First exemplar
image is related to the sitting room. The second
cluster is a hybrid between sitting room, corridor and
kitchen, being the most representative exemplar
image the one showing partially the sitting room and
the corridor. The third and four clusters are both
related to two different viewpoints of the kitchen.
In order to identify the exemplar image in every
cluster we sum up the similarity of an image with
the images belonging to its cluster minus the
similarity with other images belonging to other
clusters. That image with highest score is selected as
the exemplar for that cluster.
X: 145.8
Y: 164.8
X: 562.9
Y: 204.7
VISAPP2015-InternationalConferenceonComputerVisionTheoryandApplications
218
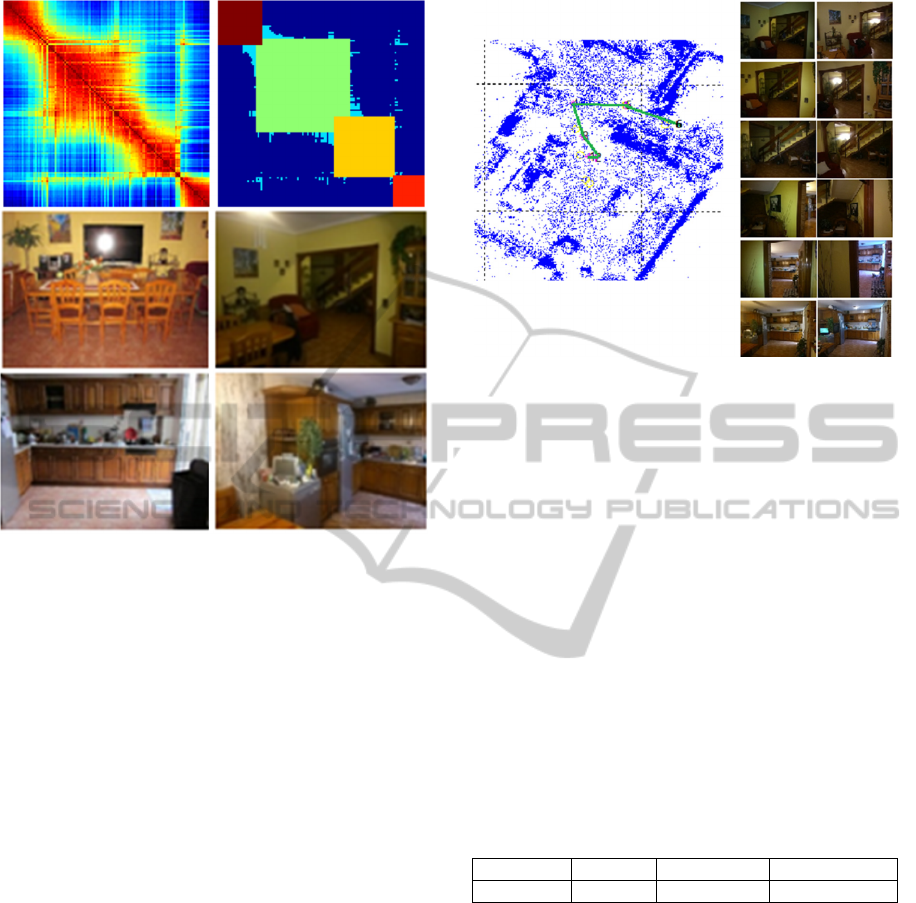
Figure 5: (Top left) Similarity matrix for a set of images
according to equation (1). (Top right) cluster partitioning
provided by SpectVAT algorithm. (Bellow) The four
exemplars for each cluster.
Some of these clusters can be further split into
new subclusters. Finding an exact minimum
dominant set is an NP-complete problem. In this
work we have followed a simple procedure to find
an approximate solution. If all of the images
belonging to a cluster can be matched to its
exemplar image we say the cluster is a dominant set,
otherwise it is split into two: the set of images
matched by the exemplar and the rest where we
obtain a new exemplar for this new subset. Image Ij
matches to image Ii if k(Ii,Ij) is higher than a
threshold (0.1 in this work) meaning there are
enough feature correspondences.
3.2 Location Recognition
One of the goals of this paper is to be able to track a
person by matching new pictures to those of the
scenario dataset. For this purpose we have
developed an experiment consisting in walking
along the living scenario crossing different rooms.
Figure 6 shows an example of human tracking. To
the right from the map we can see the current picture
and besides it, the corresponding best match in the
scenario data set.
Figure 6: Human tracking by matching snapshots. Current
picture (on the left column) and the corresponding best
match in the scenario data set (on the right).
3.3 Validation
A living scenario is a permanent changing
environment where the location of objects change of
place and the illumination conditions are dependent
upon the hour of the day or the month of the year. In
order to assess the performance of our approach we
took some new pictures two months later the time
we obtained the home dataset. We evaluate, on the
one hand, the quality of matching, by manually
supervision of the best picture in the dataset
matching the new one and, on the other hand, the
performance in the localization, considering a failure
if the system establishes the new position out of a 1
meter diameter circle centred at the right position.
Table 1: Location errors for some new pictures.
Nº images Success Match error Location error
82 64 5 13
Table 1 summarizes the location error for 82 new
pictures. A total of 64 of them were correctly
recognized and located. Only 5 of them were not
properly matched to the most similar image from the
dataset. Finally, 13 of them were matched correctly
but the bundle adjustment algorithm located them
with an error higher than 1meter.
Figure 7 shows an example of matching the new
picture exhibiting a substantial change in
illumination. Additionally, figure 8 shows the
matching between a new picture and an old one
belonging to the scenario dataset where different
objects have changed between both.
Image-basedLocationRecognitionandScenarioModelling
219

Figure 7: New location with a substantial change in
illumination.
Figure 8: New location when different objects change in
the scenario.
4 MEMORY LANE
One of the goals of this paper is to provide a couple
of applications in image browsing, location and
visualization.
4.1 Indoor Navigation
We have implemented a GUI in a personal computer
with the goal of allowing an indoor navigation by
the user, see Figure 9.
The top of Figure 9 shows a sparse
representation of the flat as obtained by the SfM
algorithm. The position of the user is depicted in
every moment by a red cross. At the bottom of
Figure 9, the current picture is shown and on the left,
some buttons for user navigation. By means of these
6 buttons the user can browse by his/her home. Left
and right buttons allow the user accessing to images
in which the horizontal angle varies with respect to
the current image. In the same way, the user can
move vertically by means of the up and down
buttons. With the forward and backward buttons the
user can access to images that have changed the
distance between camera and scene in relation to the
current image.
Figure 9: GUI for user navigation (current position is
marked by a red cross).
4.2 Video Transitions
An additional goal of this paper is to be able to
visually see the transition from one snapshot to the
next.
During transitions, we also display in-between
image generating a virtual camera. When the virtual
camera moves from one photograph to another, the
system linearly interpolates the camera position
between the initial and final camera locations, and
the camera orientation between unit quaternions
representing the initial and final orientations. There
are other works dealing with this problem based on
triangle morphs [Chew] or using planar impostors
[Snavely].
To create a morph between cameras Cj and Ck
using a planar impostor, we simply project the two
images Ij and Ik onto CommonPlane(C
j
,C
k
) and
cross-fade between the projected images as the
VISAPP2015-InternationalConferenceonComputerVisionTheoryandApplications
220

camera moves from C
j
to C
k
. The resulting in-
betweens are not as faithful to the underlying
geometry as the triangulated morphs, tending to
stabilize only a dominant plane in the scene, but the
resulting artefacts are usually less objectionable,
perhaps because we are used to seeing distortions
caused by viewing planes from different angles.
Figure 10: Virtual transition between two frames.
Figure 10 shows an example of transitions
between two consecutive pictures. To generate the
sensation of continuity, like in a video footage, we
stablish a frame rate of 5 virtual frames per second.
5 CONCLUSIONS
This is a preliminary paper portraying the current
work in progress. We are aware there is a lot of
work to do but we want to show the idea and some
preliminary results in order to discuss the most
relevant aspects to cover in the future.
The living scenario is continuously changing and
we have to provide a way to automatically update
the image dataset in order to recognize the changes
in the position of the objects along time.
In addition, the tracking method showed relies on
recognition without any kind of prediction about the
subject movement. There are many algorithms in
computer vision, such as Extended Kalman Filters,
Particle filters, etc., which would be helpful in order
to track the subject in a complex scenario.
Memory Lane deals with object recognition as
well. The system has to be smart enough to
recognize different objects in the scenario.
Finally, all tests were carried out in a real
scenario, but more experimentation in other
apartments involving daily activities becomes
necessary.
ACKNOWLEDGEMENTS
This work is partially supported by Spanish Grant
TIN2013-45312-R (MINECO) and FEDER.
REFERENCES
Snavely, N., Seitz, S. M., Szeliski, R., 2008. Modeling the
World from Internet Photo Collections. In Int. J.
Comput. Vision.
Lowe, D., 2004. Distinctive Image Features from Scale-
Invariant Keypoints. In Int. J. Comput. Vision, 60 (29),
pp. 91-110.
Fischler, Martin A., Bolles, Robert C., 1981. Random
Sample Consensus: A Paradigm for Model Fitting
with Applications to Image Analysis and Automated
Cartography. In Communications of the ACM, pp.
381-395.
Hartley, R. I., Zisserman, A., 2004. Multiple View
Geometry in Computer Vision. The Cambridge
University Press.
Changchang W., VisualFSM. http://ccwu.me/vsfm/
Cao, S., Snavely, N., 2013. Graph-Based Discriminative
Learning for Location Recognition. In 'CVPR' , IEEE,
pp. 700-707.
Wang, L., Geng, X., Bezdek, J., Leckie, C.,
Ramamohanarao, K., 2010. Enhanced Visual Analysis
for Cluster Tendency Assessment and Data
Partitioning. In IEEE Transactions on Knowledge &
Data Engineering, vol.22, no. 10, pp. 1401-1414.
Chew, L. P., 1987. Constrained Delaunay Triangulations.
In Proceedings of the Third Annual Symposium on
Computational Geometry, pp. 215-222.
Image-basedLocationRecognitionandScenarioModelling
221
