
A Semiotic-informed Approach to Interface Guidelines for Mobile
Applications
A Case Study on Phenology Data Acquisition
Flavio Nicastro
1
, Roberto Pereira
2
, Bruna Alberton
3
, Leonor Patr
´
ıcia C. Morellato
3
,
Cecilia Baranauskas
2
and Ricardo da S. Torres
1
1
RECOD Lab, Institute of Computing, University of Campinas (UNICAMP), Campinas, SP, Brazil
2
Institute of Computing, University of Campinas (UNICAMP), Campinas, SP, Brazil
3
Phenology Lab, Dept. of Botany, S
˜
ao Paulo State University UNESP, Rio Claro, SP, Brazil
Keywords:
Human Computer Interaction, Organizational Semiotics, Mobile Application Interface Guidelines, Phenology.
Abstract:
Portable devices have been experimented for data acquisition in different domains, e.g., logistics and census
data acquisition. Nevertheless, their large-scale adoption depends on the development of effective applications
with a careful interaction design. In this paper, we revisit existing interface design strategies and propose a
guideline composed of semiotic-informed rules and questions for mobile user interface design. We demon-
strate the use of the guideline in the evaluation of mobile application interfaces proposed for phenological data
acquisition in the field.
1 INTRODUCTION
Portable devices have been adopted in different do-
mains to support data acquisition (Abdallah, 2012;
Hao et al., 2011; Podnar Zarko et al., 2013). Key mo-
tivations for their use rely on the associated low costs,
recent improvements in the hardware robustness, the
incorporation of different sensors (e.g., for location,
audio, image, and video acquisition) that provide use-
ful contextual information for different purposes, and
the availability of easy-to-use frameworks for devel-
oping applications.
However, the effective adoption of portable de-
vices depends on the use of applications with care-
ful interface design. An appropriate design should be
associated with reduced mental and physical stress,
reduced learning curve, and improved device oper-
ability (Duh et al., 2006). The design and implemen-
tation of such interfaces deal with many constraints:
small-size screens, data entry models, connectivity
issues, and limited resources. Moreover, there are
other factors underlying the user-system interaction
that should also be considered, such as the social im-
plications of changing work practices. In this sense,
the definition and use of appropriate interface design
guidelines may help application developers to address
part of these challenges.
Information and Communication Technology has
evolved rapidly, shaping our relationships in the
world (e.g., economic, social, laboral, interpersonal,
and ethical). The relationship between people and
information is changing at the same pace, mediated
by that technology. Within this scenario, and as
part of it, designing or evaluating an application de-
mands a systemic view on the prospective product of
that technology. For this systemic view on the de-
sign of computer-based applications, Organizational
Semiotics (OS) (Liu, 2000) has been a fundamental
theoretical frame of reference for our work.
By making use of several design cues, indicators,
and signs, Semiotics, the doctrine of signs, enables us
to search for a more accurate understanding of infor-
mation as properties of signs. Anything that stands for
another or is used to mean something to someone is
an example of sign: words, sentences, traffic lights,
diagrams, a wave, a facial expression. Adopting
Baranauskas’ perspective to design (Baranauskas,
2013; Baranauskas, 2014), we take Semiotics beyond
the study of how we use signs to communicate, to in-
clude shared knowledge and mutual commitment that
establishes communication in the design process. In
this sense, information, understood as signs, could be
34
Nicastro F., Pereira R., Alberton B., Patrícia C. Morellato L., Baranauskas C. and da S. Torres R..
A Semiotic-informed Approach to Interface Guidelines for Mobile Applications - A Case Study on Phenology Data Acquisition.
DOI: 10.5220/0005379600340043
In Proceedings of the 17th International Conference on Enterprise Information Systems (ICEIS-2015), pages 34-43
ISBN: 978-989-758-098-7
Copyright
c
2015 SCITEPRESS (Science and Technology Publications, Lda.)

operated in distinct levels, meaning different opera-
tions a person can do upon the sign. These levels
are represented as steps of a Semiotic Ladder (SL),
or views of a semiotic framework (Stamper, 1973).
In this paper, we revisit existing interface design
strategies and use the Semiotic Ladder from OS as
an artifact to organize guidelines for the evaluation
of mobile user interfaces. To the best of our knowl-
edge, this is the first attempt to categorize existing
guidelines according to the OS principles. The final
guideline proposed, composed of 27 rules, is expected
to support mobile interface designers and developers
in their daily evaluation tasks. In order to illustrate
that, we demonstrate the use of the final guideline in
the evaluation of interfaces for mobile applications re-
cently proposed in the e-Science domain. In these ap-
plications, we are interested in supporting data acqui-
sition upon plant phenology in the field.
Plant phenology concerns the study of recur-
rent life cycles events and its relationship to cli-
mate (Schwartz, 2013). This discipline has been rec-
ognized as an strategic approach to climate change
research (Schwartz, 2013). Plant phenology stud-
ies are based on a well-defined methodology that has
as main objective the identification and understand-
ing of temporal changes in reproductive or vegetative
events (Morellato et al., 2010). Plant phenology stud-
ies depends, therefore, on the continuous acquisition
and analysis of data over time. Usually, plants are ob-
served directly in the field, and the phenophases de-
fined by the investigators (e.g., flower, fruiting, leaf
flush) are visually identified and registered on paper
sheets on the field. This task is time consuming and
error prone. These issues have motivated the investi-
gation upon the use of portable devices to support the
phenological data acquisition process.
The remaining of this text is organized as fol-
lows. Section 2 provides the background on related
topics. Section 3 introduces the proposed semiotic-
informed guidelines for evaluating mobile application
interfaces, while Section 4 describes a case study con-
cerning the use of the proposed guidelines in the eval-
uation of application interfaces proposed for pheno-
logical data acquisition. Finally, Section 5 presents
our conclusions and directions for future work.
2 BACKGROUND
The definition of an appropriate guideline for mobile
interface design was based on the identification of ex-
isting research in the area. Table 1 illustrates some
relevant work in the literature, without exhausting the
subject. The literature studies point to different as-
pects that are relevant in evaluating mobile applica-
tion user interfaces. In this work, we select and re-
fine guidelines, rules, and questions proposed in those
studies, classifying them according to the different
semiotic layers.
The Semiotic Ladder (SL) consists of six steps
representing views on signs from the perspective of
the physical world, empirics, syntactics, semantics,
pragmatics, and the social world. The physical, em-
pirics, and the social world are Stamper’s (Stamper,
1973) contribution upon the traditional semiotic ap-
proach.
The Social World is the layer in which we ana-
lyze the consequences of the use of signs in human
activities. It deals for example with beliefs, expecta-
tions, commitments, law, and culture. Pragmatics is
the layer studying the intentional use of signs and be-
havior of agents. Issues related to the intention and
negotiation are objects of the pragmatic. Semantics
deals with the relationship between a sign and what it
refers to (its meaning); signs in all modes of signifi-
cation. Syntactics deals with the combination of signs
without considering their specific meaning. Empirics
deals with the static properties of signs, when media
and different physical devices are used. Finally, Phys-
ical World works with the physical aspects of signs
and their marks (e.g., infrastructure issues).
In summary, the top three steps of the SL are re-
lated to the use of signs, how they work in communi-
cating meanings and intentions, and the social conse-
quences of their use. The three lower steps, in turn,
answer questions related to how signs are structured
and used, how they are organized and conveyed, and
what physical properties they have, among others.
In the context of our study, the SL is an artifact
that has been adapted for organizing the guidelines for
system evaluation, covering aspects from its techno-
logical infrastructure (physical world, empirics, syn-
tactic layer) to the system of human information (se-
mantic layer, pragmatics, and social world). There-
fore, this artifact supports both a wide and deep view
of the different aspects that may be considered when
evaluating interfaces for mobile devices. Other uses
of the SL in different domains can be found in the
literature, such as (Piccolo and Baranauskas, 2013).
3 PROPOSED GUIDELINE
From the analysis of literature concerning the evalua-
tion of portable device applications based on publica-
tions associated with ACM and IEEE conferences and
journals (see Table 1), we classified existing guide-
lines, rules, and questions according to the Semiotic
ASemiotic-informedApproachtoInterfaceGuidelinesforMobileApplications-ACaseStudyonPhenologyData
Acquisition
35

Table 1: Literature overview on mobile interface design.
References Overview
(Nayebi et al., 2012) - can be considered the state-of-the-
art work concerning the evaluation
of the usability of mobile applica-
tions;
- presents a methodology for usabil-
ity evaluation;
- suggests that there is little scien-
tific research in this area.
(Radio et al., 2012) - presents guidelines based on
the latest research in industry and
academia;
- addresses search design and devel-
opment of successful mobile appli-
cations that can utilize the capabili-
ties of next generation cellular net-
work;
- presents a model for developing
client-server applications based on
4G technologies.
(Zamzami and Mah-
mud, 2012)
- states that there is little research
focused on assessing the informa-
tion quality on smartphone inter-
faces;
- examines three main areas: mo-
bile interface design, information
quality, and user satisfaction.
(Rauch, 2011) - discusses differences in usability
research focused on desktops com-
pared with what has been done for
mobile devices;
- summarizes emerging trends in
usability studies for mobile devices;
- suggests best practices for devel-
oping user assistance for mobile de-
vices.
(Ayob et al., 2009) - proposes a three-layer design
model for mobile applications
based on four existing guidelines.
(Hussain and Kutar,
2009)
- presents a usability metric frame-
work for mobile phone applica-
tions;
- proposes 10 factors that are subdi-
vided into 26 criteria and 127 met-
rics;
- is integrated to the ISO 9241.
(Ryu, 2005) - presents usability questionnaires
for electronic mobile products and
decision making methods;
- proposes an evaluation question-
naire containing 72 items.
(Gong and
Tarasewich, 2004)
- presents guidelines for handheld
mobile device interface design;
- is based on golden rules of inter-
face design.
Ladder.
1
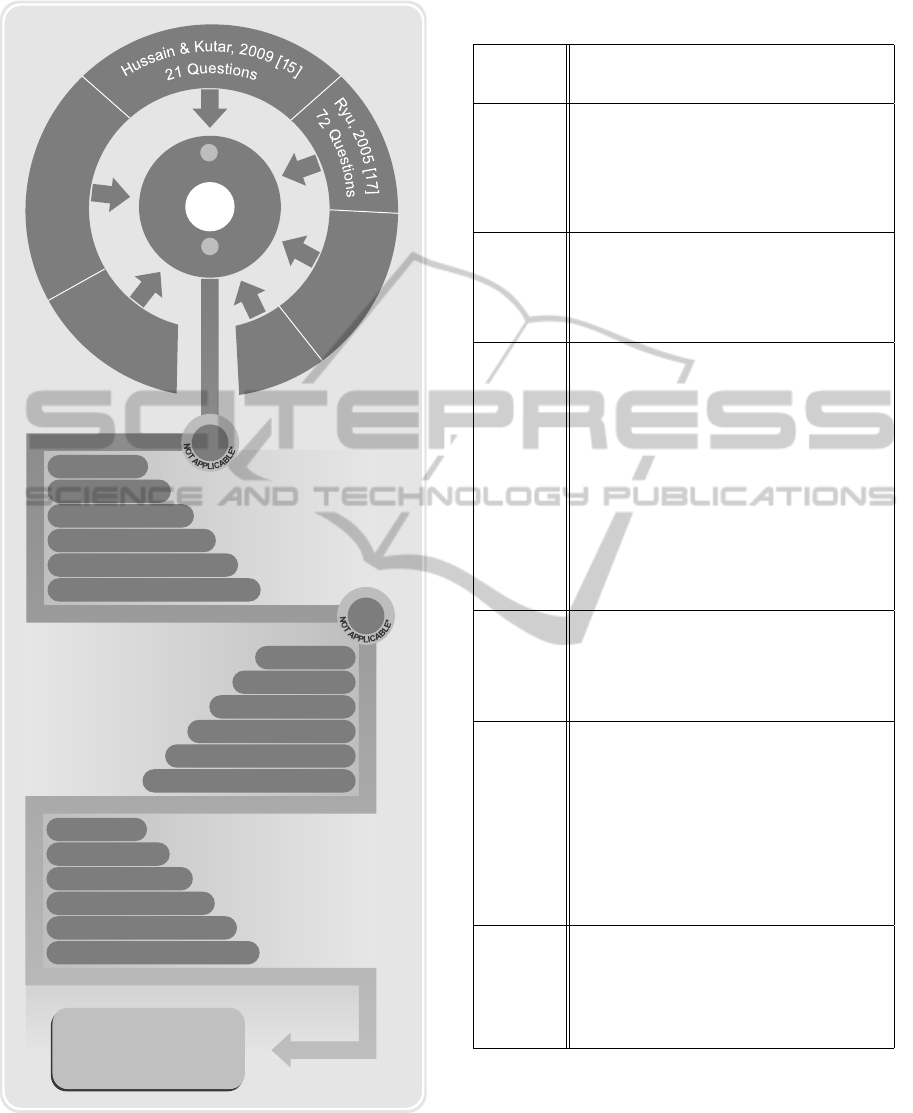
This step generated a total of 147 guidelines,
1
From now on, we will refer to this set as literature
guidelines, or simply guidelines.
distributed as follows: 15 into Physical World; 10 into
Empirics; 58 into Syntactics; 26 into Semantics; 20
into Pragmatics, and 18 into Social World.
A novel set of guidelines was defined by merging
similar ones and by discarding those considered non-
pertinent to the application domain (13 in total). Ex-
amples of removed guidelines include questions such
as “Is it easy to change the ringer signal?”, “Is it easy
to check missed calls?”, “Is it easy to check the last
call?”, “Is it easy to send and receive short messages
using this product?”, “Is it easy to use the phone book
feature of this product?”, “Can you personalize ringer
signals with this product?”.
Although those are general questions important to
evaluate interaction and communication with the mo-
bile device, they are not relevant for a mobile appli-
cation interface evaluation in the domain considered.
The resulting set included 7 guidelines into the Physi-
cal World, 9 into Empirics; 16 into Syntactics, 10 into
Semantics, 28 into Pragmatics, and 9 into the Social
World, totalizing 79 guidelines.
These guidelines and their classification were
reevaluated and refined by 10 experts in the fields of
OS and HCI, to eliminate redundancies and to come
with more appropriate descriptions and a more cohe-
sive set, resulting in a guideline composed of 27 rules
distributed as follows: 4 into the Physical World, 4
into Empirics, 7 into Syntactics, 4 into Semantics, 5
in Pragmatics, and 3 into the Social World. Figure 1
illustrates the whole process for refining and organiz-
ing the guidelines. The final set of rules considered in
the proposed is presented in Table 2.
Finally, a questionnaire was proposed to support
the evaluation of mobile applications according to
each defined rule. The proposed questionnaire is pre-
sented in Tables 3, 4, 5, 6, 7, and 8. Each table refers
to a different SL step. Note also that, more than one
question can be used for a particular rule in some
cases. For example, for the fourth rule related to the
Physical World (“Create design suitable for small de-
vices with touch screen”) – see Table 2, two ques-
tions are defined for the evaluation process:“Are pic-
tures on the screen of satisfactory quality and size?”;
“Does the application provide appropriate menu but-
ton for touch screen?”.
For each question, the evaluator should indicate,
in a Likert scale (from 1 to 5), whether the applica-
tion is attending to the guidelines recommendations.
In the scale: 1 means that the evaluator strongly dis-
agrees; 2, disagrees; 3, neither agrees nor disagrees;
4, agrees; 5, strongly agrees.
ICEIS2015-17thInternationalConferenceonEnterpriseInformationSystems
36
09
SOCIAL W.
28
PRAGMATIC
SEMANTIC
10
SYNTACTIC
16
EMPIRIC
09
147
e
w
i
c
s
h
a
r
,
a
2
T
0
0
&
4
g
[
n
1
o
6
]
G
g
u
5
i
d
1
e
f
l
o
i
n
t
e
e
s
S
l
,
2
a
0
t
0
e
9
b
[
1
o
y
3
]
A
l
i
n
e
s
e
d
w
i
i
u
t
h
G
l
e
m
e
e
n
t
0
s
2
a
l
.
,
2
t
0
e
1
3
a
i
[
d
1
a
4
]
R
g
u
9
i
d
1
e
f
l
o
i
e
t
n
e
s
S
54
Rules
93
Questions
PHYSICAL W.
07
03
SOCIAL W.
05
PRAGMATIC
SEMANTIC
04
SYNTACTIC
07
EMPIRIC
04
PHYSICAL W.
04
79
QUESTIONS
AND RULES
27
RULES
04
SOCIAL W.
08
PRAGMATIC
SEMANTIC
06
SYNTACTIC
12
EMPIRIC
04
PHYSICAL W.
06
40
QUESTIONS
Guidelines composed of
27 RULES
and
40 QUESTIONS
13
08
...
Figure 1: The guideline refinement process. The resulting
set, composed of 27 rules, is presented in Table 2, while the
40 questions proposed to evaluate mobile interfaces accord-
ing to the defined rules are presented in Tables 3–8.
Table 2: Proposed Guideline. This Guideline is composed
of 27 rules.
Step on the
Semiotic
Ladder
Rule Description
Physical
World
1 - Provide adequate contrast
2 - Provide methods for easy and functional data
entry
3 - Create design suitable for small devices with
touch screen
4 - Easy operation with one hand
Empiric
5 - Implement planning on speedup
6 - Keep recent data for reuse
7 - Facilitate data exchange with other applica-
tions
8 - Provide automatic application update
Syntactic
9 - Adequately provide information on system re-
sources
10 - Give control to the user of the application
11 - Maintain consistency in the standards used
both in data presentation as in how to perform
each task
12 - Facilitate the navigation between screens and
information
13 - Keep the user informed of what is happening
through constant feedbacks
14 - Provide shortcuts and wizards
15 - Reduce mental efforts and memory require-
ments
Semantic
16 - Facilitate the discovery of new functionality
17 - Provide output of data easy to use
18 - Provide appropriate documentation by means
of manuals and helps
19 - Design clear and understandable interfaces
Pragmatic
20 - Design the application thinking about sim-
plicity
21 - Develop the application thinking in multiple
contexts
22 - Provide feedback to aid the prevention of er-
rors and troubleshooting as well as provide means
for reversing actions
23 - Allow customization of the application by
users
24 - Facilitate application learning
Social World
25 - Implement security and privacy controls
26 - Know your target audience in order to raise
the application requirements, needs and “intrin-
sic” desires
27 - Implement controls to avoid risks while using
the application in motion (driving, walking, etc.)
4 CASE STUDY
This section presents conducted case study that aims
to demonstrate the use of the proposed guideline. This
case study concerns the evaluation of the interfaces of
three prototypes designed to support the phenologi-
ASemiotic-informedApproachtoInterfaceGuidelinesforMobileApplications-ACaseStudyonPhenologyData
Acquisition
37
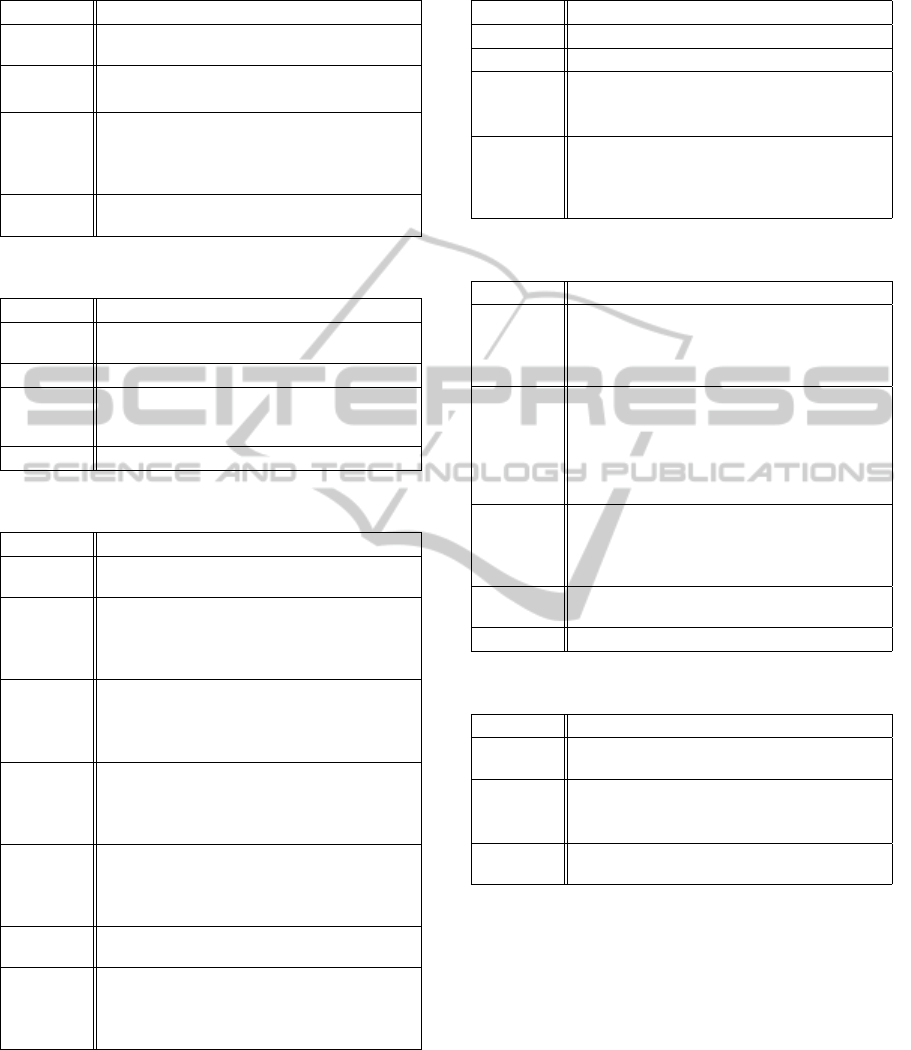
Table 3: Questionnarie Proposed - Physical World.
Rule Question
1
Is the backlighting feature for the keyboard and
screen appropriate in all contexts?
2
Does the application provide a virtual keypad?
Does the application provide voice assistance?
3
Are pictures on the screen of satisfactory quality
and size?
Does the application provide appropriate menu
button for touch screen?
4 Is it sufficiently easy to operate keys with one
hand?
Table 4: Questionnarie Proposed - Empiric.
Rule Question
5 Are the response time and information display fast
enough?
6 Are data items kept short?
7 Are exchange and transmission of data between
this product and other products (e.g., computer,
PDA, and other mobile products) easy?
8 Does the application provide automatic update?
Table 5: Questionnarie Proposed - Syntactic.
Rule Question
9 How much information about system resources
was displayed?
10
Are the HOME and MENU buttons sufficiently
easy to locate for all operations?
Are the letter codes for the menu selection de-
signed carefully?
11
Are the color coding and data display compatible
with familiar conventions?
Can all operations be carried out in a systemati-
cally similar way?
12
Is the organization of information on the product
screen clear?
Is it easy to navigate between hierarchical menus,
pages, and screen?
13
Is feedback on the completion of tasks clear?
Does application provide feedback (haptic, audio,
visual, etc.) constantly in order to keep the user
engaged and attentive?
14 Does application provide shortcuts for experi-
enced users and wizards for new users?
15
Does interacting with this product require a lot of
mental effort?
Is it easy for you to remember how to perform
tasks with this product?
cal data acquisition process in the field. We first de-
scribe the data acquisition process scenario in Sec-
tion 4.1. Next, we describe the evaluated prototypes
in Section 4.2. Finally, in Section 4.3, we present and
discuss the results obtained from the evaluation using
the guidelines.
Table 6: Questionnarie Proposed - Semantic.
Rule Question
16 Is discovering new features sufficiently easy?
17 Is the output data easy to use?
18
Are the documentation and manual for this prod-
uct sufficiently informative?
Does the application provide appropriate help?
19
Is the interface with this product clear and under-
atandable?
Is the design of the graphic symbols, icons and
labels on the icons sufficiently relevant?
Table 7: Questionnarie Proposed - Pragmatic.
Rule Question
20
Does this product enable the quick, effective, and
economical performance of tasks?
Is it easy to access the information that you need
from the product?
21
Does application allow convenient use with the
ability to handle multiple and frequent interrup-
tions with limited attention from the user?
Does design of application is suitable for multiple
contexts (home, business, travel, etc.) including
support for runtime adaptation?
22
Are the error messages effective in assisting you
to fix problems?
Are the messages aimed at prevent you from mak-
ing mistakes adequate?
23 Does application provide the ability to personalize
the application to suit the user?
24 Is it easy to learn to operate this product?
Table 8: Questionnarie Proposed - Social World.
Rule Question
25 Does application allow privacy and security con-
trol for single or multiple users?
26
Does product have all the functions and capabili-
ties you expect it to have?
Is this product attractive and pleasing?
27 Is the application secure to use while driving or
walking?
4.1 Phenology Data Acquisition in the
Field
Recently, phenology has been recognized as an im-
portant discipline for understanding the impact of cli-
mate change on living beings (Menzel et al., 2006).
Phenology studies depend on the analysis of long-
term temporal data (Newstrom et al., 1994). The com-
mon approach is the direct observation of plant indi-
viduals in the field at regular intervals (e.g., monthly
or weekly) and the identification of phenophases
(e.g., leafing, budding, flowering, ripening) (Morel-
lato et al., 2000; Morellato et al., 2010). One widely
ICEIS2015-17thInternationalConferenceonEnterpriseInformationSystems
38

Store data
Research in the field
Conduct observations of phenophases (intensity: 0, 1 or 2)
Annotate observations on the printed worksheet
Return to Laboratory Phenolog y ( UNESP)
Evaluate inserted data and check for inconsistencies
regarding previous annotations
Correct inconsistencies
Store data
Planning and analysis
Copy data to electronic spreadsheets
Figure 2: Typical data acquisition workflow.
adopted approach for data acquisition relies on using
a qualitative method to assess the presence or absence
of phenophase or using a quantitative method that as-
signs a different number (usually 0, 1, or 2) for a
phenophase, depending on its intensity (d’Ea Neves
and Morellato, 2004). Usually, phenophase intensi-
ties are registered on paper sheets (in the field) and
later inserted into digital spreadsheets (in the labora-
tory). This acquisition procedure can lead to errors
and discrepancies in the collected data, which can de-
lay data processing and analysis, as well as knowl-
edge discovery.
Figure 2 presents the typical phenological data ac-
quisition workflow. First, on-the-ground observations
are planned. Multiple phenology experts may be in-
volved in this process. Next, the in-the-field observa-
tions are performed by assigning intensity scores to
plant phenophases. These scores are then registered
in paper worksheets. In the lab, these data are stored
in digital spreadsheets. At this moment, inserted data
are checked with the objective of determining any in-
consistency with previous annotations. If any incon-
sistency is identified, spreadsheets need to be updated
accordingly.
In this context, we have been specifying and de-
veloping new applications to support data acquisition
in the field, based on the ongoing phenological ob-
servations carried out by the group from Phenology
Lab at UNESP.
2
The objective is to design and imple-
2
Details from field site and sample methods can be
ment applications for portable devices that may sup-
port phenology experts in the field by: i) providing
location-aware information regarding plant individu-
als; ii) monitoring the evolution of the data acquisi-
tion process on real time; and iii) implementing intu-
itive and loss-free mechanisms for data insertion and
validation. The main challenges faced here rely on
both the design and the in-the-field validation of ap-
propriate interfaces for data insertion using portable
devices, as well as the implementation of protocols to
guarantee that no data are lost in the whole data ac-
quisition process. This paper addresses the interface
design evaluation of developed prototypes using the
proposed guideline.
4.2 Evaluated Prototypes
The prototypes of phenological data acquisition appli-
cations considered in this study were object of design
within the scope of a graduate course in HCI (second
semester of 2012) at the Institute of Computing, Uni-
versity of Campinas, Brazil. The methodology used
in the design process was proposed based on recent
studies of usability and inspired by Participatory De-
sign practices and the Organizational Semiotics the-
ory (Baranauskas, 2014).
The design problem proposed to the students in-
volved the support to activities the biologists develop
both in the lab (Planning and Analysis) and in the
field (Field Work). The Planning and Analysis are
activities in the lab to prepare the field work (pre-
field), monitoring its execution, and analyzing data
after field work (pos-field). Thus, the design prob-
lem involved (a) the design of a (web) application
to support the planning of field work, and receiving
and analyzing the data collected, and (b) the design of
an application to support biologists in the field work.
Both applications should communicate. The object of
discussion in this paper is the mobile application to
support the biologist field work.
A set of 25 students, organized in seven groups,
worked in the role of designers to conceive and de-
velop the interface of the application. Four groups
designed mobile interfaces and three groups designed
web applications for supporting the process manage-
ment. All the groups conducted the following ac-
tivities: i) problem clarification through participatory
practices (e.g., Group Elicitation Method) and con-
text analysis through Organizational Semiotics’ arti-
facts (e.g., Stakeholder Identification Diagram, Eval-
uation Framework); ii) organization of a first set of
found elsewhere (Camargo et al., 2011; Alberton et al.,
2014).
ASemiotic-informedApproachtoInterfaceGuidelinesforMobileApplications-ACaseStudyonPhenologyData
Acquisition
39
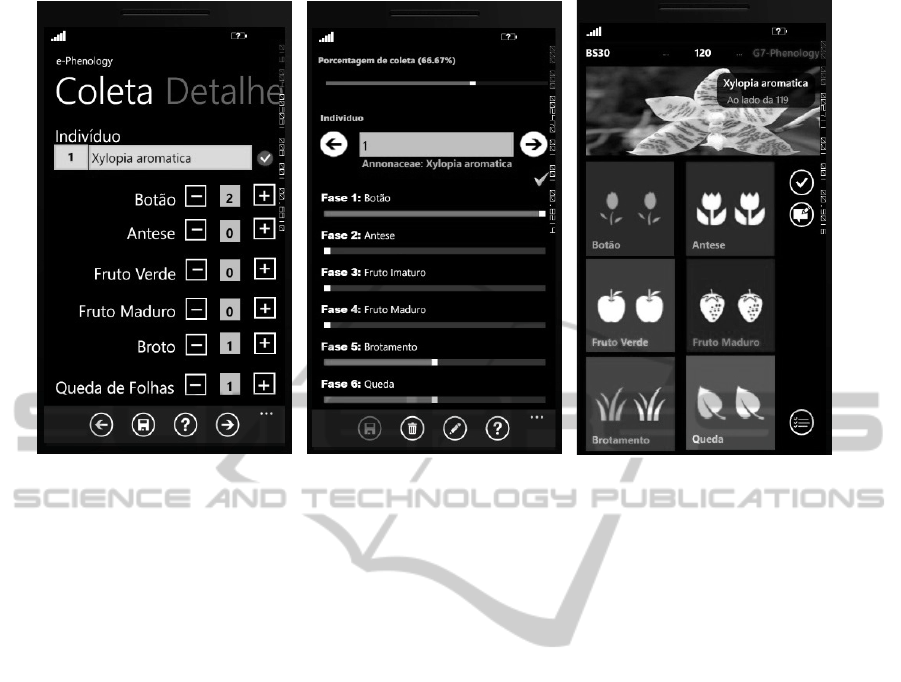
(a) Prototype 1 (b) Prototype 2 (c) Prototype 3
Figure 3: Screen shots of evaluated prototypes.
requirements, prototyping (low and high fidelity) and
evaluation in an iterative cycle.
During the process, the participants communi-
cated with the partner biologists both online and in
face-to-face meetings: from the very start when the
problem was being clarified to the validation of re-
quirements and the evaluation of different proposals.
At the end of the term, the groups presented their pro-
totypes to two biologists from the Phenology Labora-
tory, UNESP and two Computer Scientist from the In-
stitute of Computing, University of Campinas. They
were very excited with the great possibilities of the
prospective applications to facilitate and add to their
work in data acquisition in the field. Our challenge
was then to evaluate these prototypes with a sound set
of guidelines in order to discover which one (or what
aspects of them) would best fit to the needs of experts
within this domain (ePhenology Project).
The evaluation process considered three out of
four prototypes. One of them was no ready for be-
ing evaluated at that moment. In Figure 3, we can
see the screen shot of the prototypes considered in
this evaluation. These screen shots refer to the main
data acquisition procedure. In the first prototype, Fig-
ure 3(a), phenophase scores are defined using the “mi-
nus” (–) and the “plus” (+) buttons. In the second pro-
totype, Figure 3(b), the scores are defined using a slid-
ing bar for each phenophase. Finally, in the third pro-
totype, Figure 3(c), a quite different design is adopted,
where phenophase scores are represented by painted
icons: When only one icon is filled (see for example
the leaf fall phenophase – Queda in Portuguese), then
the intensity assigned to this phenophase is 1. When
two icons are filled (see for example the flower bud
phenophase – Bot
˜
ao in Portuguese), the intensity as-
signed is 2.
4.3 Results and Analysis
To evaluate the prototypes with the proposed guide-
line, we invited a group of three specialists in HCI
from the Institute of Computing, University of Camp-
inas. For this evaluation, the proposed questionnaire
was constructed from the guideline sentences and an-
swered in a Likert scale (1-5). Based on the special-
ists’ responses, we computed the average scores for
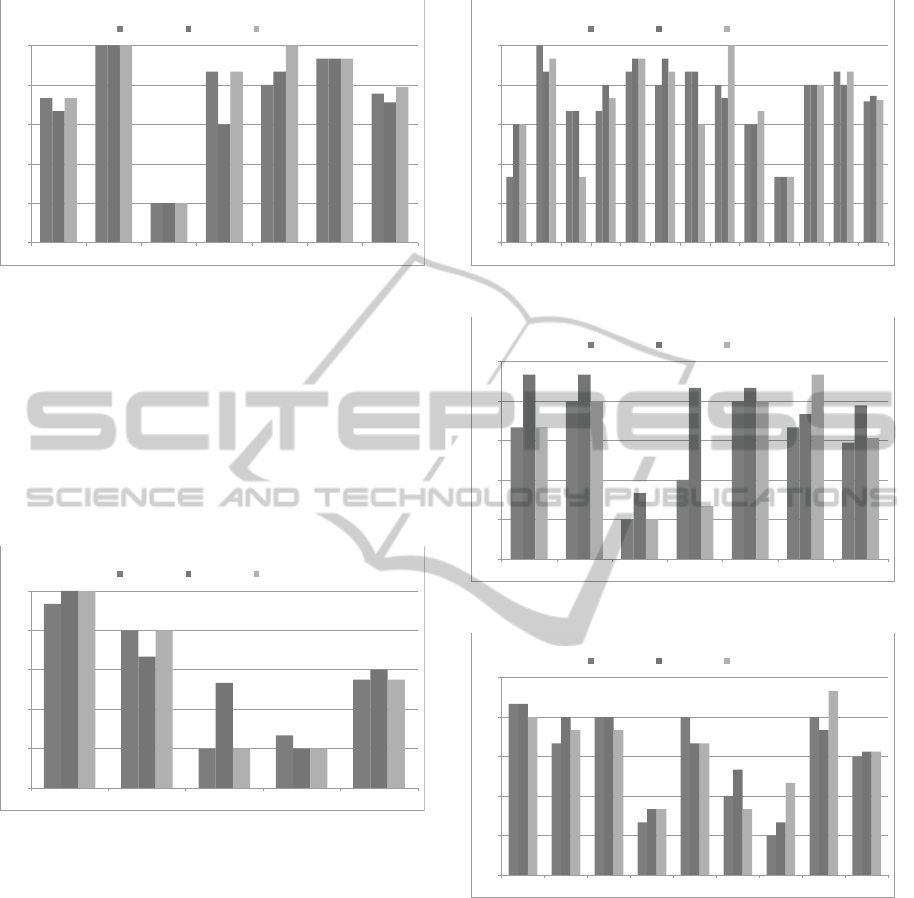
each question. Figures 4, 5, 6, 7, 8, and 9 present
these scores. Based on the evaluations, we highlight
some important points:
• Regarding the Physical World step (see Figure 4),
we can notice the high performance of all proto-
types regarding Q2 (“The application provides a
functional virtual keypad”). We can also observe
low average scores of all evaluated prototypes re-
garding Q3 (“The application provides voice as-
sistance”). Furthermore, it is worth mentioning
the low performance of Prototype 2, with regard
to Q4 (“The pictures on the screen are satisfactory
quality and size”) and the superior performance of
Prototype 3 regarding Q5 (“The application pro-
vides appropriate menu button for touch screen”).
ICEIS2015-17thInternationalConferenceonEnterpriseInformationSystems
40
0.00
1.00
2.00
3.00
4.00
5.00
Q1 Q2 Q3 Q4 Q5 Q6 Avg
Physical World
Prototype 1 Prototype 2 Prototype 3
Figure 4: Average results for the Physical World step.
• Regarding the Empiric step (Figure 5), we can
notice that all prototypes achieved high and low
average scores for Q7 (“The response time and
information display are fast enough”) and Q10
(“Application provides automatic update”), re-
spectively. It is worth mentioning the low scores
for Q9 (“Exchange and transmission of data be-
tween this product and other products”) observed
for all prototypes, but for Prototype 2.
0.00
1.00
2.00
3.00
4.00
5.00
Q7 Q8 Q9 Q10 Avg
Empiric
Prototype 1 Prototype 2 Prototype 3
Figure 5: Average results for the Empiric step.
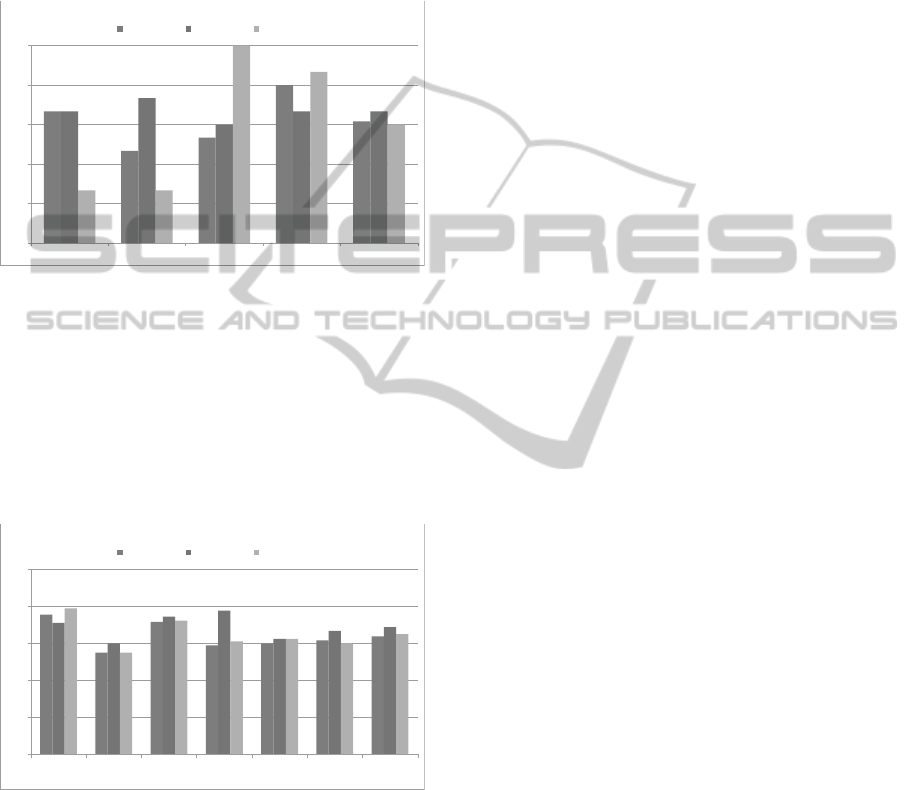
• Regarding the Syntactic step (Figure 6), we can
observe that all prototypes have high scores, ex-
cept for Prototype 1 in Q11 (“Enough information
about system resources are displayed.”) and Pro-
totype 3 in Q13 (“Letter codes for the menu se-
lection are designed carefully”). Another excep-
tion is Q20 (“The application provides shortcuts
for experienced users and wizards for new users”)
which was neglected by all the prototypes.
• Regarding the Semantic step (Figure 7), we can
observe that Prototype 2 is better than the other
ones, except for Q28 (“The design of the graphic
symbols, icons and labels on the icons are suf-
ficiently relevant”), for which Prototype 3 is the
best one. It is also worth mentioning the low
scores observed for Q25 (“The documentation
0.00
1.00
2.00
3.00
4.00
5.00
Q11 Q12 Q13 Q14 Q15 Q16 Q17 Q18 Q19 Q20 Q21 Q22 Avg
Syntactic
Prototype 1 Prototype 2 Prototype 3
Figure 6: Average results for the Syntactic step.
0.00
1.00
2.00
3.00
4.00
5.00
Q23 Q24 Q25 Q26 Q27 Q28 Avg
Semantic
Prototype 1 Prototype 2 Prototype 3
Figure 7: Average results for the Semantic step.
0.00
1.00
2.00
3.00
4.00
5.00
Q29 Q30 Q31 Q32 Q33 Q34 Q35 Q36 Avg
Pragmatic
Prototype 1 Prototype 2 Prototype 3
Figure 8: Average results for the Pragmatic step.
and manual for this application are sufficiently in-
formative”).
• Regarding the Pragmatic step (Figure 8), there is
no clear winner, except for Prototype 1 in Q33
(“The error messages are effective in assisting you
to fix problems”) and Prototype 3 in Q36 (“It is
easy to learn to work with this application”). It
is worth mentioning the low scores observed for
Q32 (“The design of application is suitable for
multiple contexts including support for runtime
adaptation”), Q34 (“The messages aimed at pre-
vent you from making mistakes are adequate”),
ASemiotic-informedApproachtoInterfaceGuidelinesforMobileApplications-ACaseStudyonPhenologyData
Acquisition
41
and Q35 (“The application provides the ability to
personalize its enviroment to suit the user”).
• Regarding the Social World step (Figure 9), all
prototypes need to be improved. We can ob-
serve, however, that Prototype 3 has the best score
for Q39 (“This application is attractive and pleas-
ing”).
0.00
1.00
2.00
3.00
4.00
5.00
Q37 Q38 Q39 Q40 Avg
Social World
Prototype 1 Prototype 2 Prototype 3
Figure 9: Average results for the Social World step.
Figure 10 shows the average scores for each Semi-
otic ladder step, considering its questions. As it can
be observed, there is no clear winner prototype re-
garding all criteria. We can point out, however, that
Prototype 2 is the best one in terms of the Empiric,
Syntactic, Semantic, and Social World steps. In fact,
its average score for questions related to the Semantic
step is impressive.
0.00
1.00
2.00
3.00
4.00
5.00
Physical
World
Empiric Syntactic Semantic Pragmatic Social World Average
Semiotic Ladder
Prototype 1 Prototype 2 Prototype 3
Figure 10: Average results for each Semiotic ladder step.
On the one hand, the results from the evaluation
through the proposed guideline show that all the pro-
totypes have interesting design decisions to be con-
sidered in the design of a final product. These results
are even more important because they came from dif-
ferent design proposals that were created based on an
informed and well-defined design process conducted
by prospective designers in a Participatory style.
On the other hand, all the prototypes had been
previously evaluated through other HCI evaluation
techniques (e.g., Maedas’ Law of Simplicity, and
Nielsen’s Heuristics) during the graduate course.
Therefore, the results show that the proposed guide-
line supported designers in the identification of ad-
ditional problems that may have go unnoticed in the
previous evaluation, suggesting the guidelines’ use-
fulness to support the evaluation of mobile interfaces.
5 CONCLUSION
The large-scale adoption of portable device applica-
tions depends on the use of careful interface design.
In this paper, we analyzed existing literature on guide-
lines, rules, and questions for portable device inter-
face design under the semiotic ladder perspective, and
proposed a novel guideline composed of 27 semiotic-
informed rules for interface evaluation.
We demonstrate the use of the proposed guideline
in the context of the evaluation of three prototypes
recently proposed for phenological data acquisition.
The analysis of results from evaluations indicates that
the proposed guideline set is well suited for the eval-
uation of mobile application interface as it helps to
identify positive and negative aspects of proposed de-
signs, according to well-defined semiotic concepts of
different information layers.
As future work, we intend to develop novel in-
terface designs based on the findings related to the
advantages and drawbacks identified in the evaluated
prototypes, and to conduct experiments in which phe-
nology experts will be able to evaluate the developed
prototypes using the proposed guideline. Addition-
ally, we are also planning to conduct further evalua-
tion activities to assess the guideline’s contributions
in different design contexts and with different groups
of experts.
ACKNOWLEDGEMENTS
This research was supported by the S
˜
ao Paulo
Research Foundation (FAPESP) - Microsoft Re-
search Virtual Institute (grants #2010/52113-5 and
#2013/50155-0). LPCM, CB, and RST receive
a Productivity Research Fellowship from CNPq
(grants #306243/2010-5, #308618/2014-9 and
#306587/2009-2). BA receives a PhD fellowship
from FAPESP (grant #2014/00215-0). Also, we have
been benefited from funds of CNPq, CAPES, and
FAPESP (grants #2007/52015-0, #2007/59779-6,
#2009/18438-7, and #2010/51307-0). We would like
also to thank the research group led by Profa. Cecilia
ICEIS2015-17thInternationalConferenceonEnterpriseInformationSystems
42

Baranauskas, with special thanks to experts for
their help and participation in the evaluation process.
REFERENCES
Abdallah, M. (2012). Home healthcare devices: Towards
a scalable, portable, accurate, and affordable data ac-
quisition instrument. In Bioengineering Conference
(NEBEC), 2012 38th Annual Northeast, pages 9–10.
Alberton, B., Almeida, J., Helm, R., da S. Torres, R., Men-
zel, A., and Morellato, L. P. C. (2014). Using phe-
nological cameras to track the green up in a cerrado
savanna and its on-the-ground validation. Ecological
Informatics, 19(0):62 – 70.
Ayob, N., Hussin, A., and Dahlan, H. (2009). Three layers
design guideline for mobile application. In Informa-
tion Management and Engineering, 2009. ICIME ’09.
International Conference on, pages 427–431.
Baranauskas, M. C. C. (2013). O modelo semioparticipativo
de design. In Codesign de Redes Digitais - Tecnologia
e Educac¸
˜
ao a Servic¸o da Inclus
˜
ao Social, pages 38–
66. Penso Editora Ltda.
Baranauskas, M. C. C. (2014). Social awareness in HCI.
interactions, 21(4):66–69.
Camargo, M. G. G., Souza, R., Reys, P., and Morellato, L.
P. C. (2011). Effects of environmental conditions as-
sociated to the cardinal orientation on the reproductive
phenology of the cerrado savanna tree xylopia aromat-
ica (annonaceae). Biotropica, 83(3):1007–1019.
d’Ea Neves, F. F. and Morellato, L. P. C. (2004). M
´
etodos
de amostragem e avaliac¸
˜
ao utilizados em estudos
fenol
´
ogicos de florestas tropicais. Acta Botanica
Brasileira, 18(1):99–108.
Duh, H. B.-L., Tan, G. C. B., and Chen, V. H.-h. (2006).
Usability evaluation for mobile device: A comparison
of laboratory and field tests. In Proceedings of the
8th Conference on Human-computer Interaction with
Mobile Devices and Services, MobileHCI ’06, pages
181–186, New York, NY, USA.
Gong, J. and Tarasewich, P. (2004). Guidelines for handheld
mobile device interface design. In Proceedings of DSI
2004 Annual Meeting, pages 3751–3756.
Hao, J., Kim, S. H., Ay, S. A., and Zimmermann, R.
(2011). Energy-efficient mobile video management
using smartphones. In Proceedings of the second an-
nual ACM conference on Multimedia systems, pages
11–22.
Hussain, A. and Kutar, M. (2009). Usability metric frame-
work for mobile phone application. PGNet, ISBN,
pages 978–1.
Liu, K. (2000). Semiotics in information systems engineer-
ing. Cambridge University Press.
Menzel, A., Sparks, T. H., Estrella, N., Koch, E.,
Aasa, A., Ahas, R., ALM-K
¨
UBLER, K., Bissolli,
P., Braslavsk
´
a, O., Briede, A., et al. (2006). Eu-
ropean phenological response to climate change
matches the warming pattern. Global change biology,
12(10):1969–1976.
Morellato, L., Camargo, M., D’Ec¸a Neves, F., Luize, B.,
Mantovani, A., and Hudson, I. (2010). The influence
of sampling method, sample size, and frequency of
observations on plant phenological patterns and inter-
pretation in tropical forest trees. In Hudson, I. L. and
Keatley, M. R., editors, Phenological Research, pages
99–121. Springer Netherlands.
Morellato, L. P. C., Talora, D. C., Takahasi, A., Bencke,
C. C., Romera, E. C., and Zipparro, V. (2000). Phenol-
ogy of atlantic rain forest trees: A comparative study.
Biotropica, 32(4b):811–823.
Nayebi, F., Desharnais, J.-M., and Abran, A. (2012). The
state of the art of mobile application usability evalua-
tion. In Electrical Computer Engineering (CCECE),
2012 25th IEEE Canadian Conference on, pages 1–4.
Newstrom, L. E., Frankie, G. W., and Baker, H. G. (1994).
A new classification for plant phenology based on
flowering patterns in lowland tropical rain-forest trees
at la-selva, costa-rica. Biotropica, 26(2):141–159.
Piccolo, L. S. G. and Baranauskas, M. C. C. (2013). Climb-
ing the ladder with energy: Informing the design of
eco-feedback technology with. the Fourteenth In-
ternational Conference on Informatics and Semiotics
in Organisations, IFIP WG8.1 Working Conference.
SciTePress Science and Technology Publications Por-
tugal., pages 187–194.
Podnar Zarko, I., Antonic, A., and Pripu
ˇ
zic, K. (2013). Pub-
lish/subscribe middleware for energy-efficient mobile
crowdsensing. In Proceedings of the 2013 ACM
Conference on Pervasive and Ubiquitous Computing
Adjunct Publication, UbiComp ’13 Adjunct, pages
1099–1110, New York, NY, USA. ACM.
Radio, N., Zhang, Y., Tatipamula, M., and Madisetti, V.
(2012). Next-generation applications on cellular net-
works: Trends, challenges, and solutions. Proceed-
ings of the IEEE, 100(4):841–854.
Rauch, M. (2011). Mobile documentation: Usability guide-
lines, and considerations for providing documentation
on kindle, tablets, and smartphones. In Professional
Communication Conference (IPCC), 2011 IEEE In-
ternational, pages 1–13.
Ryu, Y. S. (2005). Development of usability questionnaires
for electronic mobile products and decision making
methods. PhD thesis, Virginia Polytechnic Institute
and State University.
Schwartz, M. D. (2013). Phenology: An Integrative Envi-
ronmental Science. Springer Netherlands.
Stamper, R. (1973). Information in Business and Adminis-
trative Systems. John Wiley & Sons, Inc., New York,
NY, USA.
Zamzami, I. and Mahmud, M. (2012). User satisfaction
on smart phone interface design, information quality
evaluation. In Advanced Computer Science Applica-
tions and Technologies (ACSAT), 2012 International
Conference on, pages 78–82.
ASemiotic-informedApproachtoInterfaceGuidelinesforMobileApplications-ACaseStudyonPhenologyData
Acquisition
43
