
Integrating Explicit Knowledge in the Visual Analytics Process
Knowledge-assisted Visual Analytics Methods for Time-oriented Data
Markus Wagner
IC\M/T-Institute of Creative\Media/Technologies, St. Poelten University of Applied Sciences,
Matthias Corvinus-Straße 15, St. Poelten, Austria
Faculty of Informatics, Vienna University of Technology, Erzherzog-Johann-Platz 1/180, A-1040 Vienna, Austria
ABSTRACT
In this paper, I describe my thesis project for the in-
tegration of explicit knowledge from domain experts
into the visual analytics process. As base for the
implementation of the research project, I will follow
the nested model for visualization design and valida-
tion. Additionally, I use a problem-driven approach
to study knowledge-assisted visualization systems for
time-oriented data in the context of real world prob-
lems. At first, my research will focus on the IT-
security domain where I analyze the needs of malware
analysts to support them during their work. There-
fore I have currently prepared a problem characteriza-
tion and abstraction to understand the needs of the do-
main experts to gain more insight into their workflow.
Based on that findings, I am currently working on the
design and the implementation of a prototype. Next,
I will evaluate these visual analytics methods and fi-
nally I will test the generalizability of the knowledge-
assisted visual analytics methods in a second domain.
Keywords. Visual Analytics, Implicit Knowledge,
Explicit Knowledge, Problem-driven Research,
Time-oriented Data, Knowledge-assisted Visualiza-
tion.
1 RESEARCH PROBLEM
Visual analytics, “the science of analytical reasoning
facilitated by interactive visual interfaces” (Thomas
and Cook, 2005, p. 4), is a comparably young re-
search field. A major tenet of visual analytics is that
analytical reasoning is not a routine activity that can
be automated completely (Wegner, 1997). Instead it
depends heavily on analysts’ initiative and domain ex-
perience. Visual interfaces, especially Information
Visualizations (InfoVis), are high bandwidth gate-
ways for perception of structures, patterns, or connec-
tions hidden in the data. Interaction is “the heart” of
InfoVis (Spence, 2006, p. 136) and allows the analyt-
ical reasoning process to be flexible and react to un-
expected insights. Furthermore, visual analytics in-
volves automated analysis methods, which perform
computational activities on potentially large volumes
of data and thus complement human cognition.
When analysts solve real world problems, they
have large volumes of complex and heterogeneous
data at their disposal. On the one hand time-oriented
data (see Section 1.1) is of particular importance due
to its central role in many analysis contexts and tasks
and on the other hand the distinct characteristics of
the dimension time make distinct methods necessary.
By externalization and storing of the implicit knowl-
edge, it will be made available as explicit knowledge
(see Section 1.2). In addition to sophisticated analysis
methods, implicit and tacit knowledge about the data,
the domain or prior experience are often required to
make sense of this data and not get overwhelmed.
In this work I examine how the visual analytics pro-
cess can benefit from explicit knowledge of analysts.
This will help to develop more effective environments
for gaining insights – the ability to specify, model
and make use of auxiliary information about data and
domain specifics. In addition to the raw data they
will help to better select, tailor, and adjust appropri-
ate methods for visualization, interaction, and auto-
mated analysis. Potential application domains bene-
fiting from this are healthcare, biotechnology, urban-
and cyberinfrastructures, environmental science and
many more.
The main goal of this thesis is to develop
knowledge-assisted visualization and interaction
methods (see Section 1.3) that make use of explicit
knowledge to improve these methods in a context-
specific manner. This reflects intricate problems
which are recognized by the visual analytics com-
munity as important research challenges (Pike et al.,
2009).
To be effective, visual analytics needs to provide
‘precise’ data, “which is immediate, relevant and un-
9
Wagner M..
Integrating Explicit Knowledge in the Visual Analytics Process - Knowledge-assisted Visual Analytics Methods for Time-oriented Data.
Copyright
c
2015 SCITEPRESS (Science and Technology Publications, Lda.)

derstandable to individual users, groups, or commu-
nities of interest” (Kielman et al., 2009, p. 240). For
example analysts might have hunches, which sources
they believe to be trustable, which results appear plau-
sible and which insights they deem relevant. By ex-
ternalizing this knowledge and using it, analysts can
avoid cognitive overload and use visualization and au-
tomated analysis methods more effectively. They can
avoid reinventing the wheel, when they repeat anal-
ysis on a different dataset, a year later, or through
a different technique. They can keep track of in-
terpretations and analysis steps, communicate with
co-analysts, and document results for insight prove-
nance. Leading visualization researchers have repeat-
edly called for the integration of knowledge with vi-
sualization. Chen (2005) lists ’prior knowledge’ as
one of ten unsolved InfoVis problems. He argues that
InfoVis systems need to be adaptive for accumulated
knowledge of users, especially domain knowledge
needed to interpret results. In their discussion of the
‘science of interaction’, Pike et al. (2009) point out
that visual analytics tools have only underdeveloped
abilities to represent and reason with human knowl-
edge. Therefore, they declare ‘knowledge-based in-
terfaces’ as one of seven research challenges for the
next years.
1.1 Time-oriented Data
Visual exploration and analytical reasoning with time-
oriented data are common and important for numer-
ous application scenarios, e.g., in healthcare (Combi
et al., 2010), business (Lammarsch et al., 2009), and
security (Fischer et al., 2012; Saxe et al., 2012). Fur-
thermore, time and time-oriented data have distinct
characteristics that make it worthwhile to treat it as
a separate data type (Shneiderman, 1996; Andrienko
and Andrienko, 2005; Aigner et al., 2011). Explicit
knowledge may model the relevance of data items in
respect to zoom levels and recommend summariza-
tion techniques depending on task(s) and domain(s).
When dealing with time, we commonly interpret
it with a calendar and its time units are essential for
reasoning about time. However, these calendars have
complex structures. In the Gregorian calendar the du-
ration of a month varies between 28 and 31 days and
weeks overlap with months and years. Furthermore,
available data may be measured at different levels of
temporal precision. Some patterns in time-oriented
data may emerge when a cyclic structure of time is
assumed, for example, traffic volume by time of day,
temperature by season.
In other cases, an analyst will need to balance
such effects to understand long term trends. An an-
alyst may be interested to compare developments in
the data that do not cover the same portion of time.
For such comparisons, they are interested in relative
time to some sentinel events. Therefore they would
align patient data by the beginning of a specific ther-
apy, and show all events one day after the beginning
(Wang et al., 2008; Rind et al., 2011).
1.2 Explicit Knowledge
Computerized representations of interests and domain
knowledge will be referred to as ‘explicit knowledge’.
As there are many competing definitions of ‘knowl-
edge’ in scientific discourse, the definition of the com-
munity of knowledge-assisted visualization is:
“Knowledge: Data that represents the re-
sults of a computer-simulated cognitive pro-
cess, such as perception, learning, associa-
tion, and reasoning, or the transcripts of some
knowledge acquired by human beings.” (Chen
et al., 2009, p. 13)
In this work mainly the second part of this def-
inition is of importance. Wang et al. (2009) further
distinguish between explicit knowledge that “can be
processed by a computer, transmitted electronically,
or stored in a database” while tacit knowledge “is
personal and specialized and can only be extracted
by human”. In this thesis, the focus will be to in-
vestigate how explicit knowledge can be used to sup-
port interactive visualization (knowledge-assisted vi-
sualization). The specification of the users knowledge
will not be a part of this work.
1.3 Knowledge-assisted Visualization
There are numerous ways to optimize visualization
and interaction methods based on explicit knowledge.
For example choosing variables for scatter plot axes,
zooming to an area of interest instead of the viewport
center, highlighting data items in a different color, or
drawing reference lines in the background of a plot.
Such optimizations can be applied to most aspects of
the visualization and developing a general framework
instead of scenario-specific solutions is a challenging
task (Tominski, 2011).
The visual analytics of data is an explorative pro-
cess. If there is given a dataset, the user needs
to decide, which visualization method(s) he wants
to use for the data exploration. The objectives of
knowledge-assisted visualizations include the sharing
of explicit knowledge (domain knowledge) from dif-
ferent users. Thus, it reduces the stress on users for
appropriate knowledge about complex visualization
techniques (Chen and Hagen, 2010).
VISIGRAPP2015-DoctoralConsortium
10

For example, explicit knowledge can be used to
summarize and abstract a dataset. These summa-
rizations and abstractions will form another dataset,
which can be visualized through a wide range of ex-
isting visualization and interaction methods. Typi-
cally this abstraction process reduces the size of the
dataset significantly. However, analysts also need
to access the input dataset and switching between
visualizations of both datasets should be facilitated
by techniques like semantic zoom (Perlin and Fox,
1993) or brushing and linking (Becker and Cleveland,
1987). The wide ranging potential of utilizing explicit
knowledge has already been demonstrated in recent
research (Chen and Hagen, 2010). Despite this, most
current visualization systems do not take advantage of
explicit knowledge captured from domain experts.
2 OUTLINE OF OBJECTIVES
In this project, the overall aim is to develop
knowledge-assisted visual analytics methods to gain
insights effectively from time-oriented datasets (see
Section 1.1). In these methods, explicit knowledge
is treated as externally given, and the focus will be on
how to best integrate them into the process to improve
sense-making.
Knowledge-assisted visualization and interaction
methods (see Section 1.3) will be developed to ex-
plore time-oriented datasets. I hypothesize that ex-
plicit knowledge (see Section 1.2) will afford for more
effective analytical reasoning processes (e.g., through
semi-automated visualization) and prevent data in-
terpretation errors. Finally, all developed methods
need to undergo evaluation. Scenarios will be iden-
tified with target users, tasks, and datasets that act as
testbeds. Designs and prototypes will be iteratively
evaluated and refined. Based on these aims this work
investigates the following research questions:
• Main Question: How can the visual analytics
process benefit from explicit knowledge of ana-
lysts?
• Sub Question: How can explicit knowledge be
visually represented effectively in an visual ana-
lytics system?
• Sub Question: Is it possible to generalize the
interaction with knowledge-assisted visualization
methods for different application scenarios?
• Sub Question: How can analysts during the ex-
ploration of a large amount of data benefit from
knowledge-assisted visual analytics methods?
The developed methods of this thesis will primar-
ily deal with time-oriented data, but in future work
they will also be applicable for other datasets.
3 STATE OF THE ART
The permanent growth of methods and parameters
which are available for data visualization can be con-
fusing for novice users and even for domain experts.
Another problem is that the extensive know-how is
not stored in a central place because it is separated
in sub-communities (Nam et al., 2009; Mistelbauer
et al., 2012). Knowledge-assisted visualizations
(KAV) are a fast increasing field which uses direct
integrated expert knowledge to produce effective data
visualizations. Most of the KAV systems concentrate
on the integration of specific domain knowledge
which can only be used for exactly these analysis
tasks. Additionally it is important that the users
become aware of the different methods which are
needed for the data exploration and interaction but
not all methods are usable or effective for the dif-
ferent data types to gain the expected results (Wang
et al., 2009; Mistelbauer et al., 2012). Existing data
visualization systems need a manual specification for
each data attribute of possible visualizations. This is
also significant for data which are available as linked
open data and systems which represent the data as
graphs with objects and weighted edges with labels
(Cammarano et al., 2007). It is important to differen-
tiate between automatic visualization systems (AVS)
and automated visualization systems. Automatic
visualization systems make independent decisions
about the visualization activities. The automated
visualization system is a programming system for
the automated generation of diagrams, graphics and
visualizations. In general it is necessary that the flow
of an automate visualization system works like an
expert would perform it (Wills and Wilkinson, 2010).
Cammarano et al. (2007) described in their paper
the automatization of the data integration and the au-
tomatic mapping of data attributes to visual attributes.
This workflow was described as the “schema match-
ing problem” (Cammarano et al., 2007). It includes
the automated finding of ways in the data model
for each needed visualization attribute based on vi-
sualization templates. The used data model equals
the Resource-Description-Framework (RDF). Each
subject-predicate-object triple of the RDF model cor-
responds to the edge which connects a subject with
an object. Based on the provided experiments the au-
thors showed that the needed data could be identified
frequently enough that the system could be used as
an exploration tool. This way it saves the user from
schema-heterogeneity.
Falconer et al. (2009) treated the generation of
adapted visualizations based on ontological datasets
IntegratingExplicitKnowledgeintheVisualAnalyticsProcess-Knowledge-assistedVisualAnalyticsMethodsfor
Time-orientedData
11

and the specification of ontological mappings. The
usability of this approach was demonstrated by the
use of the ontology-mapping-tool COGZ in this pa-
per, whereat ontological mappings would be trans-
lated into software transformation rules. With this
transformations, the domain specific data are con-
verted in a way to fit to a model which describes the
visualization. To perform the mappings, the authors
developed a rule description library based on Atlas
Transformation Language (ATL) (Jouault and Kurtev,
2006). With this library they converted the specific
source data into target mappings. The tests of the sys-
tem showed that the system performed an automated
mapping of the data, whereby the user was assisted
greatly in his work.
Gilson et al. (2008) described in their paper the
automated generation of visualizations from domain
specific data of the web. Therefore, they described
a general system pipeline which combines ontolog-
ical mappings and probabilistic argumentation tech-
niques. In the first step, they mapped a website
into a domain ontology which stores the seman-
tics of the specific subject domains (e.g. music
charts). Subsequently they mapped it to one or more
visual-representation-ontologies whereby each con-
tains the semantic of a visualization technique (e.g.
treemap). To guarantee the mapping between the
two ontologies, they introduced a semantic-bridge-
ontology which specifies the suitability of each on-
tology. Based on this approach, they implemented a
prototype with the name SemViz. For the tests of the
system, they used the data of popular music websites
without having prior knowledge about the pages.
Mackinlay et al. (2007) introduced in their pa-
per the tool Show Me which is an integrated set of
interface commands and standard values which au-
tomatically integrate data presentations into the tool
Tableau. The key aspect of Tableau is VizQL (vi-
sualization query language) which would be used by
Show Me to generate automated presentations in a
view table. One of the major aspects is the usabil-
ity of the tool which has to support the flow of visual
analytics. This includes the automated selection of
marking techniques, commands to combine individ-
ual fields to one view and some commands to gener-
ate views from multiple fields. The APT system by
Mackinlay (1986) forms the basis for the automated
design of graphical representations of relational infor-
mation. The authors implemented Bertins semiology
of graphics as algebraic operations (Bertin, 1983) and
used them for the search of effective presentations for
the information.
Wills and Wilkinson (2010) described the data
viewer tool AutoVis which reacts on content (text,
relational tables, hierarchies, streams, images) and
presents the containing information in an appropri-
ate form (e.g. like an expert will do it). The design
is based on the grammar of graphics and the logic
is based on statistical analysis. This automatic vi-
sualization system was developed to provide a first
look on the data until the modeling and analysis are
finished. AutoVis was designed to protect the re-
searchers ignoring missing data, outliers, miscodings
and other anomalies which injure the statistical adop-
tion or the validity of the models. The design of this
system contains some unique features: a spare inter-
face, a graphics generator, a statistical analysis to pro-
tect users from false conclusions and pattern recogni-
tion.
Tominski (2011) described in his paper a new ap-
proach for event-based visualizations which contains
three fundamental stages. First, the event specifica-
tion is to generate event types which are interesting
as a visualization for the users. This translates the
user interests in an understandable representation for
the computer, where they should be formulated for
the user as easy as possible. The second stage speci-
fied where the interests of the users intersects with the
data. This detection must be kept as general as possi-
ble so that it is applicable to a large number of event
types. The basic task is to assess encapsulated the
conditions of event types. The aim of the third step is
to integrate the detected event instances in visual rep-
resentations (which reflect the interests of users). The
event representation has great influence on the extent
to which the event-based visualization closes the gap
for world view. This general model allows the use
of many different visualizations and the specific data-
driven events focused on relational data visualizations
of today.
Kadlec et al. (2010) described in their paper that
scientists are using seismic 3D data for 30 years to
explore the earth crust by the interpretation of seismic
data which needs a lot of expert knowledge. But it is
possible to use the knowledge of experts in order to
facilitate the segmentation of the geological features.
To reduce the need for knowledge of seismic data and
attributes, this new method uses surfaces which are
growing in surfaces of known geologic characteris-
tics. The result is a knowledge-assisted visualization
and segmentation system that allows non-expert users
a fast segmentation of geological features in complex
data collections. The process begins with the explo-
ration of seismic datasets using 2D slices. This 3D
volume are searched interactively for possible inter-
esting features. The elements are rendered and the
user receives a feedback on the quality of the seg-
mented features. If the system indicates a link to a
VISIGRAPP2015-DoctoralConsortium
12

non-feature, the user has the ability to repair this. This
approach transferred the expert knowledge very fast
and reliable for non-expert users. This way the anal-
ysis quality of non-expert users increases similar to
those of experts.
Nam et al. (2009) described that domain specific
know-how is separated in sub-communities. To over-
come this problem they started to store visualization
expertises and methods in combination with possible
datasets. An important aspect is to edit newly gener-
ated datasets with the existing expert knowledge from
a database. Therefore, they used several levels of
granularity to use the knowledge of the database cor-
rectly. Thus, they described the first step of a frame-
work specifically in relation to the data categorization
and classification by using a set of feature vectors.
The usability of the framework was demonstrated on
four medical datasets (knee, chest and head 2x) in a
2D application. They calculated for every dataset fea-
ture points in a local density histogram and described
them as low-level feature vectors. These would be
used to prepare high-level-models of the data objects.
Furthermore, they want to support a general frame-
work for classification tasks by indexing a database
knowledge for knowledge-assisted visualization sys-
tems (KAV).
Wang et al. (2009) differentiated between two
types of knowledge (implicit and explicit) and defined
four conversion processes between them (internaliza-
tion, externalization, cooperation and combination)
which were included in knowledge-assisted visual-
izations. They showed the applications of these four
processes their roles and utilities in real-life scenarios
using a visual analysis system for the Department of
Transportation. The authors assume that the analysts
can learn more through the interaction between im-
plicit and explicit knowledge through the use of inter-
active visualization tools. As a further distinction be-
tween implicit and explicit knowledge in knowledge-
assisted visualization, the following is stated by the
authors:
• “Explicit knowledge is different from data or in-
formation.”
• “Tacit knowledge can only result from human cog-
nitive processing (reasoning).”
• “Explicit knowledge exists in data, and is inde-
pendent from the user or his tacit knowledge.”
• “Explicit and tacit knowledge are related and can
be connected through the use of interactive visu-
alization tools.” (Wang et al., 2009, p. 2)
Upon connection of the system to an ontological
knowledge source, the visual analytics system enables
the user an interactive access to the expertise of the
expert. Thus, this visualization system showed that
the four knowledge conversion processes are possible
for the design of knowledge-assisted visualization.
Mistelbauer et al. (2012) described in their paper
a knowledge-assisted system for medical data visual-
ization (Smart Super Views). This system has been
tested in the medical domain and expert feedback was
obtained. The Smart Super Views system contains
three major steps: In the first step the information
from different sources will be collected and merged.
In the second step, the user decides where a region of
interest (ROI) is located in the data and which visu-
alization technique should be used. In the third step,
the user interacts with the provided visualization and
starts with a detailed inspection of the data. In con-
trast to other systems where the user himself has to
select the visualization, this system will support the
user in his decisions. The rule specification module
of the system defines the connection between the in-
put data and the output visualization. To model these
connections there will be used if-then clauses, which
were specified by domain experts. Additionally, these
clauses were stored in a user-readable form in a file.
3.1 Discussion
The automation of the data integration and the auto-
matic mapping of data attributes to visual attributes is
discussed in many papers (e.g. (Cammarano et al.,
2007; Falconer et al., 2009; Gilson et al., 2008;
Mackinlay et al., 2007; Wills and Wilkinson, 2010;
Kadlec et al., 2010; Mistelbauer et al., 2012)). The
generation of adapted visualizations which are based
on ontological datasets and the specification of onto-
logical mappings are treated by Falconer et al. (2009).
A similar approach was also followed by Gilson et al.
(2008). They described a general system pipeline
which combines ontology mapping and probabilis-
tic reasoning techniques. The approach of Gilson
et al. (2008) is described by the automated genera-
tion of visualizations of domain-specific data from
the web. In contrast, Falconer et al. (2009) used
the COGZ tool for their approach which converts on-
tological mappings in software transformation rules
so that it describes a model which fits the visual-
ization. Cammarano et al. (2007) describes a sim-
ilar process as “schema matching problem”. It de-
scribes finding ways in the data model for each re-
quired visualization attribute based on visualization
templates. In the end, most of the automated data
mappings for visualizations try to perform in similar
ways. Gilson et al. (2008) maps the semantic data
to visual-representation-ontologys, each part contains
the semantics of a visualization (e.g. treemaps). A
IntegratingExplicitKnowledgeintheVisualAnalyticsProcess-Knowledge-assistedVisualAnalyticsMethodsfor
Time-orientedData
13
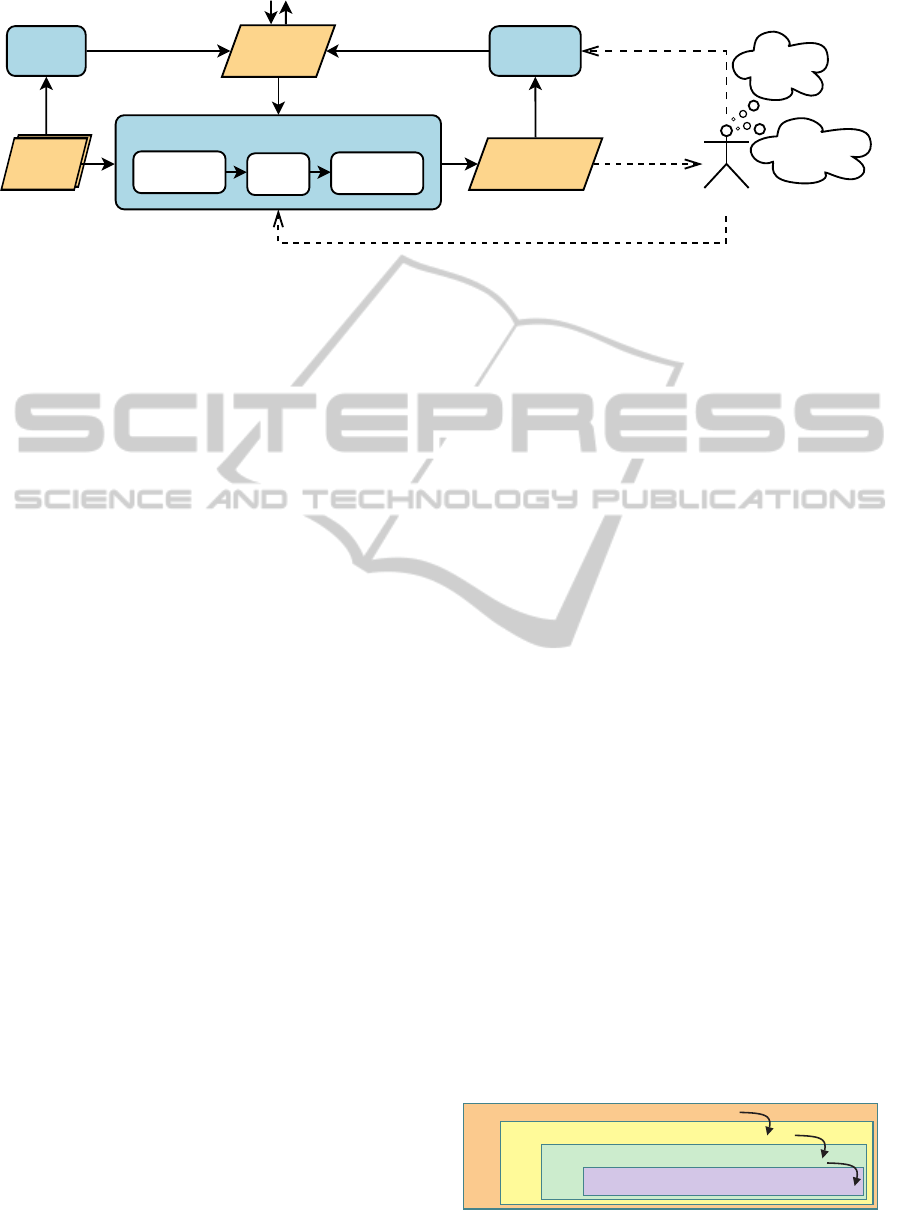
visual
representation
explicit
knowledge
data
set(s)
knowledge
specification
Analyst
interaction
insights
tacit
knowledge
tasks,
interests
knowledge-assisted visualization
data
transformations
visual
mappings
view
transformations
automated
analysis
interaction
Figure 1: This image shows the integration of explicit knowledge for knowledge-assisted visualizations in the visual analytics
process.
slightly different approach by Mackinlay et al. (2007)
has a set of interactive commands, defaults, auto-
mated data integration and presentations to accom-
plish the automated data presentation in Tableau. Due
to the automatic selection of markers, commands and
combination of individual fields to a view, the user is
able to rapidly and easily create visualizations by the
use of the tool Show Me. Furthermore, the tool Auto-
Vis was implemented by Wills and Wilkinson (2010)
to take a first look at data which has to be visual-
ized. For this, the system used statistical analysis for
modeling the visualizations. Thus, the user should
be prevented of ignoring missing data, outliers, miss-
ing codes and other anomalies. The protection (e.g.
(Cammarano et al., 2007)) or the support of the users
during their work (e.g. (Falconer et al., 2009; Mackin-
lay et al., 2007; Tominski, 2011; Kadlec et al., 2010;
Mistelbauer et al., 2012)) is one of the main foci of
this papers.
The event-based model by Tominski (2011) per-
mits the applicability for many different visualiza-
tions which are divided into three stages. A stepwise
subdivision is also used by Gilson et al. (2008) for
the required mapping instances and Mistelbauer et al.
(2012) used a stepwise subdivision for the three pro-
cessing steps of the Smart Super Views. The three
essential steps for a knowledge-assisted visualization
tool according to Mistelbauer et al. (2012) are: first
to collect and merge the data; second, to determine
the region of interest (ROI) in the data by the user;
third, the interaction of users with the generated vi-
sualization. The automated generation of visualiza-
tions respectively the assigning of the data to pre-
defined visualization templates is also carried out in
other papers, which were presented in this state of
the art report, on similar ways. In some papers it
is also described that the knowledge of experts is
distributed. Therefore, it is important to develop
knowledge-assisted visualization systems to make the
knowledge of experts available for the users (e.g.
(Kadlec et al., 2010; Nam et al., 2009; Wang et al.,
2009)). Usually, the knowledge of experts is stored in
files (e.g. (Mistelbauer et al., 2012)),using RDF (e.g.
(Cammarano et al., 2007)) or in a knowledge database
(e.g. (Nam et al., 2009)).
Based on these findings, it can be seen that most
of the papers treat the storing or the availability of
explicit knowledge. Additionally, most of the cur-
rently implemented knowledge assisted visualization
systems are concentrated on the integration of specific
domain knowledge which could only be used for pre-
cise analysis task. Even automated generations of vi-
sualizations are described for example by Mackinlay
et al. (2007), but knowledge-assisted visualizations
methods in combination with visual analytics are not
clearly addressed in those papers. Thus it is clear that
a lot of space for future research is available in the
field of knowledge-assisted visualizations in combi-
nation with visual analytics, especially in the general-
ization of knowledge-assisted visualization methods.
4 METHODOLOGY
In this section, the plan how to apply and study
knowledge-assisted visualizations in combination
with visual analytics methods will be presented. Ex-
plicit knowledge of domain experts will be used to
support users during the analysis of time-oriented
data.
By the use of knowledge-assisted visualizations,
the available datasets will be turned into interactive
domain problem characterization
data/operation abstraction design
encoding/interaction technique design
algorithm design
Fig. 1. Our model of visualization creation has four nested layers.
a tool for that audience. Although this concept might seem obvious,
sometimes designers cut corners by making assumptions rather than
actually engaging with any target users. Moreover, eliciting system
requirements is not easy, even when a designer has access to target
users fluent in the vocabulary of the domain and immersed in its work-
flow. As others have pointed out [42], asking users to simply introspect
about their actions and needs is notoriously insufficient. Interviews
are only one of many methods in the arsenal of ethnographic method-
ology [9, 39, 42].
The output of domain workflow characterization is often a detailed
set of questions asked about or actions carried out by the target users
for some heterogeneous collection of data. The details are necessary:
in the list above, the high-level domain problem of “cure disease” is
not sufficiently detailed to be input to the next abstraction level of
the model, whereas the lower-level domain problem of “investigate
microarray data showing gene expression levels and the network of
gene interactions” is more appropriate. In fact, even that statement is
a drastic paraphrase of the domain problem and data description in the
full design study [6].
2.3 Operation and Data Type Abstraction
The abstraction stage is to map problems and data from the vocabulary
of the specific domain into a more abstract and generic description that
is in the vocabulary of computer science. More specifically, it is in the
vocabulary of information visualization: the output of this level is a
description of operations and data types, which are the input required
for making visual encoding decisions at the next level.
By operations, we mean generic rather than domain-specific tasks.
There has been considerable previous work on constructing tax-
onomies of generic tasks. The early work of Wehrend and Lewis also
proposes a similar abstraction into operations and data types (which
they call objects) [51]. Amar and Stasko have proposed a high-level
task taxonomy: expose uncertainty, concretize relationships, formu-
late cause and effect, determine domain parameters, multivariate ex-
planation, and confirm hypotheses [2]. Amar, Eagan, and Stasko have
also proposed a categorization of low-level tasks as retrieve value,
filter, compute derived value, find extremum, sort, determine range,
characterize distribution, find anomalies, cluster, correlate [1]. Valiati
et al. propose identify, determine, visualize, compare, infer, configure,
and locate [47]. Although many operations are agnostic to data type,
others are not. For example, Lee et al. propose a task taxonomy for
graphs which includes following a path through a graph [25].
The other aspect of this stage is to transform the raw data into the
data types that visualization techniques can address: a table of num-
bers where the columns contain quantitative, ordered, or categorical
data; a node-link graph or tree; a field of values at every point in space.
The goal is to find the right data type so that a visual representation of
it will address the problem, which often requires transforming from the
raw data into a derived type of a different form. Any data type can of
course be transformed into any other. Quantitative data can be binned
into ordered or categorical data, tabular data can be transformed into
relational data with thresholding, and so on.
Unfortunately, despite encouragement to consider these issues from
previous frameworks [8, 10, 43], an explicit discussion of the choices
made in abstracting from domain-specific tasks and data to generic
operations and data types is not very common in papers covering the
design of actual systems. A welcome early exception is the excellent
characterization of the scientific data analysis process by Springmeyer
et al., which presents an operation taxonomy grounded in observations
of lab scientists studying physical phenomena [40].
However, frequently this abstraction is done implicitly and without
justification. For example, many early web visualization papers im-
plicitly posited that solving the “lost in hyperspace” problem should be
done by showing the searcher a visual representation of the topological
structure of its hyperlink connectivity graph [30]. In fact, people do
not need an internal mental representation of this extremely complex
structure to find a web page of interest. Thus, no matter how cleverly
the information was visually encoded, these visualizations all incurred
additional cognitive load for the user rather than reducing it.
This abstraction stage is often the hardest to get right. Many de-
signers skip over the domain problem characterization level, assume
the first abstraction that comes to mind is the correct one, and jump
immediately into the third visual encoding level because they assume
it is the only real or interesting design problem. Our guideline of ex-
plicitly stating the problem in terms of generic operations and data
types may force a sloppy designer to realize that the level above needs
to be properly addressed. As we discuss in Section 3.2, this design
process is rarely strictly linear.
The first two levels, characterization and abstraction, cover both
tasks and data. We echo the call of Pretorius and van Wijk that both of
these points of departure are important for information visualization
designers [34].
2.4 Visual Encoding and Interaction Design
The third level is designing the visual encoding and interaction. The
design of visual encodings has received a great deal of attention in the
foundational information visualization literature, starting with the in-
fluential work from Mackinlay [26] and Card et al. [8] (Chapter 1).
The theory of interaction design for visualization is less well devel-
oped, but is starting to appear [23, 52]. We consider visual encoding
and interaction together rather than separately because they are mu-
tually interdependent. Many problem-driven visualization papers do
indeed discuss the design issues for this level explicitly and clearly,
especially those written as design studies [29].
2.5 Algorithm Design
The innermost level is to create an algorithm to carry out the visual en-
coding and interaction designs automatically. The issues of algorithm
design are not unique to visualization, and are extensively discussed
in the computer science literature [11].
3T
HREATS AND VALIDATION
Each level in this model has a different set of threats to validity, and
thus requires a different approach to validation. Figure 2 shows a sum-
mary of the threats and validation approaches possible at each level,
which are discussed in detail in the rest of this section. A single pa-
per would include only a subset of these validation methods, ideally
chosen according to the level of the contribution claims.
In our analysis below, we distinguish between immediate and down-
stream validation approaches. An important corollary of the model
having nested levels is that most kinds of validation for the outer levels
are not immediate because they require results from the downstream
levels nested within them. The length of the red lines in Figure 2
shows the magnitude of the dependencies between the threat and the
downstream validation, in terms of the number of levels that must be
addressed. These downstream dependencies add to the difficulty of
validation: a poor showing of a validation test that appears to inval-
idate a choice at an outer level may in fact be due to a poor choice
at one of the levels inside it. For example, a poor visual encoding
choice may cast doubt when testing a legitimate abstraction choice,
or poor algorithm design may cast doubt when testing an interaction
technique. Despite their difficulties, the downstream validations are
necessary. The immediate validations only offer partial evidence of
success; none of them are sufficient to demonstrate that the threat to
validity at that level has been addressed.
3.1 Vocabulary
We have borrowed the evocative phrase threats to validity from the
computer security domain, by way of the software engineering litera-
922 IEEE TRANSACTIONS ON VISUALIZATION AND COMPUTER GRAPHICS, VOL. 15, NO. 6, NOVEMBER/DECEMBER 2009
Figure 2: The 4 levels of the nested model for visualization
design and validation by Munzner (2009).
VISIGRAPP2015-DoctoralConsortium
14

and visual representations (see Figure 1). Thus, ex-
plicit knowledge will be used to achieve effective rep-
resentations in terms of the analysis’ tasks. The visu-
alization process can be described using the reference
model of Card and Card (1999) or the data state model
of Chi and Riedl (1998). Both descriptions relate to
the internalization of the model of Wang et al. (2009).
Throughout this project, I will follow the well-
known nested model for visualization design and val-
idation as proposed by Munzner (2009) (see Figure
2). This unified approach splits visualization design
into 4 levels in combination with corresponding eval-
uation methods to evaluate the results at each level.
Starting from the top, the levels of the nested model
for visualization design and validation are:
• Domain Problem and Data Characterization:
On this level, the goal is to understand the prob-
lem domain, the users’ tasks and their goals.
• Operation and Data Type Abstraction: Within
the abstraction level, domain specific vocabulary
(problems and data) will be mapped to a more
generic description which fits to the vocabulary of
computer scientists (visualization community).
• Visual Encoding and Interaction Design: In the
third level, the visual encoding of the data and the
interaction methods for the data exploration will
be designed.
• Algorithm Design: Designing of the implemen-
tation of the visual encoding and interaction meth-
ods.
Since these are nested levels, the output of the up-
stream level which is situated above, is the input of
the downstream level which is situated below. Con-
sidering it is current practice, visual analytics was de-
fined by Keim et al. as the “[combination] of auto-
mated analysis techniques with interactive visualiza-
tions for an effective understanding, reasoning and
decision making in the basis of very large and com-
plex datasets” (Keim et al., 2010, p. 7). In general the
nested model for visualization design and validation
does not include automated analysis explicitly, but it
can be conceptualized on the abstraction level where
the data transformation takes place. This thesis will
focus on knowledge-assisted visualizations for visual
analytics to develop novel visual encoding and inter-
action methods for time-oriented data.
For the research I will follow a problem-driven
approach to study knowledge-assisted visualization
systems for time-oriented data in the context of real
world problems. At first my research will focus on
the IT-security domain. More specifically, I will an-
alyze the needs of malware analysts in relation to
their work on behavior-based malware pattern anal-
ysis Dornhackl et al. (2014). Therefore, I will design
knowledge-assisted visual analytics methods and im-
plement a software prototype as proof of concept to
test the designed methods. After this, the system will
be tested in the context of a second domain to be spec-
ified.
To ensure a knowledgeable research I will start
with a problem characterization and abstraction based
on the design study methodology of Sedlmair et al.
(2012), which brings me into the first level (do-
main problem and data characterization) of the nested
model. From there, I will work inwards along Mun-
zner’s nested model for visualization design and val-
idation. To perform the problem characterization and
abstraction, I will follow a threefold qualitative re-
search approach which consists of a systematic lit-
erature research, a focus group (Lazar et al., 2010,
p. 192) and semi-structured interviews (Lazar et al.,
2010, p. 184) with domain experts. Based on the re-
sults of the threefold approach, I will use the design
triangle as proposed by Miksch and Aigner (2014) to
analyze the data, the users and the tasks which fits to
the second level of Munzner’s model (operation and
data type abstraction).
In the following steps, I will start with the visu-
alization and interaction design followed by the al-
gorithm design and implementation based on a user
centered design process (Sharp et al., 2007). There-
fore I will produce sketches, followed by screen pro-
totypes and functional prototypes (Kulyk et al., 2007,
p. 50). This way I will fulfill the third (visual en-
coding and interaction design) and the fourth (algo-
rithm design) level of Munzner’s nested model. Dur-
ing these steps, focus group members will be included
in the design and implementation process to get feed-
back about the design and the functionality of the
knowledge-assisted visual analytics system. Thus it
will be possible to improve the design and the han-
dling of the designed knowledge-assisted visualiza-
tion methods.
Additionally, user studies will be performed with
predefined datasets to evaluate the usability (Cooper
et al., 2007, p. 70) of the new knowledge-assisted vi-
sualization methods based on the implemented visual
analytics system.
After the performed user studies, which will be
based on the first real world problem (behavior-based
malware pattern analysis) of the knowledge-assisted
visualization methods are completed, I will start to
test their applicability on a second real world prob-
lem. Therefore, I will adapt/extend the knowledge-
assisted visualization methods, if it is necessary, and I
will repeat the previously described research process
in the required extent.
IntegratingExplicitKnowledgeintheVisualAnalyticsProcess-Knowledge-assistedVisualAnalyticsMethodsfor
Time-orientedData
15

5 EXPECTED OUTCOME
The goal of this thesis is to show how the visual ana-
lytics process can benefit from the use of knowledge-
assisted visual analytics methods. To achieve this, im-
plicit knowledge of the domain-specific analysis ex-
perts will be stored as explicit knowledge (e.g. in
a database). This explicit knowledge will be used
to support users during their workflow in a context-
specific manner (e.g. behavior-based malware pat-
tern analysis) to achieve their goals. Thus, that
knowledge-assisted visualization methods will sup-
port the generation of more effective visual analytics
environments to gain more insights and achieve better
quality results compared to current methods.
In addition to the raw data, knowledge-assisted vi-
sual analytics methods will help to better select, tailor,
and adjust appropriate methods for visual representa-
tion, interaction, automated analysis and prevent data
interpretation errors. By externalizing the domain-
specific expert knowledge and using it, analysts can
avoid cognitive overload and use visualization and au-
tomated analysis methods more effectively. This way,
analysts can avoid reinventing the wheel, when they
repeat analysis on a different dataset, a year later,
or using a different technique. Thus, they can con-
centrate on the important steps of interpretations and
analysis, communicate with co-analysts, and docu-
ment results for insight provenance.
Furthermore, the tested knowledge-assisted visu-
alization methods will be generalized and applied to
different domains. Based on this, generalizations and
the results of the interviews and user studies (see
Section 4), I will propose general design guidelines
for future knowledge-assisted visual analytics envi-
ronments to support the community. Additionally, it
will be demonstrated how similar knowledge-assisted
visualization methods can be used for different do-
mains.
6 STAGE OF THE RESEARCH
I started with my doctoral studies on March 01, 2014.
Currently I have developed a problem characteriza-
tion and abstraction for the field of malware pattern
analysis which I presented at ACM VizSec14 (Wagner
et al., 2014). This paper deals with a user-study based
on a threefold research approach which includes a
literature research, focus group meetings and semi-
structured interviews. In relation to the combined
findings of the user-study, there was developed a data-
users-tasks analysis, based on the design triangle by
Miksch and Aigner (2014), to analyze and abstract
the results for other domains.
According to the findings of the user-study and
the data-users-tasks abstraction, I developed different
mockups and work scenarios for the prototype which
will be supported by knowledge-assisted visual ana-
lytics methods. Additionally, I started with the initial
work for the implementation of a screen prototype of
the visual analytics system and the background data
handling process.
In addition to the performed research steps, we
presented the KAVA-Time project at the European
Researchers’ Night 2014 in Vienna to the general
public.
6.1 Next Steps
In the following steps, I will finish the design and im-
plementation of the prototype system to test the new
designed knowledge-assisted visual analytics meth-
ods. For the design and implementation of the proto-
type, I will follow the paradigm of user centered de-
sign process (Sharp et al., 2007) in cooperation with
a focus group (Lazar et al., 2010, p. 192). After
these, I will perform a user-study (Lazar et al., 2010)
with predefined datasets to test the new knowledge-
assisted visual analytics methods. Additionally, I will
test the applicability on a second domain, whereby I
will adapt/extend the knowledge-assisted visual ana-
lytics methods, if it is necessary. For all this steps, I
will follow the nested model for visualization design
and validation by Munzner (2009).
ACKNOWLEDGEMENT
This work was supported by the Austrian Science
Fund (FWF) via the KAVA-Time project no. P25489.
Many thanks to my mentor Wolfgang Aigner and my
colleague Alexander Rind for their feedback to my
manuscript.
REFERENCES
Aigner, W., Miksch, S., Schumann, H., and Tominski,
C. (2011). Visualization of Time-Oriented Data.
Springer, London.
Andrienko, N. and Andrienko, G. (2005). Exploratory
Analysis of Spatial and Temporal Data: A Systematic
Approach. Springer, Berlin, New York.
Becker, R. A. and Cleveland, W. S. (1987). Brushing scat-
terplots. Technometrics, 29(2):127–142.
Bertin, J. (1983). Semiology of Graphics. University of
Wisconsin Press.
VISIGRAPP2015-DoctoralConsortium
16

Cammarano, M., Dong, X., Chan, B., Klingner, J., Talbot,
J., Halevy, A., and Hanrahan, P. (2007). Visualization
of heterogeneous data. TVCG, 13(6):1200–1207.
Card, S. and Card, M. (1999). Readings in Information Vi-
sualisation. Using Vision to Think.: Using Vision to
Think. Morgan Kaufman Publ Inc, San Francisco,
Calif.
Chen, C. (2005). Top 10 unsolved information visualization
problems. CG&A, 25(4):12–16.
Chen, M., Ebert, D., Hagen, H., Laramee, R., Van Liere,
R., Ma, K.-L., Ribarsky, W., Scheuermann, G., and
Silver, D. (2009). Data, information, and knowledge
in visualization. CG&A, 29(1):12–19.
Chen, M. and Hagen, H. (2010). Guest editors’ intro-
duction: Knowledge-assisted visualization. CG&A,
30(1):15–16.
Chi, E. H.-H. and Riedl, J. (1998). An operator interaction
framework for visualization systems. In IEEE Sym-
posium on Information Visualization, 1998. Proceed-
ings, pages 63–70.
Combi, C., Keravnou-Papailiou, E., and Shahar, Y. (2010).
Temporal Information Systems in Medicine. Springer,
New York.
Cooper, A., Reimann, R., and Cronin, D. (2007). About
Face 3: The Essentials of Interaction Design. Wiley,
Indianapolis, IN, 3rd edition.
Dornhackl, H., Kadletz, K., Luh, R., and Tavolato, P.
(2014). Malicious behavior patterns. In IEEE 8th
International Symposium on Service Oriented System
Engineering, pages 384–389.
Falconer, S., Bull, R., Grammel, L., and Storey, M. (2009).
Creating visualizations through ontology mapping. In
CISIS, pages 688–693.
Fischer, F., Mansmann, F., and Keim, D. A. (2012). Real-
time visual analytics for event data streams. In Pro-
ceedings of the 27th Annual ACM Symposium on Ap-
plied Computing, SAC ’12, pages 801–806. ACM.
Gilson, O., Silva, N., Grant, P., and Chen, M. (2008). From
web data to visualization via ontology mapping. Com-
puter Graphics Forum, 27(3):959–966.
Jouault, F. and Kurtev, I. (2006). Transforming models with
ATL. In Bruel, J.-M., editor, Satellite Events at the
MoDELS 2005 Conference, number 3844 in Lecture
Notes in Computer Science, pages 128–138. Springer
Berlin Heidelberg.
Kadlec, B., Tufo, H., and Dorn, G. (2010). Knowledge-
assisted visualization and segmentation of geologic
features. CG&A, 30(1):30–39.
Keim, D., Kohlhammer, J., Ellis, G., and Mansmann, F., ed-
itors (2010). Mastering the information age: solving
problems with visual analytics. Eurographics Associ-
ation, Goslar.
Kielman, J., Thomas, J., and May, R. (2009). Foundations
and frontiers in visual analytics. Information Visual-
ization, 8(4):239–246.
Kulyk, O., Kosara, R., Urquiza, J., and Wassink, I. (2007).
Human-centered aspects. In Kerren, A., Ebert, A., and
Meyer, J., editors, Human-Centered Visualization En-
vironments, number 4417 in Lecture Notes in Com-
puter Science, pages 13–75. Springer, Berlin.
Lammarsch, T., Aigner, W., Bertone, A., Gartner, J., Mayr,
E., Miksch, S., and Smuc, M. (2009). Hierarchical
temporal patterns and interactive aggregated views for
pixel-based visualizations. In Information Visualisa-
tion, 2009 13th International Conference, pages 44–
50.
Lazar, J., Feng, J. H., and Hochheiser, H. (2010). Re-
search Methods in Human-Computer Interaction. Wi-
ley, Chichester, West Sussex, U.K, 1 edition.
Mackinlay, J. (1986). Automating the design of graphical
presentations of relational information. ACM Trans.
Graph., 5(2):110–141.
Mackinlay, J., Hanrahan, P., and Stolte, C. (2007). Show
me: Automatic presentation for visual analysis.
TVCG, 13(6):1137–1144.
Miksch, S. and Aigner, W. (2014). A matter of time: Ap-
plying a data-users-tasks design triangle to visual an-
alytics of time-oriented data. Computers & Graphics,
Special Section on Visual Analytics, 38:286–290.
Mistelbauer, G., Bouzari, H., Schernthaner, R., Baclija, I.,
Kochl, A., Bruckner, S., Sramek, M., and Groller, M.
(2012). Smart super views: A knowledge-assisted in-
terface for medical visualization. In VAST, pages 163–
172.
Munzner, T. (2009). A nested model for visualization de-
sign and validation. TVCG, 15(6):921–928.
Nam, J. E., Maurer, M., and Mueller, K. (2009). A
high-dimensional feature clustering approach to sup-
port knowledge-assisted visualization. Computers &
Graphics, 33(5):607–615.
Perlin, K. and Fox, D. (1993). Pad: An alternative approach
to the computer interface. In Proceedings of the 20th
Annual Conference on Computer Graphics and In-
teractive Techniques, SIGGRAPH ’93, pages 57–64,
New York. ACM.
Pike, W. A., Stasko, J., Chang, R., and O’Connell, T. A.
(2009). The science of interaction. Information Visu-
alization, 8(4):263–274.
Rind, A., Aigner, W., Miksch, S., Wiltner, S., Pohl, M.,
Turic, T., and Drexler, F. (2011). Visual explo-
ration of time-oriented patient data for chronic dis-
eases: Design study and evaluation. In Holzinger,
A. and Simonic, K.-M., editors, Information Quality
in e-Health, number 7058 in LNCS, pages 301–320.
Springer, Berlin.
Saxe, J., Mentis, D., and Greamo, C. (2012). Visualization
of shared system call sequence relationships in large
malware corpora. In International Workshop on Visu-
alization for Cyber Security, VizSec ’12, pages 33–40.
ACM.
Sedlmair, M., Meyer, M., and Munzner, T. (2012). Design
study methodology: Reflections from the trenches and
the stacks. TVCG, 18(12):2431–2440.
Sharp, H., Rogers, Y., and Preece, J. (2007). Interaction
Design: Beyond Human-Computer Interaction. John
Wiley & Sons, Chichester ; Hoboken, NJ, 2. edition.
Shneiderman, B. (1996). The eyes have it: a task by
data type taxonomy for information visualizations. In
IEEE Symposium on Visual Languages. Proceedings,
pages 336–343.
IntegratingExplicitKnowledgeintheVisualAnalyticsProcess-Knowledge-assistedVisualAnalyticsMethodsfor
Time-orientedData
17

Spence, R. (2006). Information Visualization: Design for
Interaction. Prentice Hall, New York, 2nd rev. edition.
Thomas, J. J. and Cook, K. A. (2005). Illuminating the
Path: The Research and Development Agenda for Vi-
sual Analytics. National Visualization and Analytics
Ctr. Published: Paperback.
Tominski, C. (2011). Event-based concepts for user-driven
visualization. Information Visualization, 10(1):65–81.
Wagner, M., Aigner, W., Rind, A., Dornhackl, H., Kadletz,
K., Luh, R., and Tavolato, P. (2014). Problem char-
acterization and abstraction for visual analytics in
behavior-based malware pattern analysis. In Interna-
tional Workshop on Visualization for Cyber Security.
ACM.
Wang, T. D., Plaisant, C., Quinn, A. J., Stanchak, R., Mur-
phy, S., and Shneiderman, B. (2008). Aligning tem-
poral data by sentinel events: Discovering patterns
in electronic health records. In Proceedings of the
SIGCHI Conference on Human Factors in Computing
Systems, CHI ’08, pages 457–466, New York. ACM.
Wang, X., Jeong, D. H., Dou, W., Lee, S.-W., Ribarsky, W.,
and Chang, R. (2009). Defining and applying knowl-
edge conversion processes to a visual analytics sys-
tem. Computers & Graphics, 33(5):616–623.
Wegner, P. (1997). Why interaction is more powerful than
algorithms. Commun. ACM, 40(5):80–91.
Wills, G. and Wilkinson, L. (2010). AutoVis: Automatic
visualization. Information Visualization, 9(1):47–69.
VISIGRAPP2015-DoctoralConsortium
18
