
A Cloud-based Data Analysis Framework for Object Recognition
Rezvan Pakdel and John Herbert
Department of Computer Science, University College Cork, Cork, Ireland
Keywords:
Cloud-based Big Data Analytics, Big Data, OpenCV, Machine Learning, Real-time Object Recognition.
Abstract:
This paper presents a Cloud-based framework using parallel data processing to identify and recognize an object
from an image. Images contain a massive amount of information. Features such as shape, corner, color, and
edge can be extracted from images. These features can be used to recognize an object. In a Cloud-based data
analytics framework, feature detection algorithms can be done in parallel to get the result faster in comparison
to a single machine. This study provides a Cloud-based architecture as a solution for large-scale datasets to
decrease processing time and save hardware costs. The evaluation results indicate that the proposed approach
can robustly identify and recognize objects in images.
1 INTRODUCTION
Object recognition is one of the fundamental chal-
lenges in computer vision. Object recognition
by computers has been active for more than two
decades(Torralba et al., 2010) and includes image
processing algorithms which extract features from an
image to detect an object. Detection and recognition
depend on the quality of the amount of images, noise,
and occlusion. Nowadays, the number of collections
of images is increasing quickly, especially in critical
areas such as medicine, health, astronomy. Process-
ing these images therefore has a key role in science.
In this paper, features such as edge, corner, shape,
and color are used. Basically, finding an unknown
object is easy, however recognizing it, is difficult.
For being able to recognize what an object is, im-
age features are helpful however one feature is not
enough to recognize an object. A combination of fea-
tures is needed to have better object recognition accu-
racy(Hetzel et al., 2001). The features can be used to
make a unique object signature. In this work, eleven
classification models with a machine learning model
are used in parallel to recognize an object from an im-
age. Each classification model has one or more image
features.
High performance processing of a huge amount
of data across multiple machines in parallel requires
much resources and a reliable infrastructure. Cloud
Computing can be used to solve this issue by lever-
aging distributed data, computing resources and ser-
vices. Cloud Computing has several advantages.
First, the multi-core architecture decreases hardware
cost and increases computing power and storage ca-
pacity. It also is the widespread adoption of Services
Computing and Web applications. It is the exponen-
tially growing data size(Foster et al., 2008).
2 STATE OF THE ART AND
RELATED WORK
Finding and identifying objects in an image is an im-
portant task in computer vision. Humans can recog-
nize objects with irrespective view, size/scale, and ro-
tation or translation. Extracting some features from
an image, then applying some machine learning clas-
sifier to the extracted features, is a method that is used
in Image Processing(Rosten et al., 2010). Various ap-
proaches have been used to detect objects accurately
in images, such as geometry-based, appearance-based
and feature-based approaches (Yang, 2009). Feature
extraction is the main element in most object recogni-
tion methods.
The image features can be divided into two
groups, Global and Local. Local features calculate
features over the results of subdivision of the image
based on the image segmentation or edge detection.
On the other hand, global features calculate features
over the entire image or just regular sub-area of an
image(Choras, 2007). So, the global features describe
the visual content of the entire image. Global features
like shape and texture, are attractive because they pro-
duce very compact representations of images, where
79
Pakdel R. and Herbert J..
A Cloud-based Data Analysis Framework for Object Recognition.
DOI: 10.5220/0005409900790086
In Proceedings of the 5th International Conference on Cloud Computing and Services Science (CLOSER-2015), pages 79-86
ISBN: 978-989-758-104-5
Copyright
c
2015 SCITEPRESS (Science and Technology Publications, Lda.)

each image corresponds to a point in a high dimen-
sional feature space. Also, standard classification al-
gorithm can be used for global features(Lisin et al.,
2005).
There are several algorithms and methods pro-
posed for extracting features from images. Harris cor-
ner detection is a method to detect and match point
features like corners or edges(Schmid and Mohr,
1997). Canny edge detection, developed by John F.
Canny in 1986(OpenCV, ), uses a multi-stage algo-
rithm to detect a wide range of edges in images. Re-
gion and contour detectors are also methods for object
recognition. Detectors using image contours or region
boundaries, should be less likely to be disrupted by
cluttered backgrounds near object boundaries. Region
detectors are used for category recognition(Andrew
and Brady, 2004) but are not practical for a large num-
ber of images representing different categories. The
performance for object class recognition approaches
is often reported for entire methods (Berg et al., 2005;
Fergus et al., 2003). Recognizing an object can be
done by extracting these features from an image. Re-
search shows a combination of methods can be use-
ful to recognize objects in an image(S.Arivazhagan1,
2010). Feature detectors can use machine learning al-
gorithms. For instance a corner detector can create a
model and then apply it directly to the image(Rosten
et al., 2010). Lots of different machine learning algo-
rithms are used for image classification. After consid-
ering various machine learning algorithms including
Bayesian Nets, Decision Trees, Genetic Algorithms,
Nearest Neighbors and Neural Nets, J48 decision tree
is used for this work. Decision trees are popular be-
cause they are easy to understand. Rules can also be
extracted from decision trees easily.
In this work, the OpenStack Cloud Computing
platform is used. The framework contains eleven
models, each of which is assigned to a worker role in
the Cloud environment. The models are created based
on labeled objects in images. When new image data is
sent to the Cloud, each worker role creates a signature
for each object in order to recognize it. There will be
11 results for an object. The evaluation component
of our architecture, processes the results and provides
the most accurate result.
3 CLOUD-BASED DATA
ANALYSIS ARCHITECTURE
In this work, a Cloud-based data analytics framework
is proposed. It will use classification models for ob-
ject recognition utilizing machine learning methods.
Utilizing the Cloud infrastructure will provide a better
performance of smart-phones, laptops and computers
even with limited computational resource.
Analyzing large volumes of heterogeneous data
can be done by data analysis methods such as ma-
chine learning, computational mathematics, and arti-
ficial intelligence. A Cloud-based architecture is cho-
sen for this work, due to its scalability, efficiency, and
manageability. As Cloud Computing is designed for
the distributed systems with fault tolerance, it uses a
pools of resources to deploy a virtual machine. (Han
et al., 2010) presents the average cost of parallel im-
age pattern recognition tasks in Cloud, supercom-
puters and clusters and shows that the cost for run-
ning the task in the Cloud is cheaper. Virtual ma-
chine instance can be simply moved or scaled up or
down to make the best use of the hardware without
compromising performance. It significantly improves
the cost efficiency under the limitation of comput-
ing power of smart-phones, computers and etc. One
of the other advantages of a Cloud-based data anal-
ysis framework is that with a queue-based architec-
ture an asynchronous scheme is applied where worker
roles are asynchronously coupled. This means that
scaling or adding/removing instances does not af-
fect other worker roles. Furthermore, (L.S.Kmiecik,
2013) pointed out that the size of the classifier model
is independent of the size of the training data whereby
even though the training dataset is very huge the
model does not need to be very big. Huge amounts
of training data can be stored in the Cloud as backup
for future analysis.
The Cloud framework consists of four types of
queues:
• Data Queue. It is used to communicate between
the Client and the Controller Node. This queue
is considered as a general queue. When a Client
uploads data into the Blob the URL of the link is
added into the Data Queue.
• Task Queue. There is separate Task Queue for
each worker roles. The Controller reads data from
the Data Queue and assigns it into different Task
Queues.
• Model Queue. When the result of each worker
role is prepared and evaluated, it will be sent to
this queue as the evaluation result .
• Response Queue. The best result, identified ob-
ject label and its class will be in this queue for
users.
The Cloud framework also consists of four types
of worker roles. Here are the definitions of these
worker roles.
• Controller Node. This controls and manages the
incoming data and adding the new messages to the
CLOSER2015-5thInternationalConferenceonCloudComputingandServicesScience
80
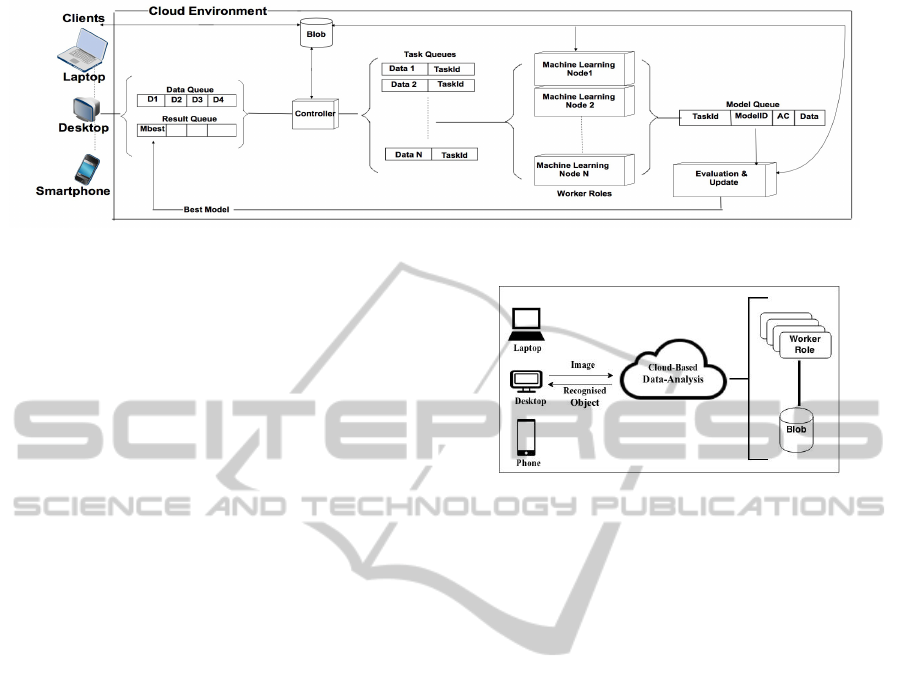
Figure 1: Structure of The Object Recognition System.
Task Queue are the main role of this queue. It also
stores the incoming data to the Blob storage.
• Machine Learning Nodes. Each of the Machine
Learning Nodes reads a message from its own
Task Queue and starts producing a model based
on a machine learning classifier with different fea-
tures. It generates a data record from the extracted
features and uses its own classifier model to iden-
tify the data’s label and class. It then submits
the data record, its label, and the accuracy to the
Model Queue.
• Evaluation Node. This worker role will check if
all models produced results. If yes, it will find the
best model. The best label satisfying the threshold
will be submitted to the result queue.
• Response Node. This worker role will show the
result to the user.
In this framework, RabbitMQ, which is a queue
service provider, is used as a messaging system be-
tween worker roles. A dedicated virtual machine is
assigned for the RabbitMQ service. Also, one vir-
tual machine is assigned for each Machine Learning
Node. Each of Controller, Evaluation, and Response
worker roles is assigned a virtual machine. They have
different responsibilities in order to finish a task.
The process of Cloud-based data analysis is il-
lustrated in Figure 1, Once the client uploads new
data, the URL of the data is collected by the Con-
troller node and assigned as different tasks to ma-
chine learning worker roles. Each of the worker roles
is designed to handle a machine-learning task. Each
machine learning classifier generates and evaluates a
model. Based on all evaluation results of all models
in the Evaluation node the best model is identified.
The best identified label and class for the recognized
object will be presented to the user by the Response
node.
In this system, a comprehensive Cloud-based data
analysis framework is developed by combining big
data analytics and Cloud Computing technologies.
This provides analysis as a service from data deliv-
Figure 2: Overview of The Object Recognition System.
ery and analysis to storage, in order to optimize data
analysis. An overview of the Cloud-based data analy-
sis framework is presented in Figure 2.
4 CASE STUDY OF OBJECT
RECOGNITION
In the case study of object recognition, a Cloud-based
architecture is designed and used. It is deployed in the
OpenStack Cloud environment. We use nine phys-
ical machines to implement our private Cloud envi-
ronment, four of them to be used for compute nodes
(Nova), one for the controller node, one for the block
storage (Cinder), one for object storage (Swift), one
for dashboard and accessing the Cloud environment
(horizon), one for neutron. The process of control
flow is shown as follows:
• Training Model:
1) Dataset is collected and manually labeled. 2)
The dataset is processed, by passing it to the
eleven machine learning. 3) Eleven models will
be created, each by a worker role. 4) Eleven mod-
els are stored.
• Testing Model:
1) User sends data to the Cloud-based Data Anal-
ysis framework. 2) Data is loaded into the frame-
work. 3) Data will be passed to each worker role.
4) Worker roles will process the data by using the
existing models. 5) The results containing labels
ACloud-basedDataAnalysisFrameworkforObjectRecognition
81

of the data and accuracy, will be prepared. 6) Re-
sults will be compared and the best model is cho-
sen. 7)The labeled data will be presented to the
user.
There is a set of features for each worker role
and classifier model. Color, Shape, and some basic
features such as Edge, Corner. There are also two
shape signature methods proposed by the authors of
this work, Ordered and Sorted Signature. Here is an
explanation of each model.
1. M1: Basic features (Edge and corner)
2. M2: Color (Three color schemes, RGB, YCbCr,
and HSV, and also the combination of all of them)
3. M3: The Ordered-Signature.
4. M4: The Sorted-Signature.
5. M5: Basic feature and Color.
6. M6: Ordered-Signature and Basic features.
7. M7: Sorted-Signature and Basic features.
8. M8: Ordered-Signature and Color features.
9. M9: Sorted-Signature and color features.
10. M10: Color, Ordered-Signature, and Basic fea-
tures.
11. M11: Color, Sorted-Signature, and Basic features.
Each of these eleven models has a different set of fea-
tures. Each worker role assigns to a model has a set
of image processing algorithms to extract the needed
features and build data for model evaluation. The data
is evaluated by a stored model of each worker role and
a label and the accuracy of its evaluation will be pre-
sented as an output. When all eleven worker roles
finish their jobs, another worker role will check all
results. It will find the best model by checking the ac-
curacy and will then send the best result back to the
user.
4.1 Data Collection
The dataset used in this paper consists of 219 leaf
images. The dataset is divided into 3 classes, type3
(Pittosporum Tobira), type14 (Betula Pendula), and
type21 (Cercis Siliquastrum). Each image is 255 by
255 pixels and in JPEG format. A total of 120 im-
ages are used as the Training set (T) and the remain-
ing 99 images as the Testing set (S). Figure 3 shows
the dataset leaf types.
Figure 3: Dataset: type3 (Pittosporum Tobira), type14 (Be-
tula Pendula), and type21 (Cercis Siliquastrum).
4.2 Feature Extraction
Image feature extraction is at the heart of this frame-
work. In this work, Four methods are used to recog-
nize an object in an image.
4.2.1 Edge Detection
Edge is an important feature and digital image
processing, edge detection is an important subject
(Nadernejad et al., 2008). The boundaries between
regions in an image are defined as edges(Nadernejad
et al., 2008). There are several algorithms to perform
edge detection. The Canny edge detector is an edge
detection operator that uses a multi-stage algorithm
to detect a wide range of edges in images. Figure 4
shows the Canny edge detection for one type of the
leaf.
Figure 4: Left Side: Original Image. Right Side: Canny
Edge Operator Applied.
4.2.2 Corner Detection
The corner is defined as a location in the image where
the local autocorrelation function has a distinct peak.
There are various methods to detect corners in com-
puter vision. Harris corner detection is used to extract
information in this work(Malik et al., 2011). Har-
ris Corner Detection is based on the autocorrelation
of image intensity values or image gradient values.
The corner features extracted by using Harris cor-
ner detector method are analyzed different values of
sigma, threshold and radius(K.Velmurugan and Ba-
boo, 2011). Figure 5 shows the Harris Corner Detec-
tion for one type of the leaf.
Figure 5: Left Side: Original Image. Right Side Harris Cor-
ner Detector Applied.
4.2.3 Shape Detection
Shape representation and description techniques can
be generally classified into two classes: contour-
based and region-based methods(Shotton, 2005).
Several methods that have been developed by past re-
searchers for the shape detection such as using gen-
eralized Hough transform (Duda and Hart, 1972),
CLOSER2015-5thInternationalConferenceonCloudComputingandServicesScience
82
and template matching(Korman et al., 2013). The
contour-based method is used as the shape detec-
tor in this work. Contour shape techniques only
exploit shape boundary information. Contour-based
approaches are more popular than region-based ap-
proaches. This is because human beings are thought
to discriminate shapes mainly by their contour fea-
tures. Another reason is because, in many of the shape
applications, the shape contour is of interest. While
the shape interior content is not important (Zhang and
Lu, 2004). The shape detection signature algorithm
has been designed and developed by the authors of
this work.
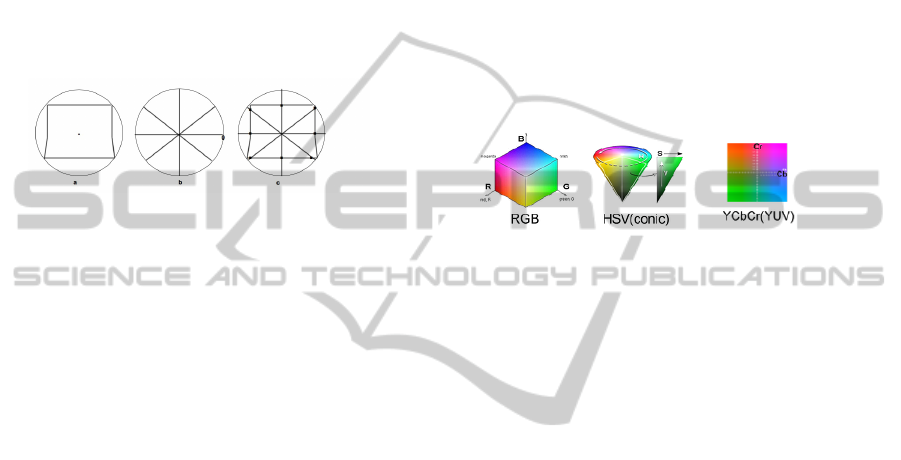
Figure 6: (a) Contour of Object, (b) Clock-wise Lines
(c)Intersection of Lines and Contour.
In figure 6, (a) contour detection is used to detect
the outer boundary of an object. Then based on the
contour, the center of the object and radius is calcu-
lated. In the mask image that is shown in (b), the
lines are drawn based on an angle step. This is the
angle between successive radius lines drawn from the
center to the boundary. For example, In Figure 6, an
angle step of 45 degree produces eight lines from the
center of the circle to the boundary. The overlap of
(a) and (b) will produce (c). From (c), the intersection
of object outer boundary and lines can be extracted.
The distance between the center of the object and
the intersections are absolute distance. Absolute dis-
tance does not work well, as it depends on scale.
However, if the absolute distance is divided by the ra-
dius of the circle, it is gives us a scale invariant num-
ber between zero to one. By using this technique, it
does not matter how small or big the object is and the
numbers produced by this technique will be the same
for any size of the same object. If the same object is
rotated, the center of the object and radius are possi-
bly different. So, our solution is to divide the absolute
distance by the longest radius distance of each object.
It gives better results for the same object with differ-
ent sizes and rotations.
Starting from the longest radius line and continu-
ing clockwise, the list of radius lengths for an object
produces a signature, called the Ordered-Signature.
Sorting this list from high to low produces an-
other signature, the Sorted-Signature. Our results
shows better shape recognition accuracy for Sorted-
Signature. These two techniques are size and rotation
invariant.
4.2.4 Color Detection
There are different color spaces in images such as
RGB, HSV, YCbCr, to distinguish an object in an
image(Patil et al., 2011). The first step in this work
was to resize the image to 256 by 256 pixels. Sec-
ond, calculating the average of each space like R,G
and B for all pixels. This process will be done
for all spaces and finally nine numbers will be pro-
duced. The next step is to get a histogram to calculate
their statistical moments (mean, std and skewness).
After applying this process we will get 27 features
of each image(3*(rgb+YCrCb+HSV component))* 3
features(mean, std, skewness value)). Figure 7 shows
the three color spaces.
Figure 7: Color Model.
4.3 Machine Learning Classifier
In this work, machine learning is used for classifica-
tion. The general idea of any feature-based method is
to first find a set of discriminative features that can
help distinguish between objects in an image, then
run a machine learning model based on those fea-
tures over a training set. Finally apply the model
to classify a new object in an image. The machine
learning classifier was trained to produce the classi-
fication model. The Weka machine-learning pack-
age(Witten and Frank, 2005) was used in this study
to develop the machine learning mechanism for the
object detection and recognition. There are various
classifier algorithms in Weka for classification such
as Naive-Bayes, Neural Network, NB-three, Decision
Tree known as J48. J48 is used because it is an open
source Java implementation of the C4.5 algorithm in
the Weka data mining tool.
5 EXPERIMENT AND RESULT
The framework requires a machine learning model
classifier for each model. There are 11 worker roles
each of which needs a model classifier in order to rec-
ognize an object in an image. The model classifier
should be trained properly. The training process is
done with 120 images for all three classes of leaf type.
Once the training process is done, 11 trained model
classifiers will be assigned to 11 Machine Learning
Nodes. In the test process, our dataset contains 99
ACloud-basedDataAnalysisFrameworkforObjectRecognition
83
images for all classes of leaf type. We start the test
process by sending 99 requests to the framework. We
discuss the model accuracy as well as the worker roles
performance below.
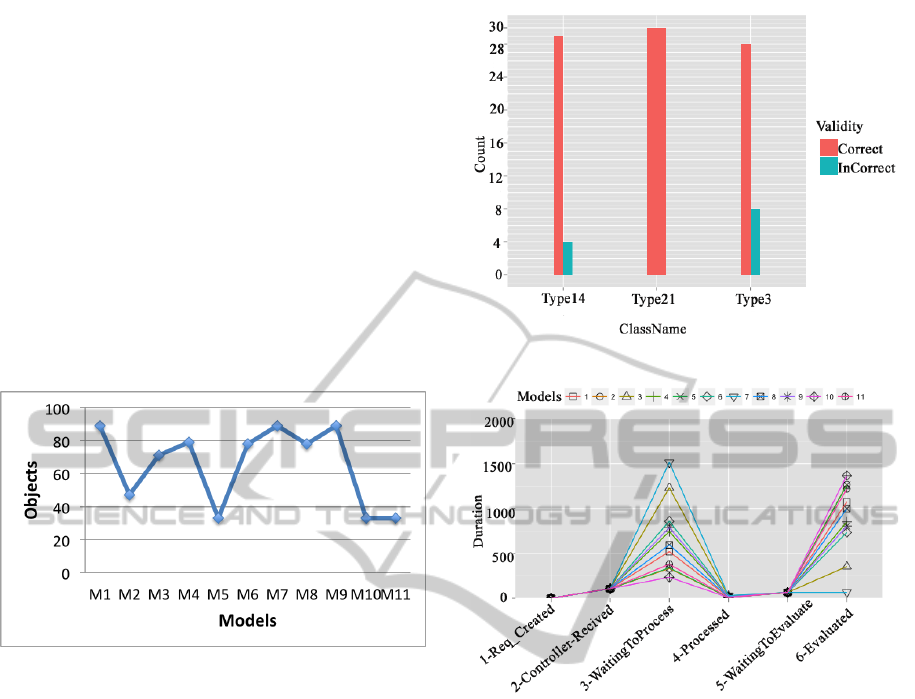
Figure 8 reports the accuracy of distinguishing ob-
jects based on their features for each model. The
result shows that the retrieval accuracy is increased
in the models that contain the Sorted-Signature fea-
ture. Three models, Basic (Corner and Edge), Sorted-
Signature and color features and Sorted-Signature and
Basic features have good performance. There are
89 images are correctly recognized by these features.
Figure 8 shows that the color model we use, does
not provide good results. Analyzing the result shows
that either the color feature or the method we used
needs to be replaced or improved. Figure 9 also
Figure 8: Model Validation: M1-Basic features M2-
Color M3-Ordered-Signature M4-Sorted-Signature M5-
Basic feature and Color M6-Ordered-Signature and Ba-
sic features M7-Sorted-Signature and Basic features M8-
Ordered-Signature and Color features M9-Sorted-Signature
and color features M10-Color, Ordered-Signature, and Ba-
sic features M11- Color, Sorted-Signature, and Basic fea-
tures.
shows the validity of object recognition for three dif-
ferent leaf classes. The accuracy of the framework
depends on the training datasets and the type of the
test images. Object recognition process flow con-
sists of Data-Created, Controller-Received, Waiting-
To-Process, Processed, and Evaluated statuses. First,
a user sends data to our framework (Data-Created).
The Controller node receives the data (Controller-
Received) and puts the data into Task Queues for
Machine Learning nodes to process (Waiting-To-
Process). After processing, the result will be sent to
the Model Queue (Processed). The evaluation node
reads all the results, evaluates them, and finds the best
result for the requested data (Evaluated). The final
result will be sent to the user in the final step. As fig-
ure 10 shows, the waiting time for processing data is
different for each model. This step is where the data
is in the queue to be processed and waiting for a com-
puting node to take and process it. The waiting time
Figure 9: Class Validation
Figure 10: Detailed Framework Performance Configuration
A.
is higher when the actual processing time for a model
is higher. It helps us to detect the models that has
higher processing time. As this is a dynamic Cloud
environment, then a controller can increase the num-
ber of compute nodes for the detected model when
it’s required. The model with Sorted-Signature fea-
ture has the highest processing time and the model
with basic features has the best. The Cloud environ-
ment provides us the opportunity to control the num-
ber of worker roles and compute nodes in order to
utilize the current nodes and add more nodes in or-
der to improve performance. This would not happen
in a local environment. Figure 11 shows our second
experiment with the same data but with the different
configuration. In this experiment, we twice the num-
ber of worker roles but not the number of compute
nodes (VMs). As it is obvious in the Figure 11, with
the new configuration we could achieve a better per-
formance as the processing time for the worst model
became one third less in comparison to the first ex-
periment. It also improve the overall performance as
the evaluation is 33% faster. An intelligent controller
CLOSER2015-5thInternationalConferenceonCloudComputingandServicesScience
84
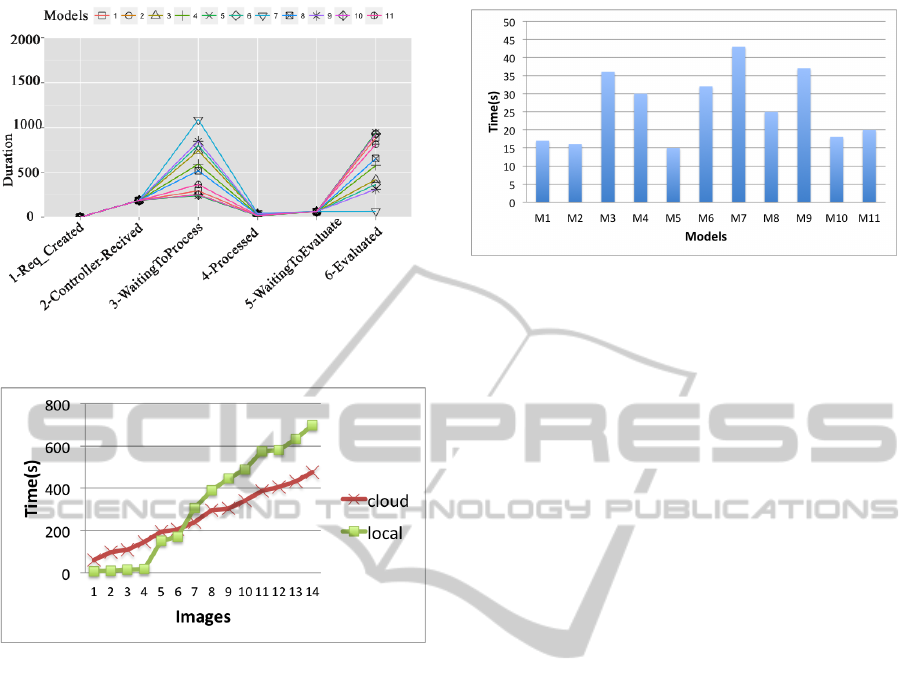
Figure 11: Detailed Framework Performance Configuration
B.
Figure 12: Processing Time In Local and Cloud Environ-
ment.
can help to make our framework providing a better
performance that is in our future work.
5.1 Processing Time Cloud Vs. Local
Comparing our framework in our private Cloud envi-
ronment with a local machine provides us an overview
of the differences between them. We could not run our
framework for more than 14 images in a local ma-
chine as the processing time was significantly high.
Figure 12 shows the difference between the local and
Cloud performance for 14 images. The local machine
for small number of data is better than a Cloud envi-
ronment. However, when we have Big Data, the local
machine is not helpful. As the figure shows, the lo-
cal machine is faster for less than 7 images, but as
the number of images are increased, the performance
is worst than our Cloud framework. The processing
time is as important as the accuracy. Figure 13 shows
the average processing time for each model. The aver-
age processing time for the models with Basic feature
and with Color feature is about 15 seconds. The mod-
els with more than one feature has a higher processing
Figure 13: Average Processing Time.
time like the model with Basic and Color features that
has an average of 35 seconds. The most significant
processing time is related to our Ordered-Signature
and Sorted-Signature algorithms that is very helpful
in the accuracy.
6 FUTURE WORK
In our future work, there will be a controller node de-
ciding to add or remove nodes to the framework, send
the request to an appropriate node, and resend a re-
quest to another node when a response for a specific
request does not show up before a threshold wait-
ing time. So in order to improve the performance
of Cloud-based data analytics, new mechanisms is
needed to be exploited to dynamically allocate system
resources for different machine learning nodes based
on the performance of each machine learning classi-
fier. There also will be a reusable mechanism for the
output of the models with one feature for reusing in
the models with multiple features in order to reduce
the processing time. It is planned to further evaluate
this work with datasets that are bigger in size, and va-
riety.
7 CONCLUSION
In this paper, we proposed a robust approach of object
recognition using hierarchical classification by com-
bining feature detection and machine learning algo-
rithms. With integration of the Cloud infrastructure,
the system provides superior scalability and availabil-
ity for data analysis and model management. The data
analysis and model evaluation are conducted remotely
in the Cloud. The experimental results show that fea-
ture detection algorithms can be done in parallel in
the Cloud to get the result in a fast efficient way.
ACloud-basedDataAnalysisFrameworkforObjectRecognition
85

REFERENCES
Andrew and Brady, M. (2004). An Affine Invariant Salient
Region Detector. In European Conference on Com-
puter Vision, pages 228–241.
Berg, A. C., Berg, T. L., and Malik, J. (2005). Shape match-
ing and object recognition using low distortion corre-
spondence. In In CVPR, pages 26–33.
Choras, R. S. (2007). Image feature extraction techniques
and their applications for cbir and biometrics systems.
International Journal of Biology and Biomedical En-
gineering.
Duda, R. O. and Hart, P. E. (1972). Use of the hough trans-
formation to detect lines and curves in pictures. Com-
mun. ACM, 15(1):11–15.
Fergus, R., Perona, P., and Zisserman, A. (2003). Ob-
ject class recognition by unsupervised scale-invariant
learning. In In CVPR, pages 264–271.
Ferzli, R. and Khalife, I. (2011). Mobile cloud comput-
ing educational tool for image/video processing algo-
rithms. In 2011 Digital Signal Processing and Sig-
nal Processing Education Meeting, DSP/SPE 2011,
pages 529–533. Affiliation: Microsoft Corp., Uni-
fied Communications Group, Redmond, WA, United
States; Affiliation: Group of Inf. and Comm. Sys.,
Scientific Park, Universitat de Valencia, Spain; Corre-
spondence Address: Ferzli, R.; Microsoft Corp., Uni-
fied Communications Group, Redmond, WA, United
States; email: rferzli@ieee.org.
Foster, I., Zhao, Y., Raicu, I., and Lu, S. (2008). Cloud
Computing and Grid Computing 360-Degree Com-
pared. 2008 Grid Computing Environments Workshop,
pages 1–10.
Han, L., Saengngam, T., and van Hemert, J. (2010). Accel-
erating data-intensive applications: a cloud comput-
ing approach image pattern recognition tasks. In The
Fourth International Conference on Advanced Engi-
neering Computing and Applications in Sciences.
Hetzel, G., Leibe, B., Levi, P., and Schiele, B. (2001). 3d
object recognition from range images using local fea-
ture histograms. In Proceedings of CVPR 2001, pages
394–399.
Korman, S., Reichman, D., Tsur, G., and Avidan, S.
(2013). Fast-match: Fast affine template matching.
In CVPR’13, pages 2331–2338.
K.Velmurugan and Baboo, L. D. S. (2011). Article: Im-
age retrieval using harris corners and histogram of ori-
ented gradients. International Journal of Computer
Applications, 24(7):6–10. Full text available.
Lisin, D. A., Mattar, M. A., Blaschko, M. B., Benfield,
M. C., and Learned-miller, E. G. (2005). Combining
local and global image features for object class recog-
nition. In In Proceedings of the IEEE CVPR Workshop
on Learning in Computer Vision and Pattern Recogni-
tion, pages 47–55.
L.S.Kmiecik (2013). Cloudcentered,smartphonebasedlong-
termhumanac- tivity recognition solution. IEEE
Transactions on Image Processing.
Malik, J., Dahiya, R., and Sainarayanan, G. (2011). Article:
Harris operator corner detection using sliding window
method. International Journal of Computer Applica-
tions, 22(1):28–37. Full text available.
Nadernejad, E., Sharifzadeh, S., and Hassanpour, H. (2008).
Edge detection techniques: Evaluations and compar-
ison. Applied Mathematical Sciences, 2(31):1507–
1520.
OpenCV. OpenCV.
Patil, N. K., Yadahalli, R. M., and Pujari, J. (2011).
Article: Comparison between hsv and ycbcr color
model color-texture based classification of the food
grains. International Journal of Computer Applica-
tions, 34(4):51–57. Full text available.
Rosten, E., Porter, R., and Drummond, T. (2010). Faster
and better: A machine learning approach to corner
detection. IEEE Trans. Pattern Anal. Mach. Intell.,
32(1):105–119.
S.Arivazhagan1, R.Newlin Shebiah1, S. N. L. (Oct 2010).
Fruit recognition using color and texture features bib-
tex. Journal of Emerging Trends in Computing and
Information Sciences.
Schmid, C. and Mohr, R. (1997). Local grayvalue invariants
for image retrieval. IEEE Trans. Pattern Anal. Mach.
Intell., 19(5):530–535.
Shotton, J. (2005). Contour-based learning for object detec-
tion. In In Proc. ICCV, pages 503–510.
Torralba, A., Murphy, K. P., and Freeman, W. T. (2010).
Using the forest to see the trees: Exploiting context
for visual object detection and localization. Commun.
ACM, 53(3):107–114.
Witten, I. H. and Frank, E. (2005). Data Mining: Practi-
cal Machine Learning Tools and Techniques, Second
Edition (Morgan Kaufmann Series in Data Manage-
ment Systems). Morgan Kaufmann Publishers Inc.,
San Francisco, CA, USA.
Yang, M.-H. (2009). Object recognition. In LIU, L. and
ZSU, M., editors, Encyclopedia of Database Systems,
pages 1936–1939. Springer US.
Zhang, D. and Lu, G. (2004). Review of shape representa-
tion and description techniques. Pattern Recognition,
37(1):1 – 19.
CLOSER2015-5thInternationalConferenceonCloudComputingandServicesScience
86
