
User Influence and Follower Metrics in a Large Twitter Dataset
Jari Veijalainen
1,2
, Alexander Semenov
1,2
and Miika Reinikainen
1
1
University of Jyvaskyla, Department of Computer Science and Information Systems,
P.O.Box 35, FI-40014, Jyvaskyla, Finland
2
University ITMO, Kronverksky Pr. 49, Saint-Petersburg, Russia
Keywords: Twitter, Social Media Mining, Retweeting, Influence, Message Diffusion, Followers.
Abstract: Social media has become an important means to convey information. The microblogging service Twitter
with about 284 million users and currently over 500 million tweets per day is an example. The site stores all
the tweets once sent so that they can be retrieved later. The site has rather simple site ontology, i.e. the
concepts it implements; the users are represented by a profile. They can follow other users, and a received
tweet can be retweeted to all the followers of a user. In this paper we investigate diffusion of messages and
influence of users on other users, mainly based on the retweet cascade size and attenuation patterns inside
the cascade. We rely on a big data set collected after Boston marathon bombing on April 15, 2013. It
contains about 8 million tweets and retweets sent by over 4 million different users. It was collected through
the Twitter API that selects all the messages containing given keywords, including hashtags. We also
collected all 7-8 billion followers of the above users during 2014. The follower relation is also used in
influence estimations in some respects. The largest cascades originate from users with most followers and
the cascade dies out after two or three frequency peaks.
1 INTRODUCTION
There are hundreds of social media sites in the
world. The number of Facebook users has exceeded
one billion and there are other sites that have tens or
hundreds of millions of users. According to English
Wikipedia, the Chinese microblogging service Sina
Weibo (weibo.com) has currently over 500 million
users, Vkontakte (vk.com) ca. 270 million users, and
LiveJournal had in 2012 ca. 40 million accounts.
The latter two are mainly based in Russia and
controlled by Russian citizens and companies.
There are many more social media sites created
for different purposes, but in this paper we are
concentrating on Twitter, the microblogging service
originating from San Francisco, California. It has
currently 284 million users all over the world and
500 messages (tweets) are sent per day. 80 % of the
users are using mobile devices and 77 % of the users
are living outside the USA. The site supports over
35 different languages. (“About Twitter, Inc. |
About” 2014).
The core concepts Twitter implements in its site
ontology are simple. A human user has a profile (or
account) representing the real user on the site. It is
identified by a (locally) unique screen name of form
@<string>, chosen by the user while registering –
unless altered later. Internally, the site has a locally
unique numeric user_id. It is essentially an integer
for each user that does not change as long as the
account exists (in our data set the smallest user_id is
12, the largest one is 1364151169). A user can send
140 character long messages called tweets and also
send a tweet further to other users. This is called
retweet(ing) and retweets are indicated to the
recipents by “X retweeted” at the beginning of the
message in the user interface. A user can follow
other users. After that, the user can get the public
tweets or retweets sent by the user to be followed. A
user can select a setting on his or her profile that
allows the tweets to be protected. In this case he or
she can select the followers by issuing a separate
confirmation for each user wanting to follow him or
her. The search engine offered by the site to find
tweets and user profiles to be reviewd or to be
followed. In addtion to text, the users can include
digital photos, URIs or screen name into tweets. The
URIs usually refer to web sites that contain longer
articles or videos about the theme the user wants to
convey to others.
The site is location-aware. It means that the
user’s location can be included into the tweet if the
487
Veijalainen J., Semenov A. and Reinikainen M..
User Influence and Follower Metrics in a Large Twitter Dataset.
DOI: 10.5220/0005410004870497
In Proceedings of the 11th International Conference on Web Information Systems and Technologies (WEBIST-2015), pages 487-497
ISBN: 978-989-758-106-9
Copyright
c
2015 SCITEPRESS (Science and Technology Publications, Lda.)

user has allowed it in the privacy settings. Location
is obtainable as part of the metadata of each
message through the Application Programming
Intefaces (API). A message retrieved through the
API contains further information, such as the actual
(re)tweeted text, retweet flag, the number of
followers, and friends, the user-id/screenname of the
user, time stamp of the tweet (in two formats), used
language, and further information. These can be
used while analysing the temporal and spatial user
behavior, contents transformations, and so on.
The site offers several APIs though which the
user-generated and stored contents, as well as the
followers of a user on the site can be retrieved –
unless the user has indicated in the privacy settings
his or her tweets to be protected. In this case neither
the (re)tweets nor the followers can be retrieved. We
will discuss in a more detail below the APIs we have
used in this study.
2 RELATED WORK
The social media related research has increased
rapidly during the last three to four years. Currently,
for instance Google scholar returns over 15000
articles that contain “social media” in their title,
keyword list, or abstract since 2005. The literature
concerning Twitter analysis is also already
substantial. Therefore, we only concentrate on
major papers that deal with influence analysis in
Twitter.
2.1 Twitter Influence Metrics in the
Literature
A general overview of influence measures in various
social networks can be found in (Sun and Tang
2011). Some approaches, like measuring the strength
of the ties based on the size of the intersection of
follower and followee sets of users might be
interesting in predicting the tweeting behaviour of
users. This requires, however, the collection of
those sets and their analysis. To the best of our
knowledge this has not been done for Twitter users
yet in larger scale. The influence measures have so
far been based mainly on collected tweet sets.
There are several ways to look at influence in
Twitter based on tweets. The first obvious fact is
that if a user never creates and sends a tweet or
retweets tweets he or she receives from other users,
such a user does not influence others in that Twitter
stream. Any reasonable influence measure
Inf(X,Stream)->R should attach a small value, even
zero, for such users X in the Stream. One must still
take into account that in most cases an influence
measure is calculated based on a finite stream of
messages, Stream, captured during a few days,
weeks or months. Which particular users are the
most influential ones during that period of time can
greatly vary and one cannot necessarily generalize
the results to the future or past tweet streams.
A property that a reasonable influence measure
Inf(X, Stream) should measure is “how many other
users received a tweet originally sent by user X in
Stream?”. Intuitively, the more users received the
tweet directly or retweeted, the more the user had
influence on others. It is evident that the more a user
has followers the more potential influence he or she
has. This is because any (re)tweet the user sends is
received and hopefully read by a large number of
people. Further, the more followers the user has the
larger absolute potential the tweet also has to
become retweeted, and so on. The maximum number
of people that potentially received the tweet, either
directly from the user who created it or retweeted by
followers, can be calculated directly from the tweets
in the stream, because the metadata in the message
obtained through the Twitter API contains the
number of followers of the user.
The cast size, i.e. the number users who received
a tweet as retweeted can be used as a separate
measure for the perceived importance of the original
tweet, and thus for the influence of the originating or
“seed” user.
Thus, a rudimentary influence measure for user
X in a particular Stream can be defined as follows
Infr(X,Stream) = p1*Mx*Fx+
+p2*RTm1+..+pmx*RTmMx, where
Mx = number of seed tweets sent by X,
Fx = number of followers of X
RTmi = Fmk1+Fmk2+Fmki is the combined number
of followers of those users Xmk1..Xmki who
retweeted message mi, 0< i < Mx+1, i.e. it is the
potential receiver set size of message mi with cast
size ki. Each 0<=pi<=1 is an adjustment coefficient
(see below) that tells which fraction of followers are
passive or addressed several times. Setting pi=1 for
all i, the overall measure sums up the potential
receiver set sizes for all seed tweets of user X.
The rudimentary measure above tries to answer
the question how many users got the tweet initiated
by X, but overestimates the influence of X in the
sense that the follower sets of different users are
usually overlapping. Thus, the set of different users
who received the tweet is in reality smaller, as some
users can receive the retweeted message several
times from different users they follow. Further, not
WEBIST2015-11thInternationalConferenceonWebInformationSystemsandTechnologies
488

all users even read the tweet (sender might be even
muted), not to speak about retweeting. Therefore, pi
<1 usually holds. The minimum value is obtained by
calculating the fraction of followers that retweeted a
tweet in the chain. An upper bound for a particular
pi is obtained by calculating
pi= |Fx U Fmk1 U Fmk2.. U Fmki|/RTmi, i.e.
removing the effect of common followers.
Calculating the coefficients pi requires collection
of followers of all those users who tweeted or
retweeted something in a Stream.
A further idea to measure the influence of a user
is to count the mentions of that user in other user’s
tweets or retweets. Intuitively, the more mentions
the user gathers in the data set, the more influence he
or she has in the community. This can also be
calculated directly from a Stream in one pass. The
above rudimentary measure can be enhanced by this
aspect in various ways. An obvious one is to add for
each such tweet issued by user Y, mY, a term RTmk
to the cast count of X, as if the mention was a
retweet of a seed tweet of X.
Tweets can contain URLs that refer to web
sources. One can also measure how many receivers
click the ULRs in the tweets. The click confirms that
the receiver reacted to the tweet and presumably
accessed the contents pointed by the URL. One can
also measure how the presence of URLs and
hashtags in tweets influence the retweeting activity.
This is measured by the cast size RTmi above and
correlations with it and the tweet content can be
established (see below)
A further idea is to measure the development of
the potential influence of certain user X over time.
Intuitively, if user X had a year ago 10 followers and
now 10000 followers, the potential influence of that
user is now intuitively at least 1000 times higher
than a year ago. Calculating the measure can be
based on the follower numbers at certain points of
time obtained from a suitably large tweet set
(spanning a year) or accessing the data through a
suitable Twitter API or both.
The above basic ideas have been applied in
various forms and combinations in the literature.
There are also further orthogonal ideas. We discuss
both of them below shortly. A study made about
four years ago (Bakshy et al. 2011) investigated the
cascade size in a data set of 1.6M Twitter users
contributing to 74 million diffusion events. One
finding was that it is not clear how to identify the
influencers that would most probably spread the
tweets further. The authors ponder extensively what
kind of marketing strategies could be developed
based on the Twitter users that mostly “influence”
other users. The authors use as the influence
measure the size of the cascade, that is, the number
of retweets of the original message, but do not take
into account the follower numbers of retweeters.
They also measure the depth of the cascade, that is,
how many users there are on the longest path where
the same (re)tweet was retweeted. The observed
maximum depth was 9. The current Twitter API 1.1
does not allow this measure to be computed.
Korean researchers (Kwon and Han 2013)
investigated in their article how content
dissemination from the web sites (see above URLs)
other than Twitter itself influences the cascade size
of the Tweets. They concentrated on tweets in
Korean language. The authors write: “Source
influence and peer-referrals have a positive impact
on cascade size in the content dissemination. In the
case of contents crossover the impact of source
influence decreases. However, the impact of peer-
referrals increases in external content
dissemination.
In (Suh et al. 2010) the authors wanted to
understand why certain tweets spread more widely
than others by investigating the features of tweets
that have a potential for retweetability. The study
draws on 74 million individual tweets. According to
the study, URL´s and hashtags amongst content
features, have strong correlation with retweetability.
Among the contextual features, the number of
followers and followees also affect retweetability.
The study (Galuba et al. 2010) examined the
information propagation laws in a 300 hour data set
containing 15 million tweets and 2.7 million users.
A propagation model was proposed to predict power
laws in user activity and predicting the hops of
cascades into sub cascades. An information
propagation model predicting which users are likely
to mention which URLs was also proposed. Findings
were that the user activity and the frequency of URL
mentions are distributed according to power-law.
Also so-called “power user’s” URLs were tweeted
more than others because those users had many
followers and the tweets they contributed tend to be
interesting and viral. The authors also write: “The
URL cascades were shallow with exponentially
falling off height. They are composed of sub
cascades whose both number and size follow power-
law distributions.”
Information diffusion has been studied in (Hui et
al. 2012) by using tweets from an actual crisis
events. The focus was to show how tweets spread
among the users on Twitter including observations
about the users involved and information cascades.
In (Cha et al. 2010) the authors compared three
UserInfluenceandFollowerMetricsinaLargeTwitterDataset
489

different measures of influence: indegree, retweets
and mentions. The authors collected data over a
period of 8 months and investigated the degree of
influence among the users over this time period from
different perspectives. It varied over time. Perhaps
the most interesting finding was that gaining
influence is not accidental, but requires targeted
effort from the users.
The study by (Romero et al. 2011) took into
account the passivity of the followers while
determining the influence; The authors state “Our
influence measure utilizes both the structural
properties of the network as well as the diffusion
behaviour among users. The influence of a user thus
depends not only on the size of the influenced
audience, but also on their passivity.” The authors
observe that their measure predicts well the URL
clicking activity of the users receiving the tweets.
Another set of model sexists for measuring user
influence. An algorithm called TwitterRank was
proposed in (Weng et al. 2010) for measuring the
user influence taking both topical similarity between
users and the link structure into account. The latter
measures the reciprocal follower relationship among
Twitter users. In the data set of the authors roughly
80 % of the users followed each other. This is
explained by homophily. The data set consisted of
about 1 million tweets gathered in 2009.
In (Yang and Leskovec 2010) a linear influence
model was proposed to measure information
diffusion and influence of nodes in Twitter. The data
set included 500 million tweets and a set of 170
million news media articles. One of the main
observations was that the users with the most
followers were not the most influential in terms of
tweet propagation.
2.2 Further Metrics of Relevance
A recent article (Bruns and Stieglitz 2013) discusses
methodical issues that are of relevance here, because
we have used a very similar approach while
collecting our data set, namely the keyword-based
API. Our aims in the research are also somewhat
similar as those of the authors, i.e. to investigate the
activity of various users in the data set over time and
their influence in the discussions. The messages in
our data set were collected using mostly hashtags
that tie together the messages in the overall stream,
although our keywords (Boston and bombing) did
not contain the #-sign. What the authors say about
the completeness of the data set is relevant also in
our case. We only collected one data set over a
period of time of ca. 5 days in April 2013, and not
many in parallel. Therefore, we cannot be fully sure
that the Twitter API returned all the matching
tweets. On the other hand, in our case this is not
very essential, because the data set is large and we
are interested in influence and diffusion.
The article above has many metrics we can use
directly in our research. User activity metrics tell
how active a particular user has been in generating
tweets and retweets during the observation period.
Visibility metrics measures the number of mentions,
replies and retweets received by a particular user.
Temporal metrics measure the distribution of user
activity over time, e.g. tweets, retweets etc. per
every minute/15 minutes/hour during the
observation period.
Another recent and relevant article is (da Cruz
and Menezes 2015) where the authors have
measured the influence of non-famous users. They
also introduced essentially the metrics discussed
above that takes into account the number of
followers of the user, the number of tweets created
by the user and the number of retweets those tweets
gained, i.e. the cascade size (see above).
Whereas the previous approaches primarily
measure the influence a user had in the past in a
dataset, the authors of (Cheng et al. 2014)
investigate to which extent it is possible to predict
the final cascade size and thus influence of certain
users. To develop and test their approach the authors
have used a complete photo-resharing data from
Facebook over a month. Their results seem
promising for this kind of contents and Facebook
platform, but to which extent they can be
generalized to tweets in Twitter and further
platforms and contents hosted by them remains to
be seen.
3 DATA COLLECTION AND
METHODS
The original data collection was started on April 15,
2013 about an hour after the news from the Boston
bombing was spread throughout the world. It
continued ca. 5 days. The data was collected using
the Twitter Rest API operational during the above
period of time that accepts keywords as parameters.
The keywords used were “Boston”, and “bombing”
No hash-tag sign # was used in keywords.
The data set is a set of ca. 8 million messages
stored into a PostgreSQL database originally in
JSON format. From these messages different users
were picked up and their screen name and user_id
stored into another database table, along with a
WEBIST2015-11thInternationalConferenceonWebInformationSystemsandTechnologies
490

running internal identifier, and number of friends.
There are ca. 4150000 different users in the data set.
In April 2014 we started a collection of the
follower relation, in order to investigate the
networking of the users and the spreading density of
the retweets among the followers. The collection
was idle during July-October 2014 and was
continued in November-December 2014. We have
used the Tweepy software package
(https://pypi.python.org/pypi/tweepy) as part of our
collection software.
The collector software is a Python program with
about 150 lines of code. It is designed to run in
parallel with itself and about 100 copies were in
operation simultaneously on a virtual cloud server.
The collection is fragile in the sense that the
collector processes can crash for various reasons.
The collector crashes cause the problem that there
might be partially collected follower data in the
result relation. In this case the collector must be
restarted and it recollects the followers once
collected already. This is unavoidable, because the
Twitter API does not offer recovery features. The
collector crash problem is aggravated by the fact that
if the user has e.g. 10 million followers, it takes at
least 33 hours to collect them. Evidently, the
probability of a crash of the collector is the higher
the longer it takes to collect the followers of one
user.
Another issue is that not all users get their
followers collected. There can be several reasons for
this, but the most common is that the user has set on
the flag protected (see above) on his or her account.
Thus, there is a substantial hole in the follower data,
as up to 15% of the users do not expose their
followers.
As mentioned above, the follower collection has
been made over a year after the original message
data set was collected. This means that most
probably the followers the users in the data set had
back in April-July 2013 are not the same as those in
April- December 2014. They also differ from the
follower numbers recorded to the metadata of the
tweets from April 2013. For instance Justin Bieber
had on April 15, 2013 about 38 million followers
and in December 2014 about 58 million.
4 THE MAIN RESULTS
In this section we report the main results of the
analysis. We first report some average numbers and
follower distributions. We then treat the answers to
the actual research questions.
4.1 Main Characteristics of the Data
Set
The average numbers of followers in a subset
consisting of randomly selected 1820000 users is ca.
2060 users. There are 14 users that have more than
10 million followers (see Table 1). Those with an
exact follower count were collected in December
2014 by our software. The others were collected in
the summer 2014, but because the follower number
was considerably smaller than the real one in
December, it was corrected manually to this paper
by visiting the Twitter profile of the users. We see
that one of entities with most followers is New York
times and the other one BBC World Breaking News.
SportsCenter is a business entity, TheEllenShow is a
TV show hosted by Ellen DeGeneres, and MTV is a
TV channel. The rest are individuals, like Selena
Gomez, a singer and actress. Mohamad bin Abdul
Rahman al-Arefe is a Saudi-Arabian imam, and Neil
Patrick Harris (ActuallyNPH) is another actor,
producer, director, and magician. Finally Justin
Bieber (justinbieber), a famous celebrity was also
included into our data set, along Alecia Beth Moore
(Pink), Alejandro Sanz (AlejandroSanz), Lil Wayne
(LilTunechi), Kimberly Kardashian West
(KimKardashian), and Alicia Keys (aliciakeys).
According to http://twitaholic.com/top100/followers
the person with most followers in Twitter was Katy
Perry with about 62 million followers in Dec. 2014
and the second was Justin Bieber with ca. 58 million
followers, just barely above president Obama. From
the profile of BBC Breaking News one sees that
after the exact collection of the followers a few days
earlier in December 2014 the follower count has
increased by about 100000 followers.
Table 1: The users with over 10 million followers.
Twitter_id #of followers Twitter_name
807095 14188280 nytimes
23375688 25000000 selenagomez
90420314 11800000 ActuallyNPH
219255067 10300000 MohamadAlarefe
5402612 12249051 BBCBreaking
27260086 58000000 justinbieber
35094637 20600000 aliciakeys
15846407 36800000 TheEllenShow
26257166 12350924 SportsCenter
25365536 27000000 KimKardashian
43152482 11885524 AlejandroSanz
116362700 20000000 LilTunechi
28706024 25000000 Pink
2367911 11695294 MTV
UserInfluenceandFollowerMetricsinaLargeTwitterDataset
491
As is to be expected in a social network, the
distribution of the number of followers is heavily
skewed also in our data set. Figure 1 shows that
many users only have one follower, and a really few
have more than thousand followers. The average
number of followers is ca. 2130, but the median is
around 280 in the collected data set (in 2014).
Overall ca. 62 % of the users in the data set have
more than 100 but less than 1000 followers and ca.
18 % has between 10 and 100 followers, that is, ca.
80 % have between 10 and 1000 followers and ca.
98 % of the users have between 0 and 10000
followers. Figure 1 shows the follower numbers.
4.2 Main Characteristics of the Tweet
Set
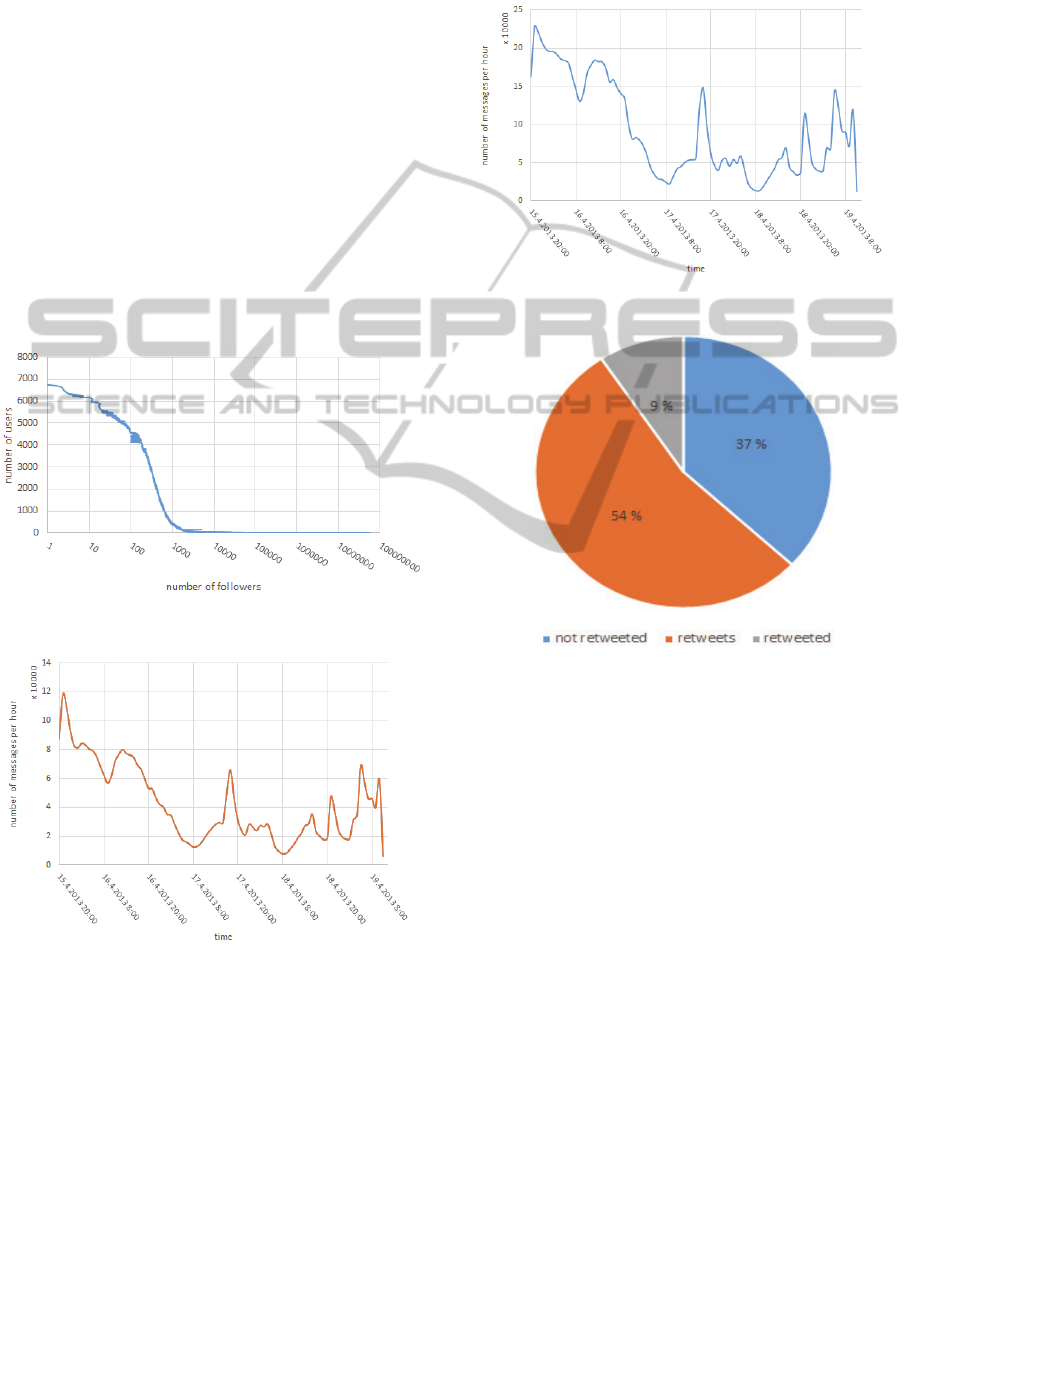
In total, dataset contains 8090803 tweets. Of these,
4347107 are retweets, and 3743696 are not.
Figure 1: The followers’ distribution.
Figure 2: Twitter message frequency, without retweets.
754548 original messages (ca. 9 %) were retweeted
at least once, thus about 37% were never retweeted,
see figure 4. The first collected message in our data
set was posted to Twitter at 2013-04-15 20:17:18
UTC. As some of the collected messages are
retweets of earlier messages, there are 20691
message having timestamp earlier than 2013-04-15
20:17:18 UTC. Minimal timestamp equals to 2009-
04-21 17:52:57 UTC. Figures 2 and 3 show
messages frequency.
Figure 3: Twitter messages frequency, including retweets.
Figure 4: Tweets and retweets.
The latest timestamp in the present collection equals
to 2013-04-19 11:04:29 UTC. In average, there were
91706 messages per hour. The number of tweets per
hour during April 15 in our data set was at most a
few ten before the bomb explosions. The number of
tweets exploded after that to over 10000 tweets per
hour after18:49 UTC. Table 2 shows the messages
with timestamps around 18:49. So, the first message
in our dataset, related to the bombing was posted at
18:52:56.
Table 3 shows the mostly retweeted tweets,
screen name of the user who sent the seed tweet, the
number of retweets and the number of followers of
the user. Although many of the users who sent these
10 tweets have a large number of followers, there is
no clear correlation between the number of followers
and retweets. For example, the 4
th
tweet is posted by
a user having 5783 followers, but it was retweeted
32349 times. 72539 of Justin Biebers followers
WEBIST2015-11thInternationalConferenceonWebInformationSystemsandTechnologies
492
retweeted the #PrayForBoston, yielding min pjb
=0.2 % for the passivity coefficient.
Table 2: Messages posted as the 1
st
bomb exploded.
time Text
18:48:59
Globe photographer helps out at BOSTON
MARATHON at the finish line
http://t.co/mLYkfhT9HR
18:49:32
@rhettypants awesome to see you guys in
Boston today!! http://t.co/UEQtWho3mA
18:49:48
Get your tickets for #MMN13 in Boston on
the @FilmmakersColl website!:
http://t.co/P568KAJ65F
18:51:20
Foursquare CEO @dens is in the last mile of
the Boston Marathon. Now'd be a good time
to send a tweet and cheer him on!
18:52:56
Just reported in the media room at hotel in
Boston is locked down. Unconfirmed but 2
bombs reported at Boston finish line
#bostonmarathon
18:53:30
Boston College Football Recruiting: Thaddius
Smith Commits To Boston College
http://t.co/e0oz8atNPo
18:53:40
Big ups to our girl @RunningMocki for
rockin' the Boston Marathon today with a
finishing time of 2:30:08 #runpumarun
18:54:19
Kids need STEM inspiration...US ranks 47 /
144 countries for quality of math and science
education http://t.co/0HTZQlrdO6 via
@BostonBizNews
18:55:13
Just heard that bombs went off at #boston
marathon finish line http://t.co/qQPgWnqvvO
18:55:14 SECOND BOMB EXPLOSION IN BOSTON
18:55:41
I'm in Boston, what was that explosion sound
though?
18:56:05
MCI: 20-30 people injured in front of Boston
Public Library after explosion at finish line of
Boston Marathon
Table 3: Mostly retweeted messages.
metadata message text
04-16 00:40:54 by
j
ustinbieber retweeted
89337 times.
37761012 followers
#PrayForBoston
04-16 00:26:24 by
Louis_Tomlinson
retweeted 49830
times. 10087488
followers
My thoughts go out to anyone
affected in Boston! Terrible news
04-15 23:01:50 by
Harry_Styles
retweeted 46399
times. 12339585
followers
Just heard the news. So terribly
sad. thoughts with everyone in
Boston .x
Table 3: Mostly retweeted messages (cont.).
04-15 23:41:10 by
HopeForBoston
retweeted 32349
times. 5783 followers
R.I.P. to the 8 year-old girl who
died in Boston's explosions, while
running for the Sandy Hook kids.
#prayforboston
http://t.co/WhaaTG3nSP
04-16 04:46:25 by
DannyAmendola
retweeted 26124
times. 46490 followers
I will DONATE $100 for EVERY
pass I catch next season to
whatever "Boston Marathon Relie
f
Fund" there is. And $200 for any
dropped pass.
04-16 01:25:32 by
ddlovato retweeted
24771 times.
13300606 followers
#prayforboston
04-15 20:29:26 by
BostonMarathons
retweeted 24265 times
1442 followers
For each RT this gets, $1 will be
donated to the victims of the
Boston Marathon Explosions.
#DonateToBoston
04-16 07:52:38 by
taylorswift13
retweeted 23301
times. 26488941
followers
Sending all of my love to Boston
after a day of sadness and
confusion and not knowing what
to say. I just don't understand.
04-15 20:57:37 by
NBCSN retweeted
19775 times. 74360
followers
Reports of Marathon Runners that
crossed finish line and continued
to run to Mass General Hospital to
give blood to victims
#PrayforBoston
04-15 21:19:58 by
LeeEvans_Comedy
retweeted 17307
times. 3313 followers
For every retweet I will donate £2
to the Boston marathon tragedy!
R.I.P!
Figure 5: Tweet #1 retweets.
Figure 5 displays the number of retweets of mostly
retweeted tweet (#1) over time. Figures 6 – 9 display
retweets over time for tweets #2 – 5 respectively.
Solid line plots denote the number of retweets per 1
hour, and the dotted line denote maximal number of
followers among the users who retweeted the
message within 1 hour. For the tweets 1-3 the
number of retweets decreases with time.
UserInfluenceandFollowerMetricsinaLargeTwitterDataset
493
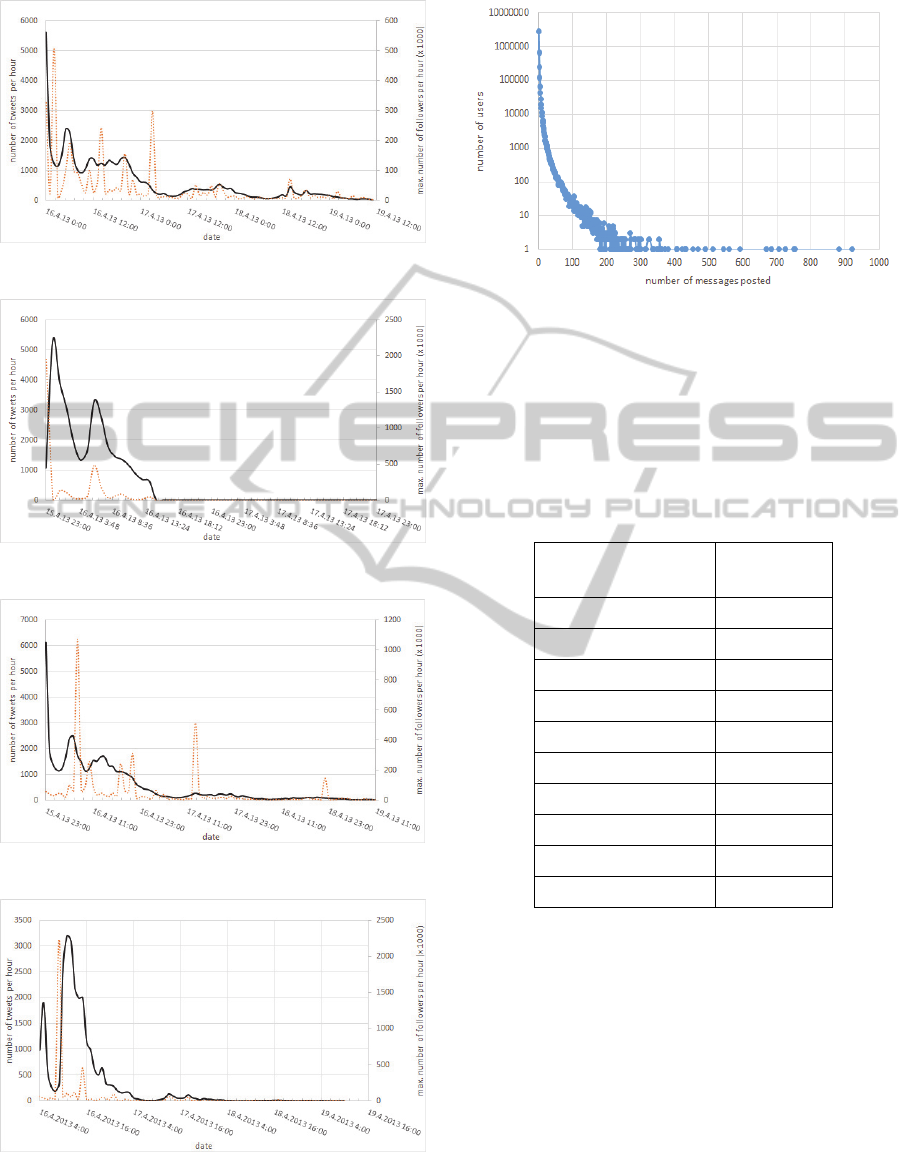
Figure 6: Tweet #2 retweets.
Figure 7: Tweet #3 retweets.
Figure 8: Tweet #4 retweets.
Figure 9: Tweet #5 retweets.
Figure 10: Number of messages per user.
However, for the 4
th
and the 5
th
tweet the number of
retweets grows soon after the seed was posted.
Dotted line shows that soon after the posting of the
tweets 3 and 4, they were retweeted by users having
a large number of followers, (about 15M, and 20M,
respectively).
Table 4: rudimentary cascade size, most retweeted users.
screenname
cascade
size
justinbieber 96113792
Louis_Tomlinson 45776854
Harry_Styles 42972525
ddlovato 31805789
taylorswift13 19769536
NBCSN 19295155
HopeForBoston 13453267
DannyAmendola 11243627
BostonMarathons 7281107
LeeEvans_Comedy 4793748
Next, we compute cascade size metric: we define the
cascade size as the sum of followers of the users,
who retweeted the message. Motivation behind this
measure is to compute upper limit for how many
people could potentially see the retweeted message.
Table 4 shows cascade for the most retweeted
messages, and table 5 shows the cascade size for the
whole data set. There are differences in the cascade
sizes for the tweets: the most retweeted tweets do
not necessarily have the highest cascade size times.
WEBIST2015-11thInternationalConferenceonWebInformationSystemsandTechnologies
494
Table 5: cascade size per message, total.
screenname
cascade
size
justinbieber 96113792
Louis_Tomlinson 45776854
Harry_Styles 42972525
ddlovato 31805789
selenagomez 23270644
Noticias_CNN 22689973
Noticias_CNN 22010346
Noticias_CNN 21341832
taylorswift13 19769536
CNNMobile 19694694
Figure 11: Cascade size distribution.
Figure 11 shows total cascade size: majority of the
messages have cascade size less than 10000.
5 CONCLUSIONS
We have investigated in this article influence of
Twitter users on each other. We defined a
rudimentary influence measure that calculates how
many users could potentially get the tweets a
particular user has issued, either directly or
retweeted. We apply this to a Twitter data set
collected after the Boston marathon bomb attack on
April 15, 2013. This data set was collected before
the name of the perpetrators, Tsarnaev, was released
and the collection ended on April 19, 2013. We
investigate the cascade size of retweets in this
message set and the distribution of the retweets over
time. As is known also from the earlier research, a
maximum time a tweet is retweeted is not long. In
our case the most frequently retweeted tweets died
out during the 5 days the collection was done.
Interestingly, the observed retweeting activity has
two or three peaks. Although a plausible explanation
is that people read the next day (on their time zone)
their twitter messages and decided to retweet, this
phenomenon requires further study. We also
investigated the follower network structure of the
users. The median in a large subset of the data set
was 280 followers, whereas the average number of
followers was ca. 2000. There were 14 users that had
more than 10 million followers and these have
intuitively the largest influence in terms of the users
reached. Our measure also shows this. The mostly
retweeted tweet was sent by justinbieber (Justin
Bieber) who had on April 15, 2013 roughly 38
million followers and in Dec. 2014 ca. 58 million
followers.
We defined to influence measure correction
coefficients that will make the number of users a
tweet reaches more realistic. One obvious reason is
that the follower sets of two users are often
overlapping and thus the real number of users
reached is smaller than the sum of sizes of the
follower sets. The calculation based on the follower
set sizes versus their union’s size gives a real
maximum value for the reached people. The
minimum value for the correction coefficient is the
percentage of the followers who retweeted the tweet.
Our follower data collection showed that it is
quite a time consuming process for such a large data
set as this. The follower collection also revealed that
the follower relation can change rather fast over
time. According to the metadata in the April 2013
messages Justin Bieber had ca. 38 million followers
at that point of time compared to the 62M as of now,
and TheEllenShow had ca. 18M followers in April
2013, compared to 37M in December 2014. How the
follower count of the “average users” with 100 to
1000 followers has developed should be analyzed
further. The same holds for the behavior of the
majority of the users. The follower counts in the
data set show a typical phenomenon in dynamic
networks based on human behavior. The average
number of followers of a user is almost ten times
larger (ca. 2000) than the median (ca. 280). In our
data set 14 users had more than 10 million followers,
and less than 100000 had between 1 and 10
followers. Those with the most followers are
businesses or celebrities. 98 % of the users we could
collect the followers for had less than 10000
followers. For over 10 % of users the followers
could not be collected.
In terms of influences, this means that a user
with a median number of followers who have a
median number of followers can expect a tweet to
UserInfluenceandFollowerMetricsinaLargeTwitterDataset
495

reach a small number of users. We measured the
cascade size and indeed, most of the cascades reach
less than 100 users. Only about 100 cascades in the
data set reach 1000 users, and less than 10 over 10
million users.
Using this measure the most influential users
were those with over 10 million followers, like
Justin Bieber, Louis Tomlinson, and Selena Gomez.
An interesting exception is a user who only had a
few thousand followers, but two of the followers had
many more and the latter’s retweet helped the tweet
to reach millions of further users.
It is for further study, which users were the most
influential among the “average users”, using e.g. the
measure that relates the number of original messages
and retweets to the number of followers of the user.
Mentions could also be calculated, but this is also
for further study.
We also checked how many followers of Justin
Bieber (as of Dec. 2014) could be found in our
original data set. There were about 554000 of them,
i.e. 13 % of 4.15 million. This is slightly less than 1
% of 58 million. We used this subset to calculate
some values for the correction coefficient maximum,
because we have collected the actual follower sets
for those followers of Justin Bieber. In the
calculation we used a subset of about 1.6 billion
rows of the entire table with 7-8 billion rows. For the
point values (exactly 1,2,3, 50,100, 200, 300, 400
followers) pi would be 0.91-0.95, i.e. the overlap is
small. For the range of 200-400 pi drops to 0.76.
For those followers of Justin Bieber who retweeted
his message the coefficient dropped to 0.36 in our
data, meaning a strong overlap in their followers
In the future we will investigate further how
much the rudimentary influence measure we used in
this study overestimates the influence. Another issue
is the passivity of the users. In the current Twitter
user interface it is possible to mute and unmute
another user. It means that once the muted status is
on, the follower is still a follower, but it does not get
the tweets of the muted user. One can argue that a
lot of tweets issuing users might become muted.
ACKNOWLEDGEMENTS
The research of the first two authors was partially
supported by the Academy of Finland grant #268078
"Mining social media sites" (MineSocMed). The
support of University ITMO is also appreciated.
REFERENCES
“About Twitter, Inc. | About.” 2014. Twitter About.
Accessed December 8. https://about.twitter.com/
company.
Bakshy, Eytan, Jake M. Hofman, Winter A. Mason, and
Duncan J. Watts. 2011. “Everyone’s an Influencer:
Quantifying Influence on Twitter.” In Proceedings of
the Fourth ACM International Conference on Web
Search and Data Mining, 65–74. WSDM ’11. New
York, NY, USA: ACM. doi:10.1145/1935826.
1935845.
Bruns, Axel, and Stefan Stieglitz. 2013. “Towards More
Systematic Twitter Analysis: Metrics for Tweeting
Activities.” International Journal of Social Research
Methodology 16 (2): 91–108. doi:10.1080/13645579.
2012.756095.
Cha, Meeyoung, Hamed Haddadi, Fabrıcio Benevenuto,
and Krishna P. Gummadi. 2010. “Measuring User
Influence in Twitter: The Million Follower Fallacy.”
http://www.mpi-
soft.mpg.de/~gummadi/papers/icwsm2010_cha.pdf.
Cheng, Justin, Lada Adamic, P. Alex Dow, Jon Michael
Kleinberg, and Jure Leskovec. 2014. “Can Cascades
Be Predicted?” In Proceedings of the 23rd
International Conference on World Wide Web, 925–
36. WWW ’14. New York, NY, USA: ACM.
doi:10.1145/2566486.2567997.
Da Cruz, Josemar Faustino, and Ronaldo Menezes. 2015.
“Characterizing the Importance of Non-Famous Users
in Information Spread in Social Networks.” Accessed
January 6. http://my.fit.edu/~cruzj2012/wordpress/wp-
content/uploads/2014/11/source.pdf.
Galuba, Wojciech, Karl Aberer, Dipanjan Chakraborty,
Zoran Despotovic, and Wolfgang Kellerer. 2010.
“Outtweeting the Twitterers - Predicting Information
Cascades in Microblogs.” In Proceedings of the 3rd
Wonference on Online Social Networks, 3–3.
WOSN’10. Berkeley, CA, USA: USENIX
Association.
http://dl.acm.org/citation.cfm?id=1863190.1863193.
Hui, Cindy, Yulia Tyshchuk, William A. Wallace, Malik
Magdon-Ismail, and Mark Goldberg. 2012.
“Information Cascades in Social Media in Response to
a Crisis: A Preliminary Model and a Case Study.” In
Proceedings of the 21st International Conference
Companion on World Wide Web, 653–56. WWW ’12
Companion. New York, NY, USA: ACM.
doi:10.1145/2187980.2188173.
Kwon, Joseph, and Ingoo Han. 2013. “Information
Diffusion with Content Crossover in Online Social
Media: An Empirical Analysis of the Social
Transmission Process in Twitter.” In 2013 46th
Hawaii International Conference on System Sciences
(HICSS), 3292–3301. doi:10.1109/HICSS.2013.268.
Romero, Daniel M., Wojciech Galuba, Sitaram Asur, and
Bernardo A. Huberman. 2011. “Influence and
Passivity in Social Media.” In Proceedings of the 20th
International Conference Companion on World Wide
WEBIST2015-11thInternationalConferenceonWebInformationSystemsandTechnologies
496

Web, 113–14. WWW ’11. New York, NY, USA:
ACM. doi:10.1145/1963192.1963250.
Suh, B., Lichan Hong, P. Pirolli, and Ed H. Chi. 2010.
“Want to Be Retweeted? Large Scale Analytics on
Factors Impacting Retweet in Twitter Network.” In
2010 IEEE Second International Conference on Social
Computing (SocialCom), 177–84. doi:10.1109/Social
Com.2010.33.
Sun, Jimeng, and Jie Tang. 2011. “A Survey of Models
and Algorithms for Social Influence Analysis.” In
Social Network Data Analytics, edited by Charu C.
Aggarwal, 177–214. Boston, MA: Springer US.
http://www.springerlink.com/content/p225p61145657
311/.
Weng, Jianshu, Ee-Peng Lim, Jing Jiang, and Qi He. 2010.
“TwitterRank: Finding Topic-Sensitive Influential
Twitterers.” In Proceedings of the Third ACM
International Conference on Web Search and Data
Mining, 261–70. WSDM ’10. New York, NY, USA:
ACM. doi:10.1145/1718487.1718520.
Yang, Jaewon, and Jure Leskovec. 2010. “Modeling
Information Diffusion in Implicit Networks.” In
Proceedings of the 2010 IEEE International
Conference on Data Mining, 599–608. ICDM ’10.
Washington, DC, USA: IEEE Computer Society.
doi:10.1109/ICDM.2010.22.
UserInfluenceandFollowerMetricsinaLargeTwitterDataset
497
