
Simulation based Evaluation of a Code Diversification Strategy
Brady Tello, Michael Winterrose, George Baah and Michael Zhivich
MIT Lincoln Laboratory, 244 Wood Street, Lexington, Massachusetts, U.S.A.
Keywords: Security, Multi-compiler, Optimization.
Abstract: Periodic randomization of a computer program’s binary code is an attractive technique for defending against
several classes of advanced threats. In this paper we describe a model of attacker-defender interaction in
which the defender employs such a technique against an attacker who is actively constructing an exploit
using Return Oriented Programming (ROP). In order to successfully build a working exploit, the attacker
must guess the locations of several small chunks of program code (i.e., gadgets) in the defended program’s
memory space. As the attacker continually guesses, the defender periodically rotates to a newly randomized
variant of the program, effectively negating any gains the attacker made since the last rotation. Although
randomization makes the attacker’s task more difficult, it also incurs a cost to the defender. As such, the
defender’s goal is to find an acceptable balance between utility degradation (cost) and security (benefit).
One way to measure these two competing factors is the total task latency introduced by both the attacker
and any defensive measures taken to thwart him. We simulated a number of diversity strategies under
various threat scenarios and present the measured impact on the defender’s task.
1 INTRODUCTION
Over the last several years, organizations across the
globe have shown a great deal of interest in finding
better ways to make their computer systems more
secure. This interest is the direct result of several
high profile security incidents involving major
corporations (Target, 2014; Home Depot, 2014),
governments (Greenwald et al., 2014; Bumiller,
2014), and even the infrastructure of the web itself
(MITRE, 2014). In response, researchers and
developers have developed defensive technologies
and techniques to mitigate advanced classes of
threats (Microsoft, 2014; Abadi et al., 2014).
An interesting class of advanced defense
techniques involves the randomization of system
components in an effort to confuse the adversary.
Strategies that conform to this paradigm are often
referred to as “Moving Target (MT)” strategies
(Okhravi, 2014; Cox, 2006; Franz, 2010). Moving
Target strategies are attractive because they make it
harder for an adversary to analyse and exploit targets
due to the fact that the system under defense is
constantly changing.
Despite the obvious benefits of MT strategies,
they are not zero-cost solutions: as one might
imagine, randomizing a computer system in a way
that doesn’t noticeably reduce the system’s
performance is a difficult problem. Moving target
engineers must ensure that their solutions maintain
adequate speed, functionality, performance, and
compatibility. All of these conditions are necessary
in order for a moving target technology to have a
chance at acceptance. Often, achieving these goals
involves calibration to a specific operational
environment because what is acceptable to one user
may not be acceptable to another.
One particularly interesting MT technology,
developed by researchers at the University of
California at Irvine (UCI), is known as the multi-
compiler (Franz, 2010). The multi-compiler
generates variants of computer programs that are
functionally identical but physically distinct. One
technique the multi-compiler uses to accomplish this
objective is to probabilistically distribute null-
operations (NOPs) throughout the program binary
code. NOP insertion is meant to defend against an
attack technique known as Return Oriented
Programming (ROP). In a ROP attack, the adversary
repurposes existing chunks of code in the defended
program’s memory space – known colloquially as
“gadgets” – to build complex attacks. The diversity
created by the multi-compiler makes it much more
difficult for an attacker to write reliable gadget
based exploits by both relocating and breaking up
gadgets across variants. By making ROP attacks less
36
Tello B., Winterrose M., Baah G. and Zhivich M..
Simulation based Evaluation of a Code Diversification Strategy.
DOI: 10.5220/0005522200360043
In Proceedings of the 5th International Conference on Simulation and Modeling Methodologies, Technologies and Applications (SIMULTECH-2015),
pages 36-43
ISBN: 978-989-758-120-5
Copyright
c
2015 SCITEPRESS (Science and Technology Publications, Lda.)

reliable, the multi-compiler is very attractive as a
defensive technology.
The multi-compiler is a powerful tool that can
provide varying notions of security depending on
how it is used. One threat the multi-compiler is
particularly well suited to address is that of the
“write once, compromise everywhere” attacker. In
this threat scenario, an attacker writes a single
exploit and can then re-use it to compromise a large
number of hosts. The multi-compiler solves this
problem by generating a unique variant of the
software under defense for each defended machine.
Using the multi-compiler this way strips the attacker
of the ability to write reusable exploits which creates
a sort of herd immunity in which individual actors
can be compromised but the population as a whole
experiences a dramatic reduction in risk. Our study
focuses on an enhanced rotation-based usage in
which each defender periodically rotates to new
variants of the program, rather than using the same
variant for a long period of time. Under this strategy,
diversification provides defensive advantages at both
the individual and aggregate scales.
The goal of our work is to use a computer
simulation to evaluate the effectiveness of a rotation-
based multi-compiler defense strategy under a
number of different threat scenarios. If the defender
is overly aggressive with his diversity/rotation
strategy, he incurs costs related to system utility: if a
program is spending all of its time defending itself,
it’s not spending any of its time doing anything
productive. Conversely, if he is not aggressive
enough, he risks system compromise and then must
pay the costs related to recovery (if recovery is an
option).
The contributions of this work are as follows:
1. We present a case study in the use of software-
based simulation to evaluate deployment
strategies of the multi-compiler.
2. We provide non-intuitive guidance for the setting
of a key security parameter of the multi-compiler
(NOP insertion rate). The multi-compiler has a
number of additional security parameters that we
hope to study in future work.
3. We introduce the notion of “impact landscapes”
which are useful tools for visualizing and
reasoning about task impact due to cyber security
threats
4. We utilize observed impact landscapes to
generate practical insights for a diversity based
cyber defense strategy
5. We present the results of a study that suggest
certain parameter settings for the multi-compiler
may be robust across a wide array of
performance cost scenarios
2 RELATED WORK
In related work at Lincoln Laboratory, we studied a
code diversification strategy that is dependent on the
results of an output scanner (Priest, 2015). This
strategy’s Achilles’ heel is the output scanner, as it
is well known that Intrusion Detection Systems are
imperfect (Denning, 1987). In the current work we
consider a strategy in which the defender simply
assumes that he is under constant attack and
proactively rotates.
In a recent paper, it is suggested that BBN
Technology’s A3 platform could be used to manage
a proactive code diversification strategy (Pal et al.,
2014) similar to the one we outline in this paper. We
believe the work laid out in our study bolsters the
case for this defensive mechanism by highlighting
how it performs under a number of scenarios.
Our approach resembles some aspects of the
Data Farming methodology described in (Alfred,
1998, Horne, 2004, Barry, 2004). Specifically, our
approach shares with Data Farming an emphasis on
simple agent-based models, extensive parameter
space exploration, visualizing outputs as landscapes,
and decision support. Data Farming goes on to
emphasize high-performance computing and the
discovery of outliers in the simulation results, two
aspects that are not emphasized in the present work,
though these topics are of interest for future work.
3 ATTACK MODEL
In order to carry out our strategy evaluation, we
have implemented a model-based simulation of an
attacker and defender interaction. Through the use of
computer simulation, we are able to study a wide
array of attacker-defender scenarios and outcomes.
3.1 Defender Model
In the model there are two actors: a defender and an
attacker. The defender is responsible for protecting a
running computer program, , from being exploited
by the attacker. It is assumed that A is a program
that continuously performs processing in support of
a notional task. To evade compromise, the defender
is allowed to periodically rotate the variant of A that
processes user requests, A*, to a new variant of .
SimulationbasedEvaluationofaCodeDiversificationStrategy
37
Each rotation resets the attacker’s cumulative effort
to zero, thus delaying system compromise.
In our model, the task takes a fixed amount of
work to complete which is specified by the
parameter
, measured in work units. The baseline
defender (no attacker, no multi-compiler) completes
a single work unit during a single time unit. Once
the defender completes
work units, the
simulation ends and the total time expended to
complete the task,
, is recorded. In the baseline
case, it would take
time units to complete
work units so
but in the presence of an
attacker and the accompanying defense strategies,
that relationship no longer holds. The difference
between these two numbers is what we refer to as
task delay, or
:
(1)
The task delay is important because it allows us to
objectively compare defense strategies and, indeed,
this is the primary metric we use in our evaluation.
There are two costs associated with rotation and
compromise that directly affect how quickly the
defender accomplishes his task. The cost of a
compromise to the defender,
, is an increase in
. The cost of rotation,
, is also an increase in
.
3.2 Threat Model
Much of the ground truth in our model is built into
the threat model. Our attacker is a remote actor who
we assume has the ability to query the memory
space of A*, in an effort to guess the location of
each of the
gadgets required to build a working
ROP exploit. Once the attacker is able to correctly
guess the location of all required gadgets he
launches an exploit against A*. It is also assumed
that the attacker has access to the multi-compiler,
can compile versions of the target binary, and has a
priori knowledge of the fixed NOP insertion rate
used by the defender’s instance of the multi-
compiler. The attacker uses these tools to build
probability distributions over the locations of the
desired gadgets. These distributions allow the
attacker to make guesses in order of decreasing
likelihood, thus minimizing the average number of
guesses that need to be made to find a particular
gadget. The attacker is also allowed to set the guess
rate,
, so the amount of time it would typically
take an attacker to find a single gadget is
multiplied by the average number of guesses
required for that gadget.
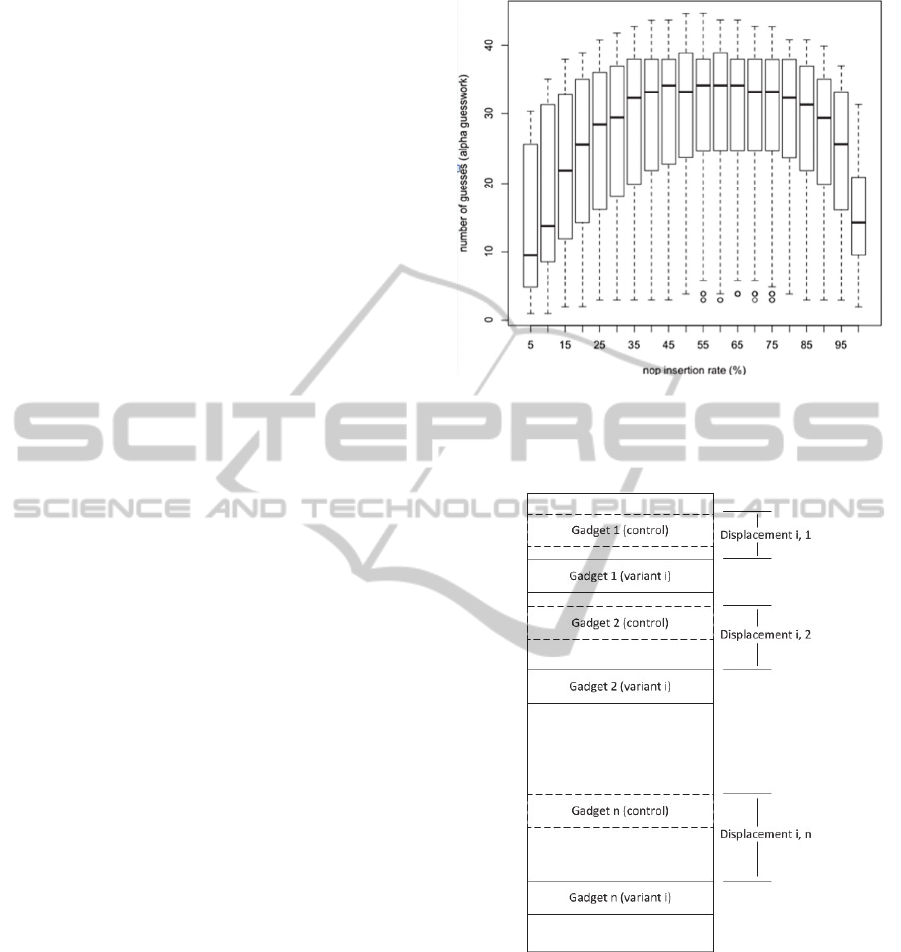
Figure 1: Distributions over the number of guesses
required to locate a gadget. These distributions were
calculated using Bonneau’s alpha-guesswork metric using
an alpha value of 0.1.
Figure 2: Gadgets are displaced as the multi-compiler adds
NOP instructions to the program code.
The way we simulated this was to build
distributions over the number of guesses required to
locate a specific gadget, as shown in Figure 1. These
were generated from an empirical analysis of the
multi-compiler’s effects on the popular gzip
program. This analysis involved the generation of a
control binary as well as 10,000 multi-compiled
variants for all NOP insertion rates between 0 and
100% that are multiples of 5. For each variant, it was
SIMULTECH2015-5thInternationalConferenceonSimulationandModelingMethodologies,Technologiesand
Applications
38

necessary to take inventory of all the surviving
gadgets by aligning them with the control binary.
This was required because the multi-compiler can
break up previously existing gadgets as a useful side
effect. For each surviving gadget in each variant, we
calculated the displacement from the corresponding
gadget in the control binary and used those
displacements to build probability distributions over
the displacements. From the displacement
distributions, we constructed our guessing
distributions using a password guessing metric
known as -guesswork as proposed by Bonneau
with an value of 0.1 (Bonneau, 2012). This metric
captures the expected number of guesses required to
guess a gadget’s location in at least percent of the
variants. Figure 2 illustrates how gadget
displacements were measured for the i
th
variant of
the program.
3.3 Multi-compiler Model
Another key component of our model is the multi-
compiler itself. As described in the introduction, the
multi-compiler generates unique variants of a
computer program by probabilistically inserting
NOP instructions into the program’s binary code.
The probability that the multi-compiler will insert a
NOP instruction before any given instruction is
specified by the model parameter,
. Modifying
directly affects the shape of the attacker’s
guess distributions, which makes it a critical security
parameter. Although one’s intuition might be to
crank
up to 100% for optimal security, this
actually leads to an entirely deterministic strategy,
which is obviously undesirable. The optimal setting
for
is 50% when performance costs are not
accounted for.
One drawback of the multi-compiler, however, is
that it inflates the number of instructions in the
program’s binary code. A multi-compiled program
will take longer to run than the control program due
to the large number of extraneous NOP instructions
that must be executed by the CPU. The UCI team is
well aware of this problem and conducted a study
into how NOPs might be more strategically placed
(Homescu, 2013). In that paper, data was provided
describing the measured slowdown due to
. We
modelled the average slowdown as a function, s, of
with scaling parameter b.
∗
(2)
By performing linear regression on the UCI data
we found that b=.165 in their experiments. We use
this value for b in our experiments. Note that this
value describes the slowdown due to a Naïve NOP
placement strategy. In (Homescu, 2013) data is
provided for both a Naïve NOP placement strategy
as well as a profile-guided strategy. We decided to
model the naïve strategy. We made this choice
because we think it has the highest potential for wide
scale use due to its ease of configuration. In contrast,
profile guided NOP insertion requires runtime
performance profiling which we feel makes it more
likely to be adopted by “power users” who are
extremely concerned with performance degradation.
One final metric of interest in this model is the
amount of task progress that the defender has made
at time T:
1
(3)
Where
if the defender rotates at time t
and is 0 at all other times. Similarly,
if
the defender becomes compromised at time t and is
0 at all other times.
This metric is useful because it is only once it
reaches
that the simulation ends. Note that
is the only stochastic element of this function.
3.4 Strategy Evaluation
We define a defense strategy, S, given an
operational environment, Θ, as the tuple:
〈
,
〉
(4)
Where Θ is the set of model parameters that define
the operational environment:
{
,
,
,
,
,
}
(5)
The effectiveness of a given
is evaluated based
on the average observed value of
. The average is
calculated over several scenario replicates using
Monte Carlo methods. We define a scenario as a
fixed set of model parameters and a replicate as a
single simulation run of a scenario.
The baseline from which we measured relative
performance was the scenario in which there was no
task delay. This corresponds to a scenario in which
attackers and multi-compilers are both disabled.
Alternatively, we could have used a scenario in
which the attacker is still turned on but
∞
which would allow us to evaluate the marginal
benefit of the rotation strategy.
However, since this is a probabilistic baseline,
we feel that the first alternative is more
straightforward.
SimulationbasedEvaluationofaCodeDiversificationStrategy
39

Table 1: Table of Symbols.
Symbol Description
The software under defense
∗
The current variant of A
The NOP insertion probability
The number of gadgets required to build an
exploit
The defender rotation rate
The attacker guess rate
The time penalty of rotation
The penalty due to compromise
The amount of work required to complete a
task
The total task delay
The multi-compilation slowdown
The time to complete
units of work
The cumulative task progress up until time T
4 EXPERIMENTS AND
ANALYSIS
4.1 Setup
Although our model has many parameters, several of
them are fixed across both scenarios and replicates.
We set
to 10, motivated by the observation that
attackers tend to prefer to use a small number of
ROP gadgets as a compact first stage of a full
exploit. For example, many of the ROP chains
published on the Corelan ROP database (Corelan,
2014) simply disable various virtual memory
protection mechanisms to set the stage for more
efficient/reliable techniques to finish the rest of the
attack. The amount of work required to complete a
task,
, was kept fixed at 10
3
for all experiments.
This choice allows for reasonable simulation
execution efficiency while allowing enough time for
the important dynamics in the model to manifest.
The cost of rotation,
, was set to 25 because it is
small compared to the values we used for
. The
reason for this decision was because it seemed
reasonable to assume that nobody would deploy a
rotation strategy if they didn’t have an efficient
mechanism for doing the actual rotations. We also
had a maximum tick count of 10,000 in place to
prevent the model from running for too long. If the
model runs for over 10,000 ticks, it simply halts and
reports the maximum task delay of 9,000.
Our strategy for varying the remaining
parameters was to define nine distinct task scenarios
using different values for
and
and then for
each scenario, perform a parameter sweep on both
and
. This allows us to analyze the task
delay landscape (henceforth, referred to as the
“impact landscape”) for a wide range of strategies
under a number of task scenarios. We ran 100
replicates for each scenario and measured
for
each.
Nine task scenarios were defined corresponding
to various combinations of attacker efficiency and
defender costs due to compromise. In three of our
scenarios, the attacker guesses once every time unit.
This is the strongest possible attacker under our
model. In another three scenarios the attacker
guesses once every other time unit and in the
remaining three he guesses once every fourth time
unit. For each of the three attacker strength levels,
we set three different levels of
. The levels we
use are 125, 250, and 2500. These three values
correspond to five, ten, and one hundred times
.
4.2 Results and Analysis
In order to visualize how the various parameters
impacted our model task, we created “impact
landscapes” for each of our scenarios. Each impact
landscape is a surface plot of the average response in
(averaged over the 100 replicates) as a function
of
and
.
In Figure 3, the various landscapes are laid out
with the attacker getting more aggressive from left
to right and the impact due to compromise getting
more severe from top to bottom. Within each
landscape, the rotation rate increases from left to
right and the NOP insertion probability increases
from bottom to top. Each landscape provides a clear
picture of how the two factors in our experiments
affected the total task delay. The dark blue regions
correspond to scenarios with small amounts of task
delay while the darker red regions correspond to
scenarios in which the defender took much longer to
complete the task. The landscapes in Figure 3
provide some practical strategic insights. Visual
inspection makes it immediately obvious that failure
to rotate at all will always lead to a compromise. It
also clear that being overly zealous with rotations
has a negative impact on the task on average.
Perhaps surprisingly, we see that a low value for
does not always lead to a high impact
situation. This is due to the fact that the cost of the
additional instructions is accrued during every step
of the simulation.
SIMULTECH2015-5thInternationalConferenceonSimulationandModelingMethodologies,Technologiesand
Applications
40

Figure 3: These impact landscapes demonstrate the affects of the rotation rate and NOP insertion rate on overall task
impact. Dark blue indicates low task impact (most desirable) and dark red indicates high impact.
These landscapes also highlight the fact that the
attacker’s aggressiveness has a strong effect on the
defender’s ability to maneuver in the parameter
space. In the leftmost scenarios the defender has a
wide array of parameter settings that can be used to
achieve acceptable task delay. In the rightmost
scenarios, however, the defender must restrict his
setting of the rotation rate to a narrow band or risk
being “pinned down” by the attacker.
Table 2: Ideal Operating Points For All Threat Scenarios.
The baseline delay (no attacker, no rotations) is 0.
∗
∗
.25 125 550 0.1 54
.25 250 550 (and 5 others) 0.2 59
.25 2500 550 (and 6 others) 0.2 59
.5 125 375 0.3 104
.5 250 375 0.3 104
.5 2500 300 0.2 111
1 125 175 0.3 221
1 250 175 0.3 209
1 2500 175 0.3 209
We also used the impact landscape data to
determine optimal parameter settings for each of the
nine attacker scenarios. For each scenario, we found
the values of
and
corresponding to the
lowest task delay. We labeled these optimal
parameter settings
∗
and
∗
respectively and
refer to them jointly as an Ideal Operating Point
(IOP). Table 2 provides the IOPs for each scenario
and the corresponding task delay.
The first thing to notice in this data is that the
value for
∗
never rises above 0.3. The reason for
this phenomenon is not intuitive. It is important to
know that the randomness added to a set of
application binaries by the multi-compiler peaks
when
0.5. To understand this, consider the
case in which
1: the adversary would be
able to reconstruct any multi-compiled application
by simply taking the control binary and adding a
NOP after every instruction. The inverse parabolic
shape of the distribution means in Figure 1 captures
this phenomenon more clearly. It is important to
note, however, that although setting the NOP
insertion rate to 50% provides the highest benefit
with respect to system security, it also imposes a
performance cost due to a NOP being executed after
every other instruction. It is due to this security-
performance tradeoff dynamic that the ideal NOP
insertion rate hovers around 0.3.
Because the ideal value for
(
∗
) is the
result of a tradeoff between security and
performance, it is interesting to study the sensitivity
of
∗
to different performance penalty models. To
study this, we ran an experiment in which we fixed
the rotation rate at 375 and varied the effect of
multi-compilation (the b parameter in the slowdown
function,
) from no penalty (b=0) up to a
moderate penalty (b=0.4) in increments of .05 and
SimulationbasedEvaluationofaCodeDiversificationStrategy
41

studied the resultant value for
∗
. Surprisingly,
although changes in b did cause shifts in the overall
impact landscape, the ideal NOP insertion rate
remained fixed at .3 for all ten penalty settings. This
was surprising to us and seems to indicate that the
NOP insertion rate can be set in a way that leads to
robustness across various security and performance
trade-off scenarios.
Another interesting result is the presence of
multiple points at which
takes on its minimal
value in the scenarios where the attacker is weakest
(
.. This might lead one to question whether
any of these points should be preferred over the
others. One option would be to choose the point with
the smallest variance. In our simulations, the data
seemed to indicate that points closer to the IOP
experienced smaller amounts of variance. In fact,
nearly all the optimal delay values in table 2 had
zero variance. This seems to indicate that using
variance as a selection criterion would not be
unreasonable. In future work, we plan to use various
risk metrics to explore alternative answers to this
question.
5 CONCLUSIONS
In this paper we presented a simulation-centric
evaluation of a cyber defense strategy based on
proactively rotating binary variants generated by a
multi-compiler. The strategy in question is one that
has been considered in previous work but as far as
we know has not been the subject of a serious
investigation.
We used the delay to a notional task as an
evaluation metric to help us understand the impact
of this code diversification strategy. We generated a
number of comprehensive impact landscapes to help
us understand how different deployment
configurations and adversarial assumptions affect
the overall task impact. Our analysis of these
landscapes showed that this strategy facilitates safe
and efficient execution even in the presence of a
highly motivated adversary.
Our study also suggested the existence of
parameter settings for the multi-compiler that are
highly resilient across a broad spectrum of scenarios.
In our simulations, setting the multi-compiler’s NOP
insertion rate to 30% resulted in minimal task impact
in a large number of experiments including when the
performance cost of NOP insertion was nearly zero.
This work was intended to shed light on various
strengths and weaknesses of the strategy and would
likely be of greatest interest to those hoping to
deploy such a strategy in a production environment.
6 FUTURE WORK
In this study we have carried out extensive sweeps
through the parameter space of an abstract model of
a rotation-based multi-compiler defense, resulting in
global visualizations of the task delay landscape
caused by multi-compiler related latencies and
attacker success. The methodology of performing
extensive parameter sweeps is only feasible when
the underlying model is highly abstract and
simplified. In a future study we plan to enhance our
rotation-based multi-compiler model with additional
operational details and explore the applicability of
metaheuristic search techniques, such as genetic
algorithms (Mitchell, 1996) and simulated annealing
(Kirkpatrick et al., 1983) to efficiently navigate
complex output landscapes to discover optimal
operation points for a multi-compiler defense.
As part of this work we noticed that there are
situations in which it is not clear which of several
operating points are “ideal” (e.g. they all have the
same task delay). Future work will involve the use
of various risk metrics to attempt to find operating
points that are truly ideal.
ACKNOWLEDGEMENTS
The authors would like to thank Dr. William
Streilein, Dr. Neal Wagner, and Dr. Kevin M. Carter
of MIT Lincoln Laboratory for their advice on this
paper.
This work is sponsored by Defense Advanced
Research Projects Agency under Air Force Contract
#FA8721-05-C-0002. Opinions, interpretations,
conclusions and recommendations are those of the
authors and are not necessarily endorsed by the
United States Government.
The views, opinions, and/or findings contained in
this article are those of the authors and should not be
interpreted as representing the official views or
policies of the Department of Defense or the U.S.
Government.
REFERENCES
Abadi, M, Budiu, M, Erlingsson, U, & Ligatti, J 2005,
‘Control-Flow Integrity: Principles, Implementations,
and Applications’, in Proceedings of the 12th ACM
SIMULTECH2015-5thInternationalConferenceonSimulationandModelingMethodologies,Technologiesand
Applications
42

Conference on Computer and Communications
Security. [9 Oct. 2014].
Alfred, GB, & Gray, EH 1998, ‘Data Farming: A
metatechnique for Research in the 21st Century.’
Maneuver Warfare Science, pp. 93-99.
Barry, P, & Koehler, M 2004, ‘Simulation in context:
using data farming for decision support", Proceedings
of the 2004 Winter Simulation Conference. vol. 1. pp.
814-819. Available from: IEEE XPlore Digital
Library.
Bonneau, J 2012, ‘The Science of Guessing: Analyzing an
Anonymized Corpus of 70 Million Passwords.’ 2012
IEEE Symposium on Security and Privacy. Available
from: IEEE Xplore Digital Library.
Bumiller, E 2010, Army Leak Suspect Is Turned In, by Ex-
Hacker, The New York Times. Available from:
<http://www.nytimes.com/2010/06/08/world/08leaks.h
tml?_r=0>. [09 Oct. 2014].
Corelan Team n.d, Corelan ROPdb. Available from: <
https://www.corelan.be/index.php/security/corelan-
ropdb/>. [23 Oct. 2014].
Cox, B, Evans, D, Filipi, A, Rowanhill, J 2006, ‘N-Variant
Systems A Secretless Framework for Security through
Diversity’, Proceedings from the 15th Usenix Security
Symposium. Available from: <http://www.cs.virginia.
edu/nvariant/>.
Denning, DE 1987, ‘An Intrusion-Detection Model’, IEEE
Trans. on Software Eng., vol. SE-13, no. 2, pp. 222-
232.
Franz, M 2010, ‘E Unibus Pluram: Massive-scale
Software Diversity as a Defense Mechanism’,
Proceedings of the 2010 Workshop on New Security
Paradigms, pp. 7-16. Available from: ACM Portal:
ACM Digital Library.
Greenwald, G, MacAskill, E, & Poitras, L 2013, Edward
Snowden: The Whistleblower Behind the NSA
Surveillance Revalations, The Guardian. Available
from: <http://www.theguardian.com/world/2013/jun/
09/edward-snowden-nsa-whistleblower-surveillance>.
[9 Oct. 2014].
Homescu, A, Neisius, S, Larsen, P, Brunthaler, S & Franz,
M 2013, ‘Profile-guided automated software
diversity’, Proceedings of the 2013 International
Symposium on Code Generation and Optimization, pp
204-214. Available from: IEEE Xplore Digital
Library.
Horne, GE, and Meyer, TE 2004, ‘Data farming:
Discovering surprise’, Proceedings of the 36th
conference on Winter simulation, pp.807-813.
Kirkpatrick, S, Gelatt, CD, Vecchi, MP, 1983,
‘Optimization by Simulated Annealing’, Science, New
Series, vol. 58, no. 2, pp. 671-680.
Mark, J 2014, T.J. Maxx Theft Believed Largest Hack
Ever. Available from: <http://www.msnbc.com>. [09
Oct 2014].
Mitchell, M 1996, An Introduction to Genetic Algorithms,
MIT Press, Cambridge.
Okhravi, H, Hobson, T, Bigelow, & D, Streilein W 2014,
‘Finding Focus in the Blur of Moving Target
Techniques’ IEEE Security and Privacy, vol. 12, no. 2,
pp. 16-26.
Pal, P, Schantz, R, Paulos, A, Benyo, B 2014, ‘Managed
Execution Environment as a Moving-Target Defense
Infrastructure’. IEEE Security & Privacy, vol. 12, no.
2. pp. 51-59.
Priest, B, Vuksani, E, Wagner, N, Tello, B, Carter, K,
Streilein, W. 2015, ‘Agent-Based Simulation in
Support of Moving Target Cyber Defense Technology
Development and Evaluation’, Proceedings of the
ACM Spring Simulation Multi-Conference
(SpringSim’15).
CVE-2014-0160 2014, MITRE Corporation. 2014.
Available from: <https://cve.mitre.org/cgi-bin/
cvename.cgi?name=CVE-2014-0160>. [09 Oct. 2014].
CVE-2014-7169 2014, MITRE Corporation. Sept. 2014.
Available from: <https://cve.mitre.org/cgi-bin/
cvename.cgi?name=CVE-2014-0160>. [09 Oct. 2014].
Data Breach FAQ, Target. Inc. Available from:
<https://corporate.target.com/about/shopping-
experience/payment-card-issue-faq> [07 Oct 2014].
Data Execution Prevention: Frequently Asked Questions
n.d. Microsoft Corporation. Available from: <
http://windows.microsoft.com/en-us/windows-
vista/data-execution-prevention-frequently-asked-
questions>. [09 Oct. 2014].
The Home Depot Provides Update on Breach
Investigation, The Home Depot, Inc. Available from:
<https://corporate.homedepot.com/mediacenter/pages/
statement1.aspx>. [8 Sept. 2014].
SimulationbasedEvaluationofaCodeDiversificationStrategy
43
