
LLUNPIY Preliminary Extension for Simulating Primary Lahars
Application to the 1877 Cataclysmic Event of Cotopaxi Volcano
Guillermo Machado
1,3
, Valeria Lupiano
2
, Gino M. Crisci
2
and Salvatore Di Gregorio
1
1
Dept. of Mathematics and Computer Science, University of Calabria, Arcavacata, 87036 Rende, Italy
2
Dept. of Biology, Ecology, Earth Science, University of Calabria, Arcavacata, 87036 Rende, Italy
3
Faculty of Engineering, National University of Chimborazo, 060150 Riobamba, Ecuador
Keywords: Modelling, Simulation, Cellular Automata, Lahars, Cotopaxi, Natural Hazard, LLUNPIY.
Abstract: Cotopaxi volcano is one of the most studied and surveyed volcanos in the world because the repetition of
the 1877 catastrophic lahar invasion, is not implausible, threatening now more than 100,000 persons. A
reliable forecasting tool is very important for projecting security measures. LLUNPIY is a Cellular
Automata model for simulating lahars in terms of complex system evolving on the base of local interaction.
Here, LLUNPIY extension is applied to Cotopaxi event of 1877 primary lahars, after the successful
simulation of some secondary lahars of Tungurahua volcano. Such an extension permitted simulations with
different initial hypotheses: our preliminary simulations agree in outline with field studies about the
evolution of event, moreover LLUNPIY permits a broader approach to overall phenomenon in comparison
with other tools.
1 INTRODUCTION
Volcanic eruptions can generate directly (primary
lahars) or indirectly (secondary lahars) catastrophic
surface flows that are a mixture of volcanic debris
and water occurring on and around volcanoes
(Vallance, 2000), other than normal streamflow
(Smith and Fritz, 1989), with consistency, viscosity
and approximate density of concrete: they are fluid,
when sloping moving up to 100 km/h as far as
extreme distance of 300 Km, solid at rest in the flat
terminal zone (Hoblitt et al., 1987). They may be
primary lahars, for instance, when lava or
pyroclastic flows melt snow and glacier and/or mix
with wet soil generating a flood sometime also with
the water of broken basin (Manville et al., 2013;
Pistolesi et al., 2014). Typical instances are the
1949, 1963 e 1971 lahars at Villarica, Chile
(Vallance, 2005), when lava flows melted snow and
glacier and broke a pond. Secondary lahars instead
occur from the post-eruptive when heavy rainfalls,
typhoons or lake breakout mobilize ash and other
volcanic debris of previous volcanic activities (e.g.
2005, 2008 lahars of Tungurahua volcano simulated
by Partial Differential Equations (PDE) and Cellular
Automata (CA) methods (Williams et al., 2008;
Machado., et al. 2014).
Lahars are very complex dynamical systems,
very difficult to be modelled: they can grow by soil
erosion and/or incorporation of water, along
watercourses. Unconsolidated pyroclastic material,
(Major et al., 2000; Manville et al., 2000), can be
easily eroded by superficial water forming dilute
sediment-laden flows, that can bulk-up to debris
flows whose magnitude will depend upon the
volume of both the water and remobilized material
(Barclay et al., 2007).
A variety of approaches have been taken to
model the behaviour of lahars and the hazards posed
to downstream communities (Manville et al., 2013):
empirical models based on smart correlations of
phenomenon observables (Schilling, 1998; Muñoz-
Salinas et al., 2009), simple rheological and
hydrological models, which assume acceptable
simplifications as composition-independent flow
behaviour or Newtonian flow behaviour (Costa,
2004; O’Brien et al., 1993), PDE approximating
numerical methods of complex physical behaviour
of lahar (Pitman et al., 2003).
CA represent an alternative methodological
approach for modelling and simulating complex
systems evolving on the base of local interactions.
Intuitively, a CA can be seen as a space, partitioned
in regular cells, each one embedding an identical
367
Machado G., Lupiano V., Crisci G. and Di Gregorio S..
LLUNPIY Preliminary Extension for Simulating Primary Lahars - Application to the 1877 Cataclysmic Event of Cotopaxi Volcano.
DOI: 10.5220/0005542903670376
In Proceedings of the 5th International Conference on Simulation and Modeling Methodologies, Technologies and Applications (SIMULTECH-2015),
pages 367-376
ISBN: 978-989-758-120-5
Copyright
c
2015 SCITEPRESS (Science and Technology Publications, Lda.)
input/output computing unit. Each cell is
characterized by its state. S is the finite set of the
states. Input for each cell is local and is given by the
states of m neighbouring cells, where the
neighbourhood conditions are given by a pattern
invariant in time and space. At time 0, cells are in
arbitrary states (initial conditions) and the CA
evolves changing simultaneously the state at discrete
times, according to (local, depending on the input)
rules, that are invariant in time and space.
Surface flows are a typical application of
Multicomponent (or Macroscopic) Cellular
Automata (Di Gregorio and Serra, 1999; Avolio et
al., 2003) for computer simulation: SCIARA model
for lava flows (Avolio et al., 2006), SCIDDICA
(Avolio et al., 2010) for debris flows, PYR (Crisci et
al., 2005) for pyroclastic flows, VALANCA (Avolio
et al., 2010) for snow avalanches, SCAVATU
(D’Ambrosio et al., 2001) for soil erosion by
rainfall.
A very important characteristic of all these
models is that they are based on two dimensions CA,
but they work effectively in three dimensions
because the third dimension is enclosed in part of the
sub-states: altitude, kinetic head, lahar thickness,
depth of erodible pyroclastic stratum, and so on.
We developed LLUNPIY in a first version for
simulating secondary lahars with applications to
2005 and 2008 Tungurahua lahars. An extension
was performed in order to capture the behaviour of
primary lahars and two different applications related
to initial phase were accomplished for 1877
Cotopaxi catastrophic lahars.
The second section of the paper describes the
geological features of the phenomenon related to
Cotopaxi volcano characteristics. The third section is
devoted to the LLUNPIY model applied to the
simulations that are presented in the fourth section.
At the end comments and conclusions.
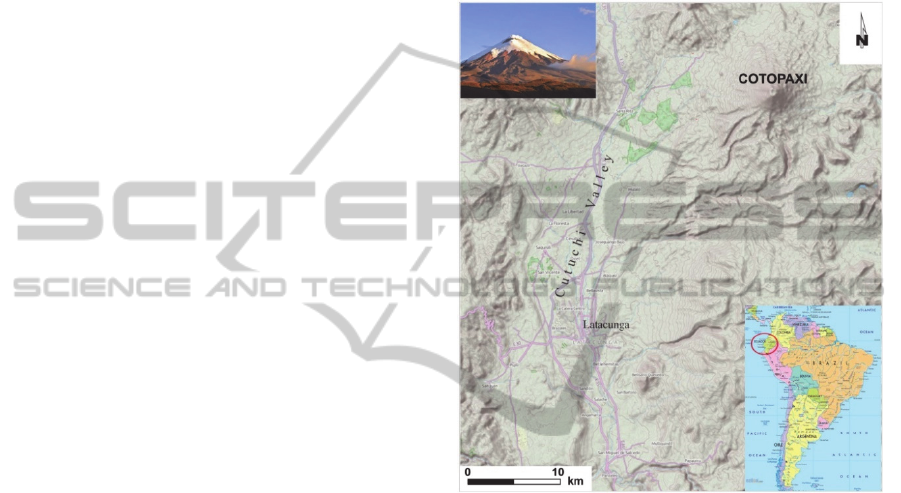
2 COTOPAXI VOLCANO
Cotopaxi volcano is situated in the Eastern
Cordillera of the Ecuadorian Andes (Figure 1) about
60 km south of Quito, and it is a very hazardous
active stratovolcano.
With an altitude of 5897 m a.s.l. the summit of
the volcano is currently covered with a thick layer of
ice that ranges between 30 and 120 m (Cáceres et
al., 2004). Cáceres et al. (2004) estimated that the
glacier volume was approximately 1,000 million m
3
in 1976, considering an average thickness of 50 m.
Such a volume has been reduced to 732 million m
3
in 1997, because of a progressive melting, probably
generated by climate change.
The main drainage lines are: in north sector there
is the Pita-Guayallabamba River, the west slopes are
crossed by several tributaries of the Napo River,
while waters of several streams, often encased in
narrow valleys, coming from the cone of volcano,
converge into the Rìo Cutuchi, that flows toward
south-southwest in the wide valley of Latacunga.
Figure 1: Cotopaxi volcano and its surrounding region.
The area around the volcano is densely populated, in
fact, the city of Quito is located in north. In the
Cutuchi valley besides several villages, there are the
towns of Latacunga and Salcedo, respectively 45 km
and 50 km in south of Cotopaxi. In addition,
industries and agriculture are intensively developed
in these areas.
Since 1738 Cotopaxi has erupted more than 50
times. The most violent historical eruptions were in
1744, 1768, 1877, and 1904 with generation of
disastrous lahars in many cases.
2.1 1877 Lahars
The presence of glacier on summit of Cotopaxi is
one of principal causes, together with volcanic
eruptions (lava or pyroclastic flows), of primary
lahars. In fact, the Cotopaxi has often produced
catastrophic lahars during eruptions because of ice
and snow melting.
The 1877 eruption, described by Sodiro (1877)
SIMULTECH2015-5thInternationalConferenceonSimulationandModelingMethodologies,Technologiesand
Applications
368
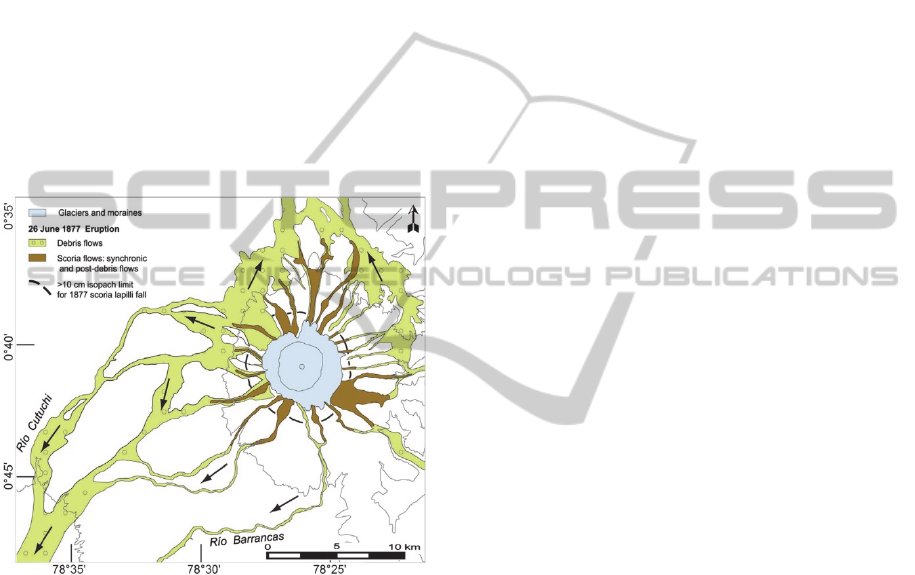
and Wolf (1878), produced very destructive and
large lahars. These chronicles report times and
extension of lahar floods next to inhabitant centres:
some later observations estimated the glacier
melting to 1/10 of total volume (Wolf, 1878). Water,
which originates from melting glacier, had been
mixed with pyroclastic material erupted and with
pre-existing volcanoclastic materials outcropping
along slopes, so many lahars flows had been
generated (Figure 2). These flows, channelled in
drainage network, destroyed population centres and
everything on the path.
On the western slope of volcano, three main
flows are generated, coming down with a
conjectured speed from about 30 m/s to about 10 m/s
(depending on the slope) and reaching Latacunga, a
village, at that time, in about one hour (Mothes et
al., 2014).
Figure 2: Reconstruction of 1877 lahar path (from Mothes
et al., 2014).
3 LLUNPY MODEL
In this section, we present an extension of
LLUNPIY model with the purpose of capturing the
dynamical behaviour of primary lahars in the
southern drainage system of the Cotopaxi volcano.
LLUNPIY (Lahar modelling by Local rules based
on an UNderlying PIck of Yoked processes) derives
from the Quechua word llunp’iy, that means flood.
The first version has been developed to simulate
secondary lahars with applications to two events at
Tungurahua volcano (Machado et al., 2014 and
2015).
Lahars triggered by mobilization of deposits
from volcanic explosions have occurred at Cotopaxi
volcano, Ecuador on the average of once every
century over the last two millennia. Lahars from
Cotopaxi are possible to flow down along three main
drainages, affecting a present day population of
around 100,000 inhabitants.
Primary lahars were modelled using LLUNPIY
in three main stages. Generation stage: lahars are
generated from pyroclastic flows and melting of the
volcano’s icecap, due to interaction of eruptive
products with a summit glacier. This stage, the
glacier melting, is an extension of the previous
version of LLUNPIY, that models raining, water
flows and percolation in the soil and successive
mobilization of pyroclastic stratum; the raining
contribute is zero for the Cotopaxi event. Flood
stage: lahar flows develop along the volcano steep
slopes with high gravitational potential energy and
turbulence with possible soil erosion and water
inclusion along watercourses. Final stage: the lahar
flow reduces its kinetic energy and velocity in flat
areas; rapid decrease of turbulence causes deposit
and solidification processes by water extrusion; in
some cases, lahar can partially “be diluted” and
“disappear”, if it runs into a watercourse with a
water flow, enough large to englobe the lahar matter.
3.1 Formal Definition of LLUNPIY
The extension of LLUNPIY model is a two
dimensional CA with hexagonal tessellation and
defined by the septuplet:
<R, G, X, S, P,, >
(1)
R = {(x, y)| x,y , 0 ≤ x≤ l
x
, 0 ≤ y ≤ l
y
} is
the set of points with integer co-ordinates, that
individuate the regular hexagonal cells,
covering the finite region, where the
phenomenon evolves. is the set of natural
numbers;
G R is the set of cells, corresponding to the
glacier, where lahar is formed when
pyroclastic matter melts ice;
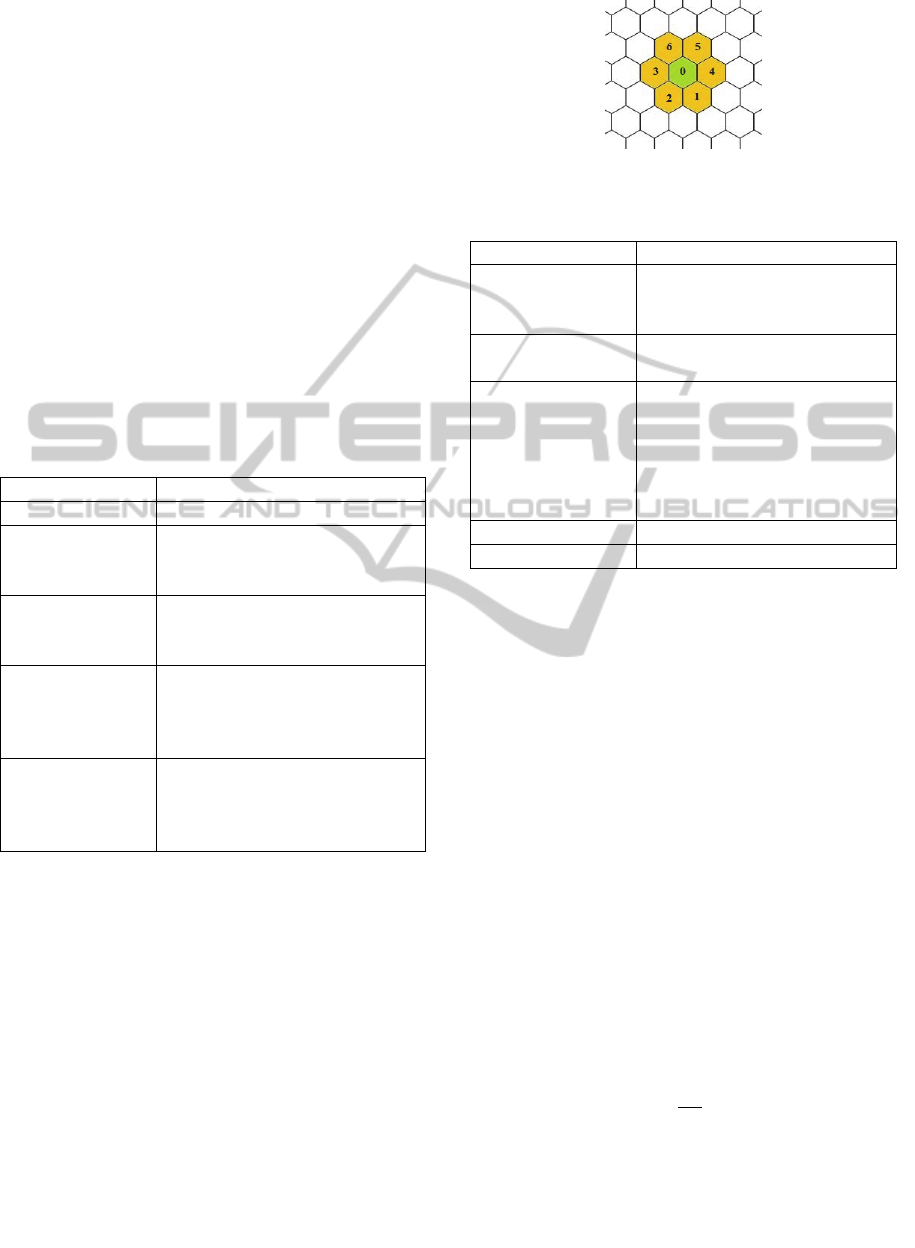
X = {(0, 0), (1, 0), (0, 1), (−1, 1), (−1, 0),
(0,−1), (−1,−1)}, the neighbourhood index,
identifies the geometrical pattern of cells,
which influence state change of the “central”
cell (Figure 3): the central cell (index 0) itself
and the six adjacent cells (indexes 1,..,6);
S is the finite set of states of the finite
automaton, embedded in the cell; it is equal to
the Cartesian product of the sets of the
considered sub-states (Table 1).
P is the set of the global physical and
LLUNPIYPreliminaryExtensionforSimulatingPrimaryLahars-Applicationtothe1877CataclysmicEventofCotopaxi
Volcano
369
empirical parameters, which account for the
general frame of the model and the physical
characteristics of the phenomenon (Table 2);
: S
7
S is the cell deterministic state
transition in R, it accounts for the following
main components of the phenomenon: lahar
flow, soil mobilization and erosion. Water
inclusion and extrusion, lahar solidification
are not considered for Cotopaxi case, because
such primary lahars followed the river paths
and largely overflowed, they lost in the ocean
during the final phase;
:
G S expresses the “external influence”
of fall of the pyroclastic matter on glacier and
consequently ice state change in lahar with the
addition of pyroclastic matter for G cells at the
initial CA steps. is here referred to the step
number.
Table 1: Sub-states regarding the generation phases.
SUB-STATES DESCRIPTION
S
A
, S
IT
cell Altitude, Ice Thickness,
S
LT
, S
KH
, S
LWC
Lahar Thickness, Lahar
Kinetic Head, Lahar Water
Content
S
X
, S
Y
the co-ordinates X and Y of
the lahar barycenter inside the
cell
S
E
, S
EX
, S
EY
,
S
KHE
(6 components)
External flow normalized to a
thickness, External flow co-
ordinates X and Y, Kinetic
Head of External flow
S
I
, S
IX
. S
IY
, S
KHI
(6 components)
Internal flow normalized to a
thickness, Internal flow co-
ordinates X and Y, Kinetic
Head of Internal flow
3.2 Generalities of and
In the formulae, a sub-state is specified by S, its
right subscript is a shortening of the sub-state name
in capital letters (e.g., S
A
, the sub-state altitude); if
the left subscript is not specified, the sub-state is
related to the central cell of the neighbouring; when
other cells of the neighbouring must be considered,
the left subscript specifies the index of the
neighbouring cell, e.g.,
1
S
A
, is the sub-state altitude
of the cell with index 1 in the neighbouring. Sum of
indexes of opposite cells is always 7 as in Figure 3.
S
X
’ indicates the updated value of the generic
sub-state S
X
. S
x
means S
X
value variation.
Quantities related to volumes as outflows are
normalized to lengths, because the cell area is
Figure 3: Geometrical pattern of cells.
Table 2: Physical and empirical parameters.
PA
R
AMETERS DESCRIPTION
p
a
, p
t
cell apothem (m), temporal
correspondence of a CA step
(s)
p
fc
friction coefficient parameter
(°)
p
td
, p
ed
, p
pe
, p
mt
lahar parameters: turbulence
dissipation (-) and erosion
dissipation (-) of energy;
lahar parameter of
progressive erosion (-),
mobilization threshold (m)
p
slt
slope threshold (°)
p
khl
kinetic head loss (m)
constant in value.
The lahar inside a cell is modelled as a
“cylinder” tangent the next edge of the hexagonal
cell with mass, velocity and barycentre co-ordinates.
Movements of cylinders from central cell toward
adjacent cells originate: internal flows (cylinder shift
is all inside the cell), external flows (cylinder shift is
all outside the cell) and mixed situations.
Computations of lahar flows are based on the
Algorithm of the Minimization of Differences
(AMD) for determination of minimizing outflows f
i
1i6, (i.e., the flows that minimize differences in
height for the cell neighbourhood) and the
determination of outflow shifts (Di Gregorio and
Serra, 1999; Avolio et al., 2012). AMD involves
different specification of “heights” h
i
, the “fixed”
parts and d, the “distributable” part. Motion
equations specify a shift x and a final velocity v, in
order to determine from initial f
i
(1i6) the
outflows f
i
’ (0i6) during a step. Lahar kinetic head
is obtained by:
2
(2)
where is the gravity acceleration, the subscripts l
means lahar.
The application of function is here simplified:
and
0 in the first step.
SIMULTECH2015-5thInternationalConferenceonSimulationandModelingMethodologies,Technologiesand
Applications
370

3.3 Specification of
The main “elementary processes” of LLUNPIY are
outlined in the following.
3.3.1 Lahar Thickness and Outflows
Lahar in the cell and its lahar outflows are computed
in similar way as debris in the cell and its debris
flow in SCIDDICA-SS2 and improvements (Avolio
et al., 2008; 2009; Lupiano et al., 2014a; 2014b).
SCIDDICA means Simulation through
Computational Innovative methods for the Detection
of Debris flow path using Interactive Cellular
Automata, while SS2 means second version for both
Subaerial and/or Subaqueous debris flow simulation.
The outflow path from the central cell to a
neighbouring cell i follows an ideal direction
between two points: the lahar barycentre of central
cell and the centre of the adjacent cell i accounting
for slope θ
i
(Figure 3).
Viscosity is modelled as the part of lahar
thickness, that cannot be movable (Avolio et al.,
2006) according to a function that computes an
“adherence” value between two values p
adh1
and
p
adh2
in linear way.
Viscosity represents “de facto” the lahar deposit
along the path at the phenomenon ending except the
solidification deposit.
In the case of this primary lahar, adherence is a
constant value p
adh
in order to account the
catastrophic features of the phenomenon with an
enormous quantity of melted water, plus the river
water, so that the lahar keeps extremely fluid.
AMD is so applied:
(3)
(4)
(5)
The motion equations are related to outflows from
central cell toward the adjacent cell i (1i6):
sin
∙cos
2
(6)
∙
(7)
where v
0
is the initial velocity (deduced by S
KH
), x
i
is
the shift of the outflow toward the cell i,
i
is the
slope angle between the central cell and the
neighbour i;
Sub-states regarding outflows are computed in
the same way as debris flows in SCIDDICA-SS2
(Avolio et al. 2008).
,
,
,
are computed by balancing
equations that consider the contribute of outflows
and inflows:
(8)
where
is the outflow of neighbouring cell i
toward the cell 0, that is specified by component 7-i
for the neighbouring of cell i. An average weight is
also considered:
(9)
∑
∑
(10)
∑
∑
(11)
∑
A turbulence effect is modelled by a proportional
kinetic head loss at each LLUNPIY step: ∆
. The turbulence affects kinetic head and
consequently the velocity. This formula involves
that a velocity limit is asymptotically imposed “de
facto” for any value of slope.
3.3.2 Soil Erosion
When the kinetic head value overcomes an
opportune threshold (
) depending on the
soil features then a mobilization of the pyroclastic
cover occurs proportionally to the quantity
overcoming the threshold:
∆
(12)
because the pyroclastic cover depth diminishes as
the debris thickness increases); the kinetic head loss
is:
∆
(13)
The mixing of the eroded pyroclastic cover with the
earlier debris involves that the earlier debris kinetic
energy becomes the kinetic energy of all the mass of
LLUNPIYPreliminaryExtensionforSimulatingPrimaryLahars-Applicationtothe1877CataclysmicEventofCotopaxi
Volcano
371
debris, it implicates trivially a further kinetic head
reduction:
∆
∆
(14)
4 SIMULATIONS OF 1877 EVENT
Necessary input data for simulation of primary
lahars with LLUNPIY are:
DEM (Digital Elevation Model) with adequate
cell-size;
Source areas: extension of glaciers, whose
melting originates lahars, or extension of
ponds/lakes, whose destruction by volcanic
matter releases enough water to generate
lahars;
Specifications of volcanic activity (eruption
duration, strength and range of action) that
effects glacier melting and/or destruction of
ponds/lakes;
Detachment areas: this is an alternative to
simulate volcanic activity, the phenomenon
starts in the areas immediately out of the
volcanic action range by specifications of
“initial” quantities of lahar;
Erodible pyroclastic cover.
In order to calibrate model parameters it is
fundamental to identify the lahar path and invaded
area of real phenomenon in order to measure the
simulation “goodness”.
We referred for 1877 event simulation to the
2010 DEM with 30m cell size with vertical accuracy
from 0.6 m to 1.3 m (supplied to us by Instituto
Geofísico of the Escuela Politécnica Nacional -
IGEPN), that is a very large size but considering the
magnitude and extent of the phenomenon was
considered acceptable, if changes in the time are also
considered. Erodible detrital cover was considered a
uniform layer of 5 m thick because field data are not
available in all the simulation area.
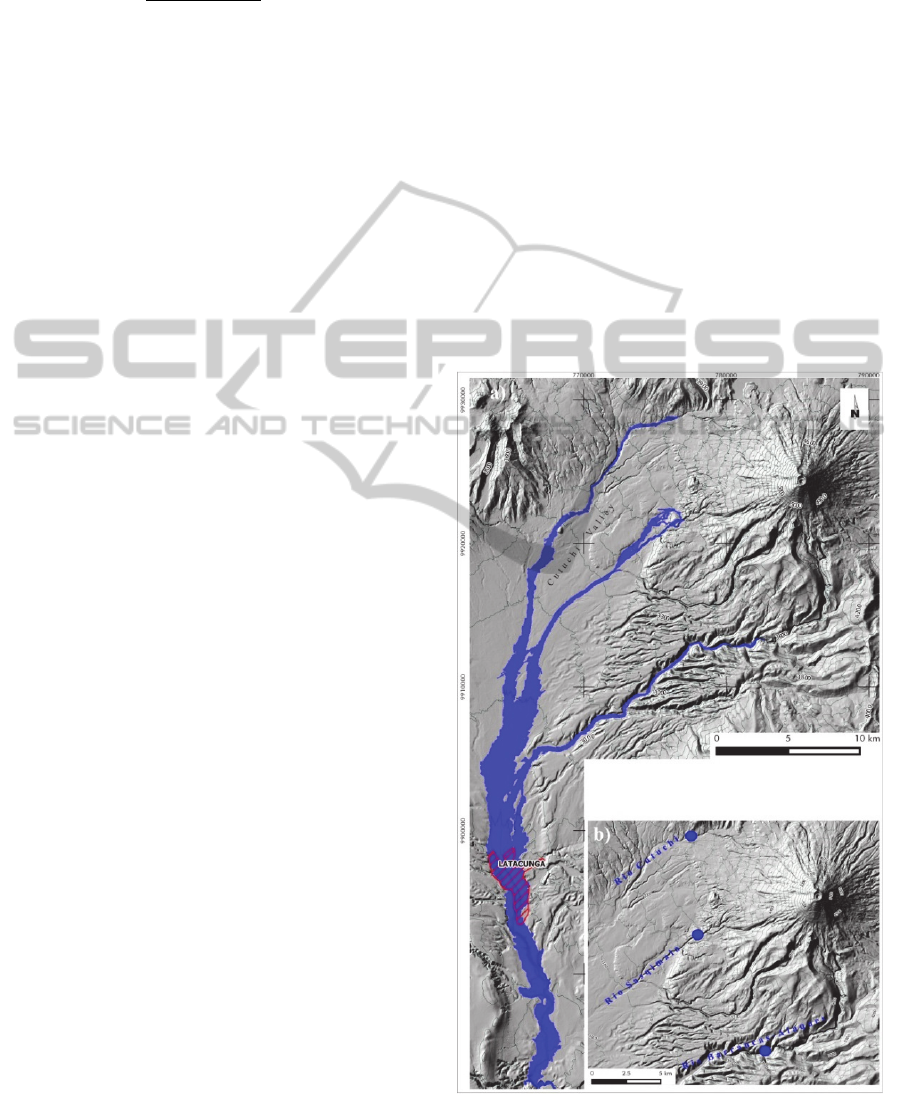
4.1 “Many Sources” Simulations
We considered, as first approach, the hypothesis
(Mothes et al., 2014; Pistolesi et al., 2014) that the
main event could be equivalently generated
considering the initial positions of lahars sources in
the three principal streams (Figure 4b): Río Cutuchi,
Río Sasqìmala and Río Barrancas-Alaques.
Only the lahars flowing in the Cutuchi valley
were considered, taking into account that the flows
toward south may be considered independent from
the other ones in the real phenomenon.
In each of these three streams we have placed,
respectively, 18.5 10
m
3
, 9.510
m
3
and
1010
m
3
of lahar matter.
The resultant simulations are shown in figure 4a.
The flows along Río Cutuchi and Río Sasqímala
converge together at elevation of 3000 m a.s.l. after
60 minutes of triggering, while the lahar, that flows
in Río Barrancas-Alaques, joins the main stream
further south in 68 minutes. The simulated lahar
flows reached Latacunga in one hour and 30 minutes
at average velocity of 8 m/s.
These results are comparable with simulations
performed by the model LAHARZ (Pistolesi et al.,
2014), that considered larger quantities of initial
lahars (120 10
m
3
sum of: 60 10
m
3
in
Río Cutuchi, 3010
m
3
in Río Sasqímala and
3010
m
3
in Río Barrancas-Alaques).
Positioning lahar sources in the top of Río Cutuchi,
Figure 4: a) LUNPIY simulation of 1877 lahars; b)
position of considered lahars sources (blue point).
SIMULTECH2015-5thInternationalConferenceonSimulationandModelingMethodologies,Technologiesand
Applications
372

Río Sasqímala and Río Barrancas-Alaques involves
a limit for LLUNPIY because quantity that exceeds
greatly the bed of rivers can follow other paths; this
may be not justified. Furthermore, LAHARZ does
not model soil erosion, which increases lahar flows.
LLUNPIY models the erosion that increases the
lahar initial quantity. If we compare the
reconstruction of the real event, made by Mothes et
al. (2014) by field data, the width of LLUNPIY
simulation is smaller in the area around the vent, but
LAHARZ simulation is larger (Figure 5). In the
following phases, the two simulations become
always closer. The two results are very similar in the
final sector (Latacunga area), because, at the end, the
addition of eroded material balances the two
approaches. We remember that LAHARZ
simulations consider only the lahar extension, but
not times and velocity. A further comparison could
be possible, considering the glacier melting for
LLUNPIY in order to simulate lahars since their
very first origin. The next section reports such a case
with the worst hypothesis of total icecap melting.
4.2 “Glacier Melting” Simulation
The previous approach with CA involves the limit of
initial quantity of lahar at the sources, because
overflows can distort the effective evolution of the
phenomenon. This did not permit to overcome an
initial lahar quantity at the beginning in the previous
simulation. For this purpose, we introduce the CA
“elementary process” of melting glacier by
pyroclastic flows or bombs. The ice layer is
supposed to enclose pyroclastic matter and to melt
immediately (the LLUNPIY first step) the glacier;
that is more realistic than sources approach, if the
rapid evolution of eruption is considered. The
simulations of icecap melting are based on data,
which correspond to 1976 glacier extension with
average glacier thickness of 50 m (Cáceres et al.,
2004). Simulation initial conditions account only for
that part of glacier that is able to feed lahars towards
Cutuchi valley (sectors 11-19 in figure 6g).
The evolution of other flows represents partial
results only in the first steps of simulation.
In the simulation (Figure 6
a, b, c, d, e, f), lahars
reach a maximum height of 50 m in Río Cutuchi and
Río Barrancas-Alaques; since the icecap initial
melting, the flows join in Cutuchi valley from main
drainage lines after 50-60 minutes and reach the
town of Latacunga after 1 hour and 35 minutes; that
is 35 minutes late in comparison with times, that are
reported in the chronicles. These results are
comparable with simulations performed by the
model LAHARZ, that considered initial larger
quantities of lahars in the case of “many sources”
simulation, while the worst case of “icecap melting”
generated a larger quantity of lahar toward the
Cutuchi Valley. The paths are the same, but widths
are obviously larger.
Figure 5: Comparison among LLUNPIY simulation,
LAHARZ simulation and partial reconstruction of real
event.
5 CONCLUSIONS
We applied LLUNPIY, a CA model, in order to
attempt simulations of 1877 primary lahars occurred
in Cutuchi Valley, south west sector of Cotopaxi
volcano. A careful analysis was performed in order
to obtain the most faithful reconstruction of such a
catastrophic event.
Simulations were performed by desktop pc with
Processor Intel(R) core i7, CPU 2.8GHz and
NVIDIA Quadro FX 580 video card. The CA is
1154x1733 cells large.
The adopted programming language is C++, the
model is implemented in a “skeleton” fashion,
developed for MCA, where the transition function is
divided into the “elementary processes” of
LLUNPIY. Such elementary processes are executed
LLUNPIYPreliminaryExtensionforSimulatingPrimaryLahars-Applicationtothe1877CataclysmicEventofCotopaxi
Volcano
373
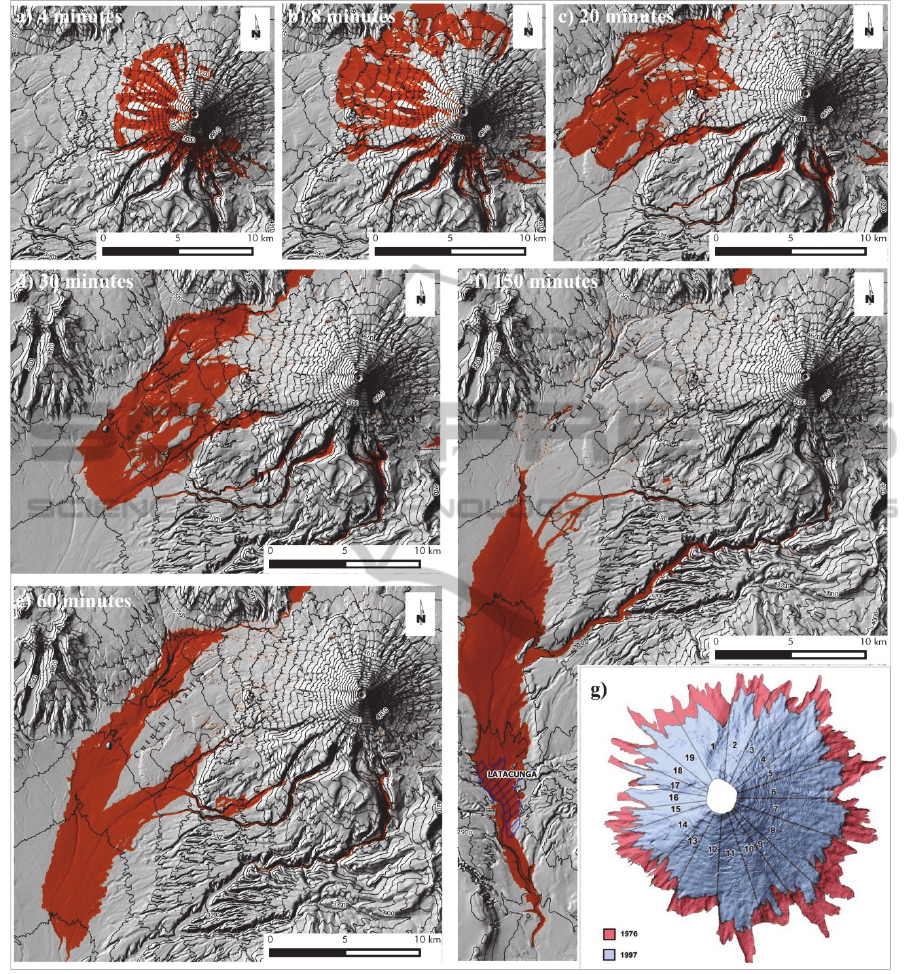
Figure 6: a), b), c), d), e), f) Time steps of glacier melting simulation by trigger moment; g) 1976 glacier extension
considered in simulation (from Cáceres et al. 2004).
sequentially in the same order as in section 3.
Parallelism was not explicitly activated and the
simulation average time is now 5 days, because the
implementation of LLUNPIY is not optimized; an
optimisation is in progress, it will speed simulations
up to 2 days. A parallel version for GPGPU will be
developed when the model will be completed for
both primary and secondary lahars, in the same way
as Spataro et al. (2008).
Some points, which can be improved in the
future research work, have to be considered:
We operated on the current morphology; some
corrections have to be produced in order to approach
the pre-event morphology and to tune better the
parameters of LLUNPIY.
Initial velocity of the lahars in the case of “many
sources simulations” is null; such simulations can be
repeated, starting with an opportune velocity by
SIMULTECH2015-5thInternationalConferenceonSimulationandModelingMethodologies,Technologiesand
Applications
374

varying the model and introducing a “lahar source”;
The immediate melting of the Cotopaxi icecap
descends from the worst hypothesis among the
possible ones, regarding the first phase of the
phenomenon; it is important to test the other
hypotheses.
Anyway, the results of these preliminary
simulations demonstrate that the CA model
LLUNPIY is working appropriately, if we consider
the partial, sometime rough data concerning the
event (Mothes et al., 2014) and its possible
improvements.
The simulations were acceptable in terms of
reproducing the global dynamics of the events, such
as velocity and height of detrital flow. Simulated
lahar path and invaded area agree with real (partially
reconstructed) one.
Times are not respected: in simulations, lahars
reached Latacunga about 30 minutes later than
reported in the chronicles of the time (Wolf, 1878).
This discrepancy could depend on some imprecision
of chronicles or on the increased length of paths in
the simulation because of space discretisation or
both; we will investigate such a problem by
considering these different viewpoints.
Our main future goal concerns the simulation of
the overall phenomenon, considering the total icecap
melting or partial melting by the effect of pyroclastic
bombs. If data will be available, we plan simulating
lahars toward the Quito region and the production of
hazard scenarios for possible new eruptions of
Cotopaxi volcano.
ACKNOWLEDGEMENTS
The authors are grateful to Patricia Mothes,
Researcher at IGEPN for obtaining data concerning
the Cotopaxi volcano and 1877 eruption, useful
information, advices and comments.
The authors thank William Spataro and Maria
Vittoria Avolio for critical revision of the
manuscript, suggestions and useful advices.
REFERENCES
Avolio M. V., Crisci, G. M., Di Gregorio, S., Rongo, R.,
Spataro, W. G., Trunfio, A., 2006. SCIARA γ2: an
improved Cellular Automata model for Lava Flows
and Applications to the 2002 Etnean crisis. Computers
& Geosciences, vol 32.
Avolio, M. V., Crisci, G. M., D’Ambrosio, D., Di
Gregorio, S., Iovine, G., Rongo, R., Spataro, W., 2003.
An extended notion of Cellular Automata for surface
flows modelling. WSEAS Transactions on Computers.
Avolio, M. V., Di Gregorio, S., Lupiano, V., Mazzanti, P.,
2013. SCIDDICA-SS3: A New Version of Cellular
Automata Model for Simulating Fast Moving
Landslides. The Journal of Supercomputing,65.
SPRINGER.
Avolio, M. V., Di Gregorio, S., Lupiano, V., Mazzanti, P.,
Spataro, W., 2010. Application context of the
SCIDDICA model family for simulations of flow-like
landslides. In Proceedings of the 2010 international
conference on scientific computing, Las Vegas (USA).
Avolio, M. V., Di Gregorio, S., Spataro, W., Trunfio,
G.A., 2012. Theorem about the algorithm of
minimization of differences for multicomponent
cellular automata. In ACRI 2012, SPRINGER
VERLAG.
Avolio, M. V., Lupiano, V., Mazzanti, P., Di Gregorio, S.,
2008. Modelling combined subaerial-subaqueous
flow-like landslides by cellular automata. In ACRI
2008. SPRINGER VERLAG.
Avolio, M.V ., Lupiano, V., Mazzanti, P., Di Gregorio, S.,
2009. A Cellular Automata Model for Flow-type
Landslide with Simulations of Subaerial and
Subaqueous cases. In Proceedings of EnviroInfo 2009.
Berlin, Germany, vol. 1, p. 131-140.
Barclay, J., Alexander, J., Susnik, J., 2007. Rainfall-
induced lahars in the Belham Valley, Montserrat, West
Indies. Journal of the Geological Society, London 164.
Cáceres B., Ramírez J., Francou B., Eissen J.P., Taupin J.
D., Jordan E., Ungerechts L., Maisincho L., Barba D.,
Cadier E., Bucher R., Peñafiel A., Samaniego P.,
Mothes P., 2004. Determinación del volumen del
casquete de hielo del volcán Cotopaxi. Informe
INAMHI, IRD, IG-EPN, INGEOMINAS.
Costa, J. E., 2004. Hydraulic modeling for lahar hazards at
Cascades volcanoes. Environmental and Engineering
Geosciences £.
Crisci G. M., Di Gregorio S., Rongo R., Spataro W., 2005.
PYR: a Cellular Automata model for pyroclastic flows
and application to the 1991 Mt. Pinatubo eruption,
Future Generation Computer Systems, 21.
D’Ambrosio, D., Di Gregorio, S., Gabriele, S., Gaudio, R.,
2001. A Cellular Automata Model for Soil Erosion by
Water. Physics and Chemistry of the Earth, EGS, Part
B 26(1).
Di Gregorio, S., Serra R., 1999. An empirical method for
modelling and simulating some complex macroscopic
phenomena by cellular automata. Future Generation.
Computer Systems.
Hoblitt, R. P., Miller, C. D., Scott, W. E., 1987. Volcanic
Hazards with Regard to Siting Nuclear-Power Plants
in the Pacific Northwest. U.S. Geological Survey
Open-File Report.
Lupiano V., Avolio M. V., Anzidei M., Crisci G. M., Di
Gregorio S., 2014a. Susceptibility Assessment of
Subaerial (and/or) Subaqueous Debris-Flows in
Archaeological Sites, Using a Cellular Model. In
Lollino G. et Al. (Eds.) Engineering Geology for
Society and Territory, - Volume 8, pp 405-408
LLUNPIYPreliminaryExtensionforSimulatingPrimaryLahars-Applicationtothe1877CataclysmicEventofCotopaxi
Volcano
375

Springer Verlag. DOI: 10.1007/978-3-319-09408-
3_70.
Lupiano V., Avolio M. V., Di Gregorio S., Peres D. J.,
Stancanelli L. M., 2014b. Simulation of 2009 debris
flows in the Peloritani Mountains area by SCIDDICA-
SS3. Proceeding of 7th WSEAS International
Conference on Engineering Mechanics, Structures,
Engineering Geology, Salerno (Italy), pp. 53-61,
ISBN: 978-960-474-376-6.
Machado, G., Lupiano, V., Avolio, M. V., Gullace, F., Di
Gregorio, S., 2015. A cellular model for secondary
lahars and simulation of cases in the Vascún Valley,
Ecuador. Submitted to Journal of Computational
Science.
Machado, G., Lupiano, V., Avolio, M. V., Di Gregorio, S.,
2014. LLUNPIY: Un modelo de Autómatas Celulares
para la simulación de Lahares Secundarios, In II
Wordshop de Ciencia, Innovación, Teconología y
Saberes, At Universidad Nacional de Chimborazo,
Riobamba, Ecuador.
Machado, G., Lupiano, V., Avolio, M. V., Di Gregorio, S.,
2014. A Preliminary Cellular Model for Secondary
Lahars and Simulation of 2005 Case of Vascún
Valley, Ecuador, In ACRI 2014, SPRINGER
VERLAG.
Major, J. J., Pierson, T. C., Dinehart, R. L., Costa, J. E.,
2000. Sediment yield following severe volcanic
disturbance a two-decade perspective from Mount St.
Helens. Geology, 28.
Manville, V., Hodgson, K. A., Houghton, B. F., Keys, J.
R. H., White, J. D. L., 2000. Tephra, snow and water:
complex sedimentary responses at an active snow-
capped stratovolcano, Ruapehu, New Zealand. Bulletin
of Volcanology, 62.
Manville, V., Major, J. J., Fagents, S. A., 2013. Modeling
lahar behavior and hazards, In: Modeling Volcanic
Processes The Physics and Mathematics of Volcanism,
Cambridge University Press, Cambridge.
Mothes, P., Vallance, J. W., 2014. Volcanic Hazards,
Risks, and Disasters, In Lahars at Cotopaxi and
Tungurahua Volcanoes, Ecuador, Elsevier Inc., New
York.
Muñoz-Salinas, E., Castillo-Rodríguez, M., Manea, V.,
Manea, M., Palacios, D., 2009. Lahar flow simulations
using LAHARZ program: application for the
Popocatépetl volcano, Mexico. J. Volcanol. Geotherm.
Res. 182.
O'Brien, J. S., Julien, P. Y., Fullerton, W. T., 1993. Two-
dimensional water flood and mudflow simulation. J.
Hydraul. Eng. ASCE 119 (2).
Pierson, T. C., Janda, R. J., Thouret, J. C., Borrero C. A.,
1990. Perturbation and melting of snow and ice by the
13 November 1985 eruption of Nevado del Ruiz,
Colombia, and consequent mobilization, flow and
deposition of lahars. J. Volcanol. Geotherm.
Pistolesi, M., Cioni, R., Rosi, M., Aguilera, E., 2014.
Lahar hazard assessment in the southern drainage
system of Cotopaxi Volcano, Ecuador: Results from
multiscale lahar simulations. Geomorphology 207.
Pitman, E. B., Nichita, C. C., Patra, A. K., Bauer, A. C.,
Sheridan, M. F., Bursik, M., 2003. Computing
Granular Avalanches and Landslides. Physics of
Fluids 15(12) Press, United States.
Schilling, S. P., 1998. LAHARZ: GIS Programs for
Automated Mapping of Lahar-inundation Hazard
Zones: U.S. Geological Survey Open-File Report 98-
638.
Smith, G. A., Fritz, W. J., 1989. Volcanic influences on
terrestrial sedimentation. Geology.
Sodiro, L., 1877. Relación sobre la eupción del Cotopaxi
acaecida el dia 26 de Junio de 1877. Imprenta
Nacional, Quito, Ecuador.
Spataro, W., D'Ambrosio, D., Spingola, G., Zito, G.,
Rongo, R., 2008. libAuToti, A Parallel Cellular
Automata Library for Simulation: An example of
Application to Landslides. Proceedings of the 2008
Summer Computer Simulation Conference, June 16-
19, 2008, Edinburgh, UK.
Vallance, J. W., 2000. Lahars. In: Sigurdsson, H. (Ed.),
Encyclopedia of Volcanoes. Academic.
Vallance, J.W., 2005. Volcanic debris flows. In Debris
Flow Hazards and Related Phenomena. Praxis-
Springer, Berlin and Heidelberg.
Williams, R., Stinton, A. J., Sheridan, M. F., 2008.
Evaluation of the Titan2D two-phase flow model
using an actual event: Case study of the 2005 Vazcún
Valley Lahar, Journal of Volcanology and Geothermal
Research 177.
Wolf, T., 1878. Memoria sobre el Cotopaxi y su Última
Erupción Acaecida el 26 de Junio de 1877. Imprenta
del Comercio, Guayaquil, Ecuador.
SIMULTECH2015-5thInternationalConferenceonSimulationandModelingMethodologies,Technologiesand
Applications
376
