
Simulation and Analysis of the Signal Transmission in the Optical
Transmission Medium
Rastislav Róka and Filip Čertík
Institute of Telecommunications, Slovak University of Technology in Bratislava, Ilkovičova 3, Bratislava, Slovakia
Keywords: Optical Transmission Medium, Linear and Nonlinear Effects, Simulation Model.
Abstract: This paper presents a possible way for simulating a signal transmission in the optical transmission medium.
A main attention is focused on characteristics and analysis of linear and nonlinear effects that influence
optical signals transmitting in the environment of optical fibers. Simultaneously, functional blocks created
in the Matlab Simulink programming environment for particular effects are presented in the proposed
simulation model. At the same time, the paper present a simulation of the optical transmission system that
can include various modulation and encoding techniques utilized for the signal transmission. In addition,
a comparison of results from the proposed simulation model with measurements on real optical transmission
paths is introduced.
1 INTRODUCTION
Nowadays, an interest in the signal transmission
through optical fibers rapidly increases due to the
transmission bandwidth. Constructing new optical
transmission paths can be time consuming,
expensive and sometimes not available solution. In
the electric domain, utilizing new advanced signal
processing can lead to increasing of the transmission
capacity. Such solutions can be easily integrated.
With increasing of modulation rates, linear and
nonlinear influences on the transmitted optical signal
are growing and by this way additional bit errors in
information signals are generating. Therefore, it is
important to design and simulate the influence on
advanced signal processing techniques in the optical
transmission system with respect to its linear and
nonlinear effects. The simulation gives transmission
boundaries of each advanced signal processing
techniques for the designed optical system and
allows comparing all the solutions for the optical
system before deployment. The simulation allows
increasing the data rate and the transmission range
of deployed optical transmission system using
advanced signal processing techniques and allows
designing a new optical transmission system with
different optical fibers.
In (Ahmed, 2007), an optical link simulator was
designed like a platform on which the transmission
and optimization of communication systems could
be carried out. The simulator has been developed
under the Simulink environment in the form of
modules.
In (Del Río Bellisco, 2004), a software tool
developed for simulating of optical communication
systems was presented. The simulation allows
determination of the spectral and frequency
responses of particular blocks and the whole system.
The tool has been developed using the Matlab
programming environment.
The accurate determination of fiber
nonlinearities is an important issue in the design of
optical communication systems. In (Batagejl, 2002),
the need of knowing fiber non-linear coefficients in
global optical networks was presented.
First, basic characteristics of the optical fiber are
introduced. The paper presents created simulation
blocks in detail for each environmental effect in the
optical transmission medium. The analysis of effects
is shown on the transmission of noncoherent OOK
modulated signals via the standard single-mode
fiber. In the final part, the comparison of results
from simulation models with measured parameters
from the Ciena system is introduced.
219
Róka R. and
ˇ
Certík F..
Simulation and Analysis of the Signal Transmission in the Optical Transmission Medium.
DOI: 10.5220/0005569602190226
In Proceedings of the 5th International Conference on Simulation and Modeling Methodologies, Technologies and Applications (SIMULTECH-2015),
pages 219-226
ISBN: 978-989-758-120-5
Copyright
c
2015 SCITEPRESS (Science and Technology Publications, Lda.)

2 ANALYSIS OF THE OPTICAL
TRANSSMISION MEDIUM
Each optical fiber represents a transmission system,
which is frequency dependent. Pulse propagation
inside this transmission system can be described by
the nonlinear Schrödinger equation (NLSE), which
is derivate from Maxwell equations. From the NLSE
equation we can expresses effects in optical fibers
that can be classified as:
a) linear effects, which are wavelength
depended,
b) nonlinear effects, which are intensity
depended.
2.1 Linear Effects
Major impairments of optical signals transmitted via
optical fiber are mainly caused by linear effects - the
dispersion and the attenuation. The attenuation limits
power of optical signals and represents transmission
losses. In practical way, it is a power loss that
depends on a length of the transmission path. Total
signal attenuation a [dB] is defined for a particular
wavelength, which is defined by
0
10
log10
P
P
dBa
i
(1)
where P
i
is the input power and P
0
is the output
power.
The attenuation of optical fibers is mainly caused
by material absorption losses, radiation scattering
and by bending losses (Saleh and Teich, 1991).
Nowadays, optical transmission systems are able to
minimize impact of the attenuation by deploying
regenerators or all optical amplifiers like Raman or
EDFA amplifiers increasing the optical system
range. The attenuation block is a part of the
Stimulated Raman and Brillouin scattering block
shown in fig.10.
Another source of linear effects represents the
dispersion that causes broadening of optical pulses
in time and phase shifting of signals at the fiber end.
There are three dispersion types:
modal dispersion,
chromatic dispersion,
polarization mode dispersion.
The mode dispersion occurs in multi-mode fibers
due to unequal propagation constants of different
modes. The paper focused on the single-mode fiber
SMF and long-haul transmission systems, so the
modal dispersion is not considered (Binh, 2010).
The chromatic dispersion CD is caused by
a different time of the spreading wave through the
fiber for different wavelengths and it depends on the
spectral width of the pulse. The CD influences the
transmission signal by broadening the optical pulse
in time and by phase shifting the signal phase
(Keiser, 2003). To characterize the CD effect, the
group velocity delay GVD parameter is measured.
The GVD represents the amount of the optical pulse
broadening. The relation between the phase shift and
the optical pulse broadening cause by CD is given
by two equations
m
df
d
t
2
1
(2)
2
2
2
1
m
df
d
GVD
(3)
where t is a time, φ represents phase and f
m
represents modulation frequency.
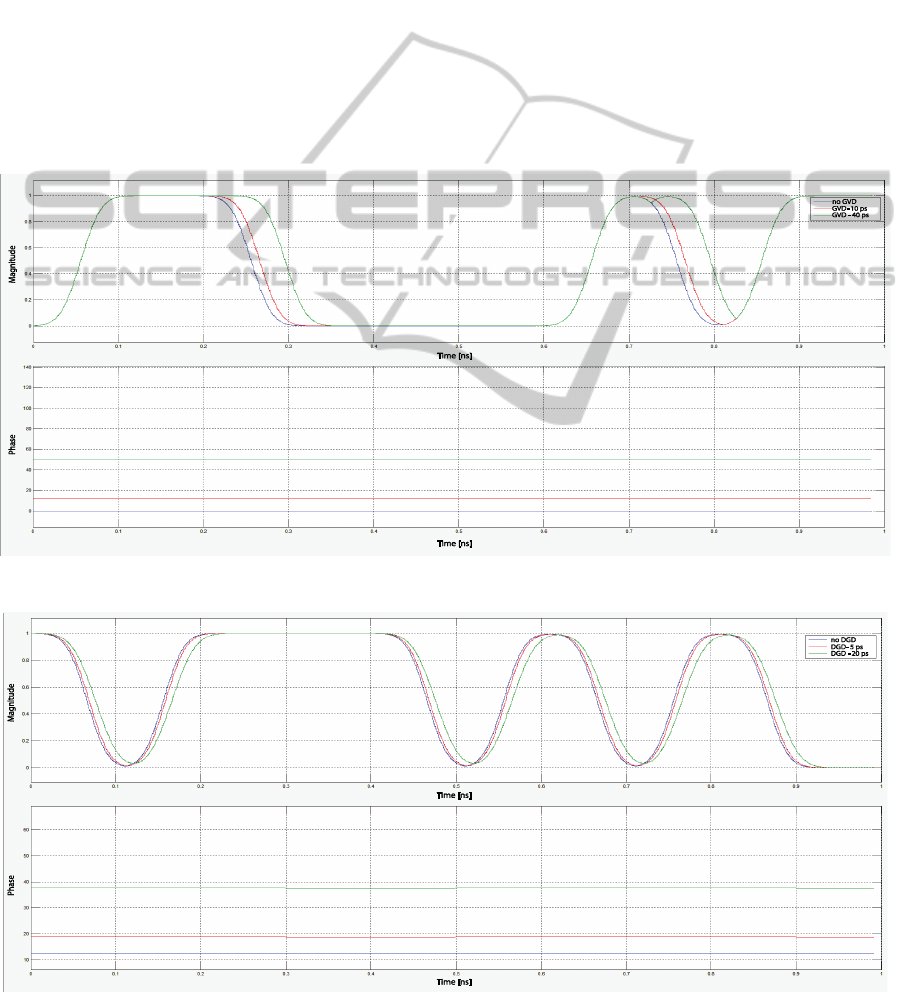
The CD effect simulation is based on equations (2)
and (3). The CD block generates GVD values that
broaden a propagating transmission signal and
change its phase. The CD block is shown in fig.1
and consists of the GVD generator that adjusts the
variable integer delay using constant amplitude
representing the GVD. The delayed signal is created
with boundaries of the broadening. Both signals are
merged in the CD block, where a phase shift and
a power decrease are calculated. The output signal is
driven to the Complex phase shift block, where
a signal is shifted.
Figure 1: The CD block.
Another dispersion that occurs in the single-mode
fiber is called the polarization mode dispersion
PMD. The PMD is a random phenomenon that can
be only statistically evaluated. The light mode
transferred via the single mode optical fiber consists
of two modes on different polarization planes which
result from propagations principle states of
polarization PSP. In ideal optical fibers, two
polarization modes would propagate with the same
velocity. But in a reality, the optical fiber is
nonsymmetrical and imperfect and causes different
velocity of these two polarization modes. This effect
is also called the birefringence and it is equal to
differences Δn between relative refractive indexes
for ordinary n
0
and extraordinary n
e
rays given by
SIMULTECH2015-5thInternationalConferenceonSimulationandModelingMethodologies,Technologiesand
Applications
220

the equation
nnn
e 0
(4)
The group-delay difference between slow and fast
polarization modes is called the differential group
delay DGD measured in picoseconds. The DGD
between two orthogonal states of polarization SOP
causes the PMD. As a pulse propagates through
a light-wave transmission system with the PMD, the
pulse splits into fast and slow modes, and therefore
becomes broadened and changing the phase of
propagating pulse (Jamaludin, 2005).
The PMD effect simulation is similar to the CD
simulation. The PMD block is shown in fig.2 and is
based on equations (2) and (3). The difference is that
the PMD block uses the Random number generator
generating DGD values with the Gaussian
distribution. The PMD effect is negligible in
comparison with the CD and therefore we must
compensate the CD effect to highlight the PMD
effect on the transmitted signal. When the CD is
compensated, the high data rate signal can be
transmitted, where the PMD with its stochastically
behavior becomes more relevant and represents
boundaries for the transmission rate.
Figure 2: The PMD block.
2.2 Nonlinear Effects
These nonlinear effects play an important role in the
long haul optical signal transmission. We can
classify nonlinear effects by following way:
Kerr nonlinearities are self-induced effects,
where the phase velocity of the pulse depending on
the pulse’s own intensity. The Kerr effect describes
a change in the fiber refractive index due to
electrical perturbations. Due to the Kerr effect, we
are able to describe FWM, SPM and XPM effects,
Scattering nonlinearities occur due to a photon
inelastic scattering to lower energy photons. The
pulse energy is transferred to another wave with
a different wavelength.
2.2.1 The Four-wave Mixing Effect
The four-wave mixing FWM effect represents
a parametric interaction among waves satisfying
a particular phase relationship called the phase
matching. This nonlinear effect occurs only in
systems that carry more wavelengths through the
optical fiber and it is classified as a third-order
distortion phenomenon. The interaction between
waves generate the fourth wave that with angular
frequency ω
k
given by
321
k
(5)
The nonlinear interaction generates new frequency
components of the material polarization vector,
which can interfere with input fields if a phase
matching condition is obtain. The most frequency
components fall away from our original bandwidth
or near it. Frequency components that directly
overlap with bandwidth will cause an interference
with original waves (Singh, 2007). The power of
new generated waves can be obtain by solving
coupled propagation equations of four interacting
waves, which leads to equation (6) that mainly
depends on the power of neighbor channels, the
channel spacing and on the dispersion.
e
AAALdA
l
eek
2
3
2
2
2
1
2222
4
(6)
where factor η is the FWM efficiency, γ is the
nonlinear coefficient, L
e
is the effective length,
A
1
2
(z), A
2
2
(z), A
3
2
(z) are powers of input waves, l is
the fiber length, α is the attenuation and d
e
the so-
called degeneracy factor (equal to 3 if the
degenerative FWM is considered, 6 otherwise).
Figure 3: The block scheme for generating additional
wavelength channels.
The block design for the FWM effect requires
the WDM technology and thus the generation of
additional wavelength channels. The data signal
generation of additional wavelength channels is
shown in fig.3. The additional neighbor channels are
mixed in the WDM block and driven to the FWM
block, which is shown in fig.4. The block scheme
first verifies the phase matching conditions and then
mixes the neighbor signals using the equation (6) if
phase conditions are satisfied.
SimulationandAnalysisoftheSignalTransmissionintheOpticalTransmissionMedium
221

Figure 4: The FWM block.
2.2.2 Self-phase and Cross-phase
Modulation Effects
The self-phase modulation SPM and the cross-phase
modulation XPM effects have an important impact
on high data speed communication systems that use
the dense wavelength division multiplexing DWDM.
The SPM effect occurs due to Kerr effect in which
the refractive index of optical fiber increases with
the optical intensity decreasing the propagation
speed and thus inducts the nonlinear phase shift. The
XPM effect is very similar to the SPM in which the
intensity from different wavelength channels
changes the signal phase and thus the XPM occurs
only in WDM systems. In fact, the XPM converts
power fluctuations in a particular wavelength
channel to phase fluctuations in other co-
propagating channels (Iannone, 1998). Both, SPM
and XPM effects results to spectral broadening and
distortion of the pulse shape, where spectral
broadening can be described by equation (7) and
phase shift by equation (8).
dt
d
0
'
(7)
where ω' is the signal frequency influenced with the
SPM effect, ω
0
is the initial signal frequency
ji
ji
i
t
I
t
I
z
n
2
2
2
(8)
where the first term in bracket represents the SPM
effect and the second term represents XPM effect.
In the equation (8), the factor 2 has its origin in
a form of the nonlinear susceptibility and represents
the XPM twice as effective as the SPM for the same
power amount. The XPM effect affects the signal
only the interacting signals superimpose in
time (Yasser, 2012). The XPM effect can decrease
a system performance even greater than the XPM
effect, especially in case of 100 channel systems.
The design of the SPM and XPM block is shown
in fig.5, where the SPM&XPM block calculates the
amount of spectral broadening using the equation
(8). Both outputs are driven to the Frequency
Shifting block, where the signal is spectrally
broaden.
Figure 5: The SPM & XPM block.
2.2.3 Stimulated Raman and Stimulated
Brillouin Scattering Effects
The Stimulated Brillouin Scattering SBS and
Stimulated Raman Scattering SRS effects influence
the intensity of the transmitted signal. In the SBS
case, the acoustic wave changes the frequency of
several photons that results to interference with
a transmitted signal. This frequency shifted wave is
propagating only in the opposite direction as the
transmitted signal and the power can be described by
ssspB
s
IIIg
dz
dI
(9)
where the I
p
is a pump signal, I
s
represent
transmitted signal intensity, g
R
is stimulated Raman
gain coefficient and α
s
and α
p
are losses of signals.
The SRS effect is similar to the SBS, were the
spectral width is wide and interferes with several
transmitted signals. The SRS effect propagates in
both directions (Cotter, 1993). Both stimulated
scattering effects represent a noise in optical
transmission systems. The power of the frequency
shifted wave can be described by
ssspR
s
IIIg
dz
dI
(10)
where the I
p
is a pump signal, I
s
represent
transmitted signal intensity, g
R
is stimulated Raman
gain coefficient and α
s
and α
p
are losses of signals.
The SRS&SBS block can be designed by adding
additional signal channels using a combination of
two equations. The equations include the transmitted
signal attenuation coefficients and therefore we can
design the common SRS&SBS and attenuation
block. The final block is shown in fig.6. Assuming
the SM fiber, the SRS downshifts the neighbor
signals by about 13,2 THz with the Raman band
around 5 THz and the SBS downshifts about 11 GHz
with the Brillouin band less than 20 MHz.
Figure 6: The SRS, SBS and attenuation block.
SIMULTECH2015-5thInternationalConferenceonSimulationandModelingMethodologies,Technologiesand
Applications
222
2.2.4 Modelling of Transmission Signals
Influenced Bynonlinear Effects
Following figures are displaying graphical
presentations of transmitted signals that are
influenced by nonlinear effects in the optical
transmission medium. The comparison of signals
without and with the CD influence is shown in fig.7.
The PMD influence on a transmitted signal is shown
in fig.8. The FWM influence on the amplitude of
a transmitted signal is shown in fig.9. The fig.10
shows the signal phase shift due to phase modulation
effects. The SRS and SBS influences on
a transmitted signal with the attenuation are shown
in fig.11.
3 SIMULATION OF THE
OPTICAL TRANSMISSION
SYSTEM
The presented simulation model comes out from the
simulation model for optical communications
introduced in (Róka, 2012) (Róka and Čertík, 2014).
A modeling is performed in the Matlab Simulink
2014. The simulation model presents an influence of
linear and nonlinear effects at the signal
transmission in the optical transmission media. To
verify simulation model, we have prepared
a comparison of two optical transmission paths
measured in cooperation with the company Orange
Slovakia. The optical path_1 consists of the 59.2 km
standard SM fiber (ITU-T G.652) with the 10 Gb/s
Figure 7: The CD influence on a transmitted signal.
Figure 8: The PMD influence on a transmitted signal.
SimulationandAnalysisoftheSignalTransmissionintheOpticalTransmissionMedium
223
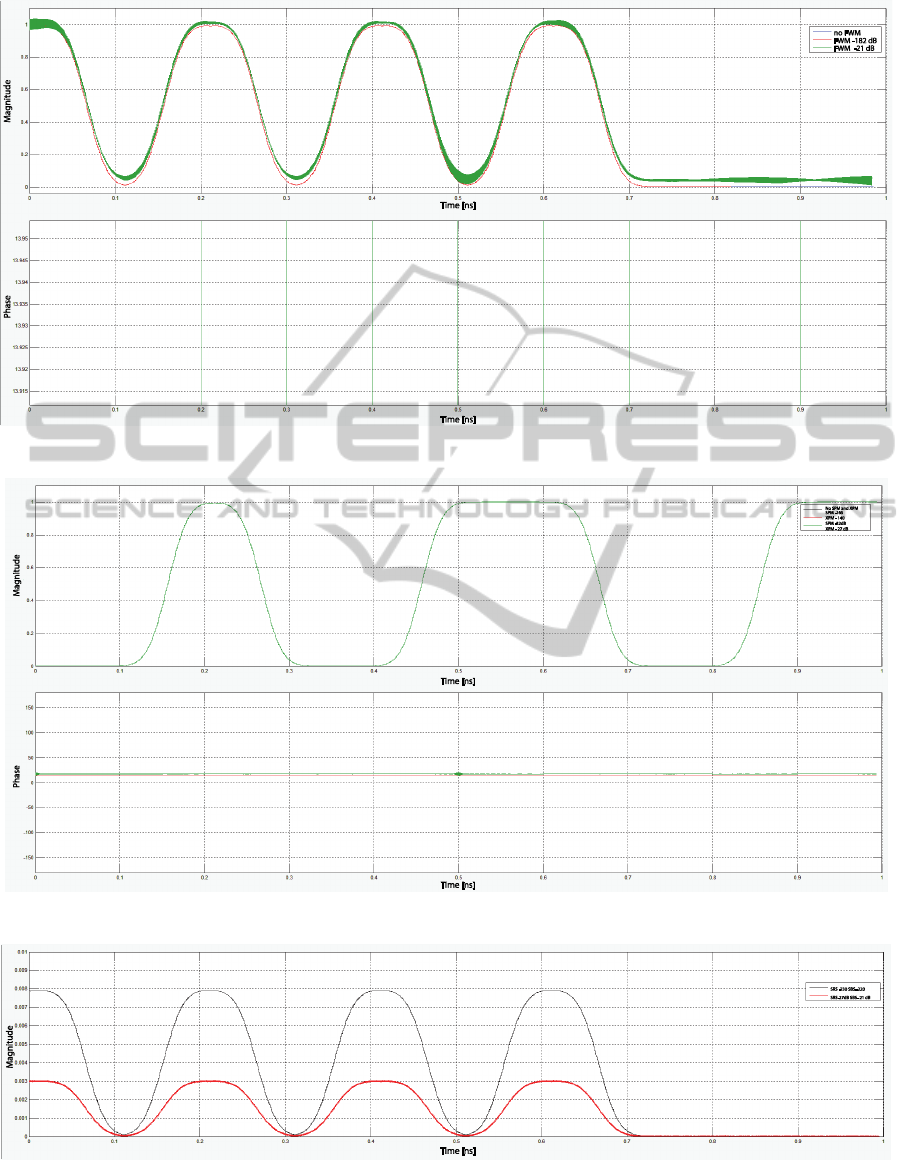
Figure 9: The FWM influence on a transmitted signal.
Figure 10: The SPM and XPM influences on a transmitted signal with the phase shift.
Figure 11: The SRS and SBS influences on a transmitted signal with the generated noise.
noncoherent OOK modulated signal using 80
channels. The optical path_2 consists of 170,7 km
standard SM (ITU-T G.652) fiber with 10 Gb/s
noncoherent OOK modulated signal using 80
SIMULTECH2015-5thInternationalConferenceonSimulationandModelingMethodologies,Technologiesand
Applications
224

channels. We examine the transmitted signal with
the frequency 193,4 THz. The path_1 is using only
one the erbium doped fiber amplifier EDFA at the
fiber end, while the path_2 is using additional 3
EDFA amplifiers every 40 km. The simulation
model for the path_1 is shown in fig.12 and the
simulation model for the path_2 is shown in fig 13.
For describing the signal transmission in the
optical transmission medium, we can calculate a bit
error rate parameter BER. The BER calculation for
each simulation model is done by comparing input
and output bits. The simulation results for the optical
path_1 and optical path_2 shows the BER parameter
higher than 10
-12
satisfying the transmission
condition. Both simulation models use the Reed-
Solomon Coding RS (255.239) that can enhance the
system BER parameter.
Figure 12: The optical path_1 simulation model.
Table 1: The comparison of the optical path_1 parameters.
Parameters Measured Simulated
Rx power
(dBm)
-13,2 -13,4
OSNR 25,9 24,3
PMD (ps) 1,06 1,25
SPM (dB) 0,87 1,22
XPM (dB) -57,59 -60,5
FWM (dB) N/A -124,3
Q 7,99 8,1
BER >10
-15
>10
-12
Figure 13: The optical path_2 simulation model.
Table 2: The comparison of the optical path_2 parameters.
Parameters Measured Simulated
Rx power
(dBm)
-13,69 -12,3
OSNR 21,07 20,9
PMD (ps) 1,74 1,83
SPM (dB) 1,03 1,1
XPM (dB) -42,02 -40,5
FWM (dB) N/A -112
Q 6,27 6,2
BER >10
-15
>10
-12
4 CONCLUSIONS
This contribution analyses linear and nonlinear
effects in the optical transmission medium. Using
created specific blocks in the Matlab Simulink, we
can simulate the influence of each optical fiber
effects on transmitted signals utilizing WDM optical
systems. We present results of the simulation for
the noncoherent OOK modulation signal
transmission in two different optical paths. Finally,
we compare analyzed results acquired from created
simulation models with measured parameters from
the real optical transmission paths.
5 FUTURE WORK
In future analysis, we can design a new combination
of high-bit rate coherent modulation formats, such as
QPSK, 8PSK, 16QAM and FSK, with different
encoding techniques, such as BCH, LDPC, for
analyzing and implementing in any optical
transmission systems.
ACKNOWLEDGEMENTS
This work is a part of research activities conducted
at Slovak University of Technology Bratislava,
Faculty of Electrical Engineering and Information
Technology, Institute of Telecommunications,
within the scope of the projects KEGA No. 039STU-
4/2013 “Utilization of Web-based Training and
Learning Systems at the Development of New
Educational Programs in the Area of Optical
Transmission Media”.
SimulationandAnalysisoftheSignalTransmissionintheOpticalTransmissionMedium
225

REFERENCES
Ahmed, G. H., Ali, O., 2007. Design and conception of
optical links simulator for telecommunication
applications under Simulink environment,
In: ELECTROSCIENCE 2007, pp.52-57, ISSN 1790-
5117.
Batagejl, B., 2002. Need of knowing non-linear coefficient
in optical networks, In: WSEAS 2002.
Binh L. N., 2010. Optical Fiber Communication Systems,
CRC Press.
Cotter D. 1993. Nonlinearity in optical fiber
communications, Springer Netherlands, Vol.49,
pp.322-362.
Del Río Bellisco, J., Alpuente Hermosilla, J., Sánchez
Montero, R., López Espí, P.L., 2004. Education tool
for optical communication engineering teaching,
In: WSEAS 2004.
Iannone E., Matera F., Mecozzi A., Settembre M., 1998.
Nonlinear Optical Communication Networks, John
Wiley and sons, pp.20-50, TK5103.59.N66.
Jamaludin Z., Abas A. F., Noor A. S. M., Abfullah M. K.,
2005. Issues in polarization mode dispersion (PMD)
for high speed fiber optics transmission. In: Suranaree
J. Sci. Technol., Vol. 12 No. 2.
Keiser G., 2003. Optical fiber communications, John
Wiley & Sons, Inc.
Róka R., 2012. Fixed Transmission Media. In: Technology
and Engineering Applications of Simulink, InTech,
Rijeka (Croatia).
Róka R., Čertík F., 2014. Simulation Tools for Broadband
Passive Optical Networks. In: Simulation
Technologies in Networking and Communications:
Selecting the Best Tool for the Test, CRC Press in
Taylor&Francis Group, Boca Raton (USA),
ISBN 978-1-4822-2549-5.
Saleh B. E. A., Teich M. C., 1991. Fundamentals of
photonics, Wiley-Interscience.
Singh S.P., Singh N., 2007. Nonlinear Effects in Optical
Fibers: Origin, Management and Applications. PIER
73, Progress In Electromagnetics Research, 249-275.
Yasser H. A., 2012. Polarization Losses in Optical Fibers.
In: Recent Progress in Optical Fiber Research,
InTech.
SIMULTECH2015-5thInternationalConferenceonSimulationandModelingMethodologies,Technologiesand
Applications
226
