Moving Beyond the Twitter Follow Graph
Giambattista Amati
1
, Simone Angelini
1
, Marco Bianchi
1
,
Gianmarco Fusco
2
, Giorgio Gambosi
3
, Giancarlo Gaudino
2
,
Giuseppe Marcone
1
, Gianluca Rossi
3
and Paola Vocca
4
1
Fondazione Ugo Bordoni, Rome, Italy
2
Istituto Superiore delle Comunicazioni e delle Tecnologie dell’Informazione (MiSE-ISCOM), Rome, Italy
3
University of Rome Tor Vergata, Rome, Italy
4
University of Tuscia, Viterbo, Italy
Keywords:
Social Network Analysis, Twitter Graph.
Abstract:
The study of the topological properties of graphs derived from social network platforms has a great importance
both from the social and from the information point of view; furthermore, it has a big impact on designing
new applications and in improving already existing services. Surprisingly, the research community seems to
have mainly focused its efforts just on studying the most intuitive and explicit graphs, such as the follower
graph of the Twitter platform, or the Facebook friends’ graph: consequently, a lot of valuable information is
still hidden and it is waiting to be explored and exploited. In this paper we introduce a new type of graph
modeling behavior of Twitter users: the mention graph. Then we show how to easily build instances of this
graphs starting from the Twitter stream, and we report the results of an experimentation aimed to compare the
proposed graph with other graphs already analyzed in the literature, by using some standard social network
analysis metrics.
1 INTRODUCTION
Twitter is a widespread micro-blogging platform
which allows different user behaviors: posting tweets
(tweeting), following other users, replying to tweets,
mentioning users, labelling tweets (hashtagging), for-
warding tweets generated by other users (retweeting),
etc.
Each of these operations can be used to build a
graph modeling relationships between users, or be-
tween user and contents. The study of the topological
properties of these graphs is of fundamental impor-
tance to evaluate the structure and to predict the evo-
lution of the Twitter network both from the social and
from the information point of view. Additionally, un-
derstanding these graphs is important to improve cur-
rent systems and to design new applications of online
social networks.
The most natural and intuitive graph is the follow
graph (Myers et al., 2014; Kwak et al., 2010), ob-
tained by modeling the following relationship exist-
ing between the Twitter users. This graph has been
already studied to quantitatively gauge the Twitter
network (Kwak et al., 2010); to investigate the role
of Twitter as a social or information network (My-
ers et al., 2014); to identify authoritative user ac-
counts (Java et al., 2007; Weng et al., 2010). In (Bild
et al., 2015) the authors introduce and analyze the
retweet graph, better encoding true interest and trust
relationships among users than the follow graph, and
useful for detecting spammers.
Also other kind of graphs have been considered in
the literature: for example in (Wang et al., 2011) the
authors introduce the hashtag graph where the vertex
set is a set of hashtags and an undirected link between
two hashtags exists if they co-occur in at least one
tweet. This Twitter representation model is used to
derive a sentiment classification of the tweets. In (Ya-
maguchi et al., 2010) the authors introduce the user-
tweet graph. In a user-tweet graph the nodes corre-
spond to user accounts and tweets, and edges rep-
resents both the follow relation and the retweet re-
lationship. In contrast with the follow graph which
is static, this graph is reconstructed whenever a new
612
Amati, G., Angelini, S., Bianchi, M., Fusco, G., Gambosi, G., Gaudino, G., Marcone, G., Rossi, G. and Vocca, P..
Moving Beyond the Twitter Follow Graph.
In Proceedings of the 7th International Joint Conference on Knowledge Discovery, Knowledge Engineering and Knowledge Management (IC3K 2015) - Volume 1: KDIR, pages 612-619
ISBN: 978-989-758-158-8
Copyright
c
2015 by SCITEPRESS – Science and Technology Publications, Lda. All rights reserved

retweet occurs. The user-tweet-graph is used to iden-
tify authoritative users. The same model is used in
(Arxiden, 2013) to measure users influence in terms
of users activities.
Surprisingly, the research community seems to
have not yet taken into consideration many other kind
of graphs that can be easily built and analyzed just by
elaborating a flow of tweets. Some of these graphs
can be extremely interesting both for research and ap-
plicative purpose.
In this paper we introduce a new type of graph: the
mention graph. This graph, presented in Section 2,
can be used to improve the identification of authorita-
tive accounts, to discover active and dynamic commu-
nities, or to assign weights to the follow relationships.
In order to verify the overall structure of our
graph, we built an instance of the mention graph
and we performed a series of quantitative analysis
that are in general used in network analysis (Myers
et al., 2014): the degree distributions, connected com-
ponents, path length distributions; clustering coeffi-
cients.
For further information we also built and analyzed
an instance of the retweet graph in order to compare
our results with those presented in (Bild et al., 2015).
The analysis performed shows that the mention
graph is sound, that is the values obtained are in line
with the expected values and are similar to the same
values for the follow graph as shown in (Myers et al.,
2014).
The paper is organized as follows: in Section 2 we
briefly describe our graph model; in Section 3 we re-
port about our experimentation. Finally, in Section 4
we conclude the work.
2 GRAPH MODELS
We model interactions between Twitter users by
defining the mention graph.
In the mention graph each node represents a Twit-
ter account. A directed edge between two nodes a and
b exists if the account a mentions the account b in at
least one tweet. To record multiple citations, we la-
bel the edge with a list of timestamps corresponding
to each mention, allowing the filtering of edges on the
basis of a temporal parameters. As a design choice,
mentions contained into retweets and replies are ig-
nored.
It is worth to note, with respect to the follow
graph, the mention graph:
• captures the information spreading on the net-
work. The follow relationship tends to better rep-
resent the social ties between users, since users
most likely follow another user on a social ba-
sis. On the counter part, the mention relationship
better represents the information spreading on the
network.
• furthers a deep qualitative analysis of the follow
graph itself. For instance, comparing the follow
and the mention graphs we quantitativelyevaluate
the actual strength of the follow relationship.
• is easier to be built and updated. Since all infor-
mation needed is derivable just parsing tweets, the
graph building process is not affected by the rate
limitations of the Twitter Search API.
In order to compare our mention graph with the
retweet graph presented in (Bild et al., 2015), we also
built an instance of this last kind of graph as follows:
in the retweets graph two nodes, a and b, are con-
nected by a direct edge if a has retweeted at least one
tweet of b. Similarly to the mention graph, times-
tamps of the different retweets between the same user
accounts are stored in a list labeling the corresponding
directed edge, while retweets of retweets are ignored
by design.
3 EXPERIMENTATION
3.1 Building Graph Instances
We perform network analysis of the new mention and
retweet graphs using a Twitter collection that was
built by monitoring the activities of the Italian Pub-
lic Administrations on Twitter. More precisely, the
collection was obtained selecting a list of about 400
Italian seed keywords (e.g. with all Italian minis-
ters, agencies, etc.) and 5000 Twitter authoritative ac-
counts. These accounts were selected by starting from
a few dozens of seed accounts, such as the official ac-
counts of the Prime Minister (@Palazzo
Chigi) and
the Ministers (@Viminale, @MinisteroDifesa etc.),
and completing the list with the inclusion of their fol-
lowing accounts with the highest number of follow-
ers. We have also restricted the tweets to the Italian
language.
In the period from the 7th May to the 23rd May
2015 we collected about 5,604,779 tweets, contain-
ing 469,359 users, 991,589 mentions and 1,041,955
retweets.
3.2 Analysis
We present a preliminary analysis of some topological
features of mention and retweet graphs. In particu-
lar we use the degree distribution, connected compo-
Moving Beyond the Twitter Follow Graph
613
(a) (b)
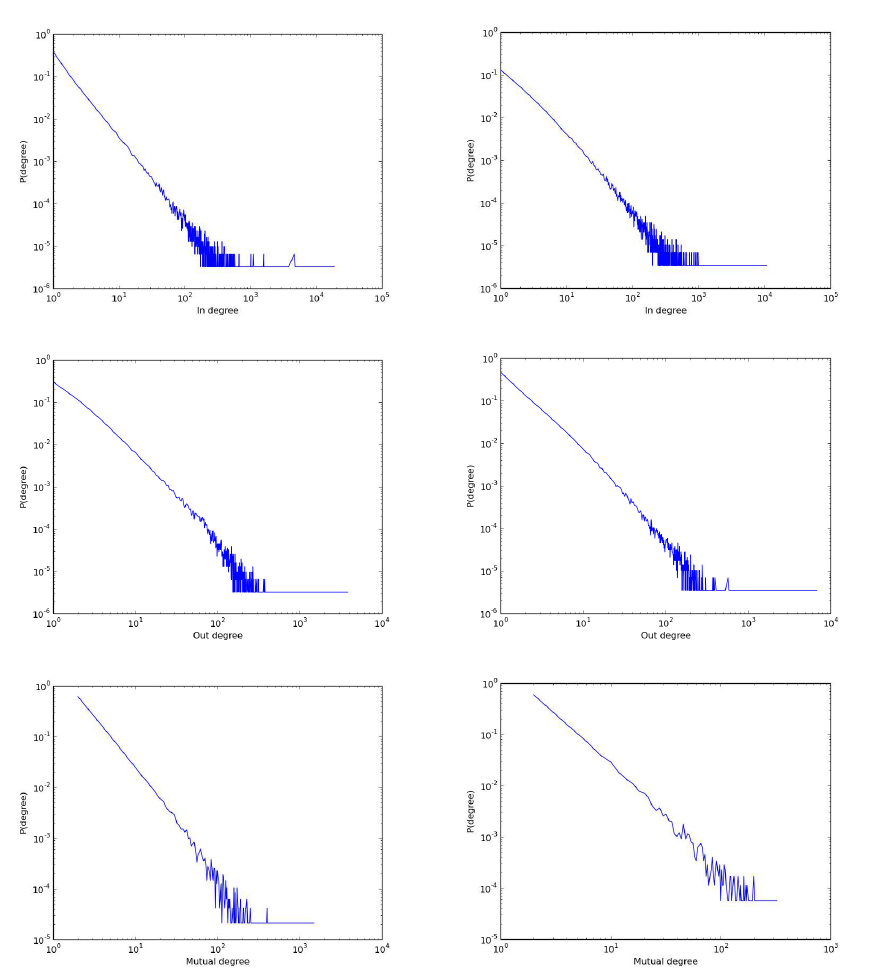
Figure 1: The in-degree, out-degree and mutual-degree distribution of the mention graph (a), of the retweet graph (b).
nents, clustering coefficient, two-hop neighborhood,
path-length distribution measures, that are in general
used in network analysis (Myers et al., 2014).
We also consider the undirected mutual graphs,
for each of these two graphs (mention, retweet): an
edge between x and y of the mutual graph exists when
both (x, y) and (y, x) are edges of the original graph.
Table 1 shows how the size of mutual graphs are
affected by the topological properties of the generat-
ing graphs.
Degree Distributions. We here consider the in-
degree, out-degree and mutual-degree distributions.
The degree distribution provides the ratio of vertices
that have a specific number of links (in-links, out-
links, mutual-links). These distributions are shown in
Figure 1. The Kolmogorov-Smirnov test shows that
the fitting of the degree distributions with the power
law is statistically significant at 99% level of confi-
dence.
Comparing the mention and retweet graphs of Fig-
DART 2015 - Special Session on Information Filtering and Retrieval
614
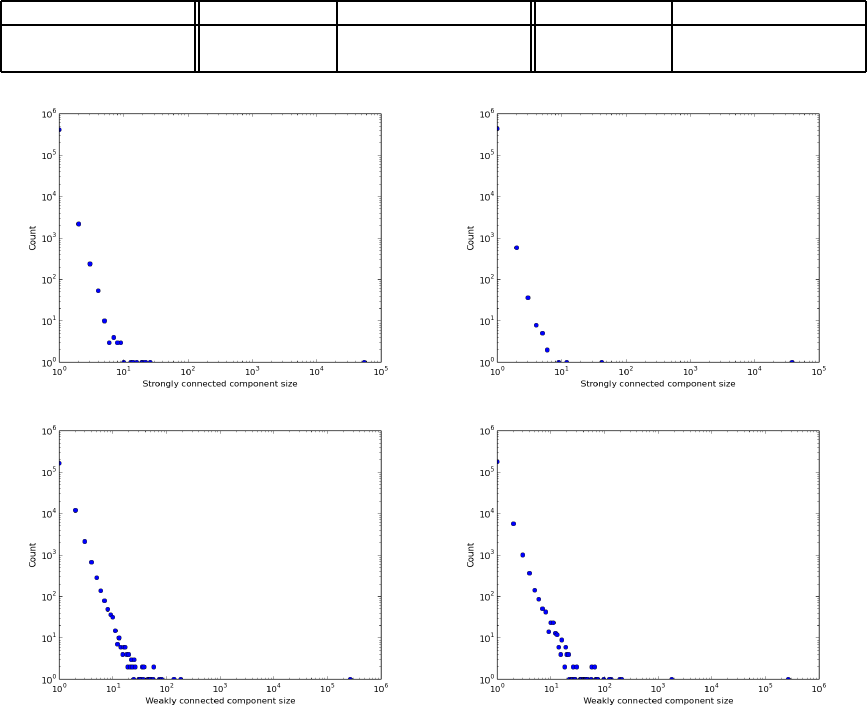
Table 1: Edges and Nodes Size of graphs: the percentage refers to the rate of edges or nodes number falling into the mutual
graph with respect to their generating graphs.
Mention Mention mutual Retweet Retweet mutual
Vertices 309,807 47,631 (6.50%) 289,895 17,551 (6.05%)
Edges 991,589 141,244 (14.24%) 1,041,955 53,262 (5.11%)
(a) (b)
Figure 2: The connected component size distribution of the mention graph (a), of the retweet graph (b).
ure 1 with the follow graph of (Myers et al., 2014)
we observe a smaller power law coefficient of the fol-
low graphs (α = 1.35 1.28 and 1.39 for in, out and
mutual respectively) than that of mention or retweet
graphs as shown on Table 2. This difference shows
that the rate of most mentioned or retweeted accounts
within a topic-driven Twitter flow of information is
smaller than the rate of accounts with highest number
of followers. Differently from the retweet graph of a
Gardenhose sample of Twitter (Bild et al., 2015) (a
10% random sample of the entire flow of Twitter in
a given period of time) we did not find a two-tailed
fitting model with two power-law distributions. The
decision to have selected the most authoritative ac-
counts and a set of relevant keywords could explain
this discrepancy as a sampling bias. Similarly, the
constraint imposed by Twitter that an account cannot
follow more than 2000 accounts, unless one does not
already possess an equally number of followers, may
be another bias explanation equally possible.
Connected Components. Figure 2 illustrates the
distribution of the strongly and weakly connected
component size. We remind that, differently from the
strong connectivity, the weak connectivity ignores the
direction of the edges.
Figure 2 shows some similarity with the Twitter
follow graph (Myers et al., 2014). We remind that
when considering all vertices with at least one edge
(either in or out), the largest weakly connected com-
ponent of the follow graph contains almost all ver-
tices (99.94%) and that in both weakly and strongly
connectivity there is a very large component con-
taining almost all vertices. Differently from follow
graphs one can observe that there is a single very large
component that squeezes the size of all other con-
Moving Beyond the Twitter Follow Graph
615
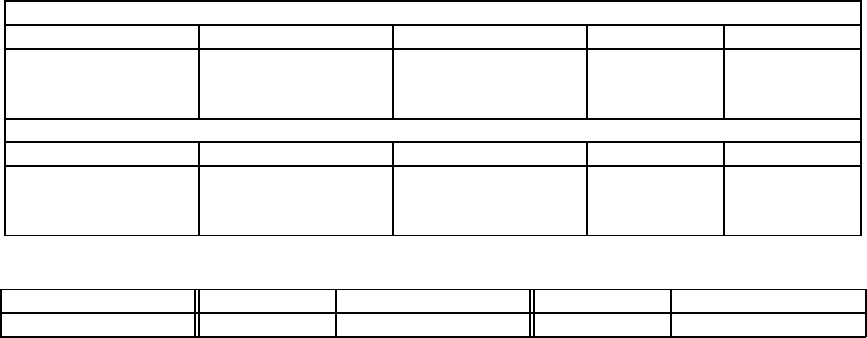
Table 2: Power law coefficients for the mention and retweet graphs. The D
c
are the critical values of the Kolmogorov-Smirnov
test. The distance D for the mention and retweet graphs at the confidence level of 99% are below their critical values.
Mention
Degree Power Coefficient α KS Distance D D
c
Max degree
In 1.511 0.021 0.071 19066
Out 1.518 0.030 0.089 3856
Mutual 1.471 0.051 0.138 1490
Retweet
Degree Power Coefficient α KS Distance D D
c
Max degree
In 1.541 0.026 0.066 10661
Out 1.469 0.030 0.091 6745
Mutual 1.515 0.065 0.171 324
Table 3: The average distance in the considered graphs.
Mention Mention mutual Retweet Retweet mutual
Average distance 6.62 6.25 6.28 7.08
nected components only with the weakly connectivity
of retweet and mention graphs.
The largest strongly connected component con-
tains only 17.56% of accounts for the retweet graphs
and 17.86% for the mention graph against the 68.7%
of the follow graphs of (Myers et al., 2014).
On the other hand, the largest weakly connected
component contains only 92.18% of accounts for the
retweet graphs and 86.86% for the mention graph
similarly to the 91.2% of the follow graphs (Myers
et al., 2014).
The explanation of this discrepancy is that some
vertices are mentioned or retweeted by manyaccounts
so that when one ignores directions the connectivity
increases significantly.
Path-length Distributions. Figure 3 shows the
path-length distribution of the examined graphs and
Table 3 shows the average distance between the ver-
tices. These data contrast with the ones reported in
(Myers et al., 2014) and (Bild et al., 2015) where the
values are 4.17 for the follow graph, 4.05 for the mu-
tual follow graph, and 4.8 for the retweet graph. It is
important to note that in our case, although the graph
is of several orders of magnitude smaller of the two
considered in those papers, and is very sparse (in our
case the average degree is 3 and their is 10) our graphs
show the ”small-world” property typical of the social
networks.
Clustering Coefficient. The clustering coefficient
in a network measures the fraction of vertices whose
neighbors are themselves neighbors: social networks
have an high clustering coefficient (Watts and Stro-
gatz, 1998). In our case, this metric is significant just
in the case of the mutual graphs. In Figure 4 it is rep-
resented the average clustering coefficient of vertices
as a function of the mutual degrees.
The irregularity of the diagram from values of mu-
tual degrees around 100 and beyond is due to the low
number of vertices with that degree. This makes the
average statistically insignificant.
Two-hop Neighborhoods. This is the set of ver-
tices that are neighbors of a vertex’s neighbors; we
consider both in-and out-neighbors. This is an im-
portant feature in a communication network because
indicates how a vertex is a potential information col-
lector or disseminator of information (depending on
whether we are considering incoming or outcoming
edges).
In the charts in Figure 5 are shown the size of
the two hop neighborhoods as a function of the size
of the in- and out-neighborhood. “Unique” and “not
unique” refer to whether a node in the two-hop neigh-
borhood is counted one or as many times as it appears
in the neighborhood of the neighbors. Finally, k
2
in-
dicates the size of the two-hop neighborhood in the
case all neighbors of a node have the same degree of
the node.
If the sizes of the two-hop neighborhoods are
greater than k
2
the network shows high information
spreading. The analysis of Figure 5 reveals that the
curves representing the two-hop neighborhood sizes
cross k
2
much earlier than in the follow graph (My-
ers et al., 2014). However, in our case, the number of
nodes with two-hop neighborhood sizes less than k
2
is very small (because is small the number of nodes
having tens of neighborhoods); therefore we conclude
that mention and retweet graphs have high informa-
tion spreading.
DART 2015 - Special Session on Information Filtering and Retrieval
616

(a) (b)
Figure 3: The path length distribution of the mention graph (a) and the retweet graph (b).
(a) (b)
Figure 4: The average clustering coefficient of vertices as a function of the mutual degree (a) in the mention graph and (b) in
the retweet graph.
4 CONCLUSIONS
In this paper we presented a new graph modeling the
Twitter user behavior: the mention graph. We used
well-known social networks analysis metrics for com-
paring the mention graph with both the follow and the
retweet graphs. The path-length distribution results
show that, although the mention graphs considered in
this paper is of several orders of magnitude smaller
than the ones studied in (Bild et al., 2015) and in (My-
ers et al., 2014), it still has the ”small-world” property
of the social networks.
Moving Beyond the Twitter Follow Graph
617

(a) (b)
Figure 5: The size of the two-hop neighborhoods of the mutual degree (a) in the mention graph and (b) in the retweet graph.
Finally, the two-hop neighborhoods analysis
shows that, compared to the follow graph, the men-
tion and the retweet graphs have a higher information
spreading.
Hence, the mention graph represents a promising
approach for performing typical qualitative analysis
such as sentiment analysis, authoritative users, com-
munity detection.
ACKNOWLEDGEMENTS
This work has been carried out in the MiSE-ISCOM
laboratories within a long-term research agreement
between FUB and ISCOM.
REFERENCES
Arxiden, A. (2013). Analysis of users’ influence based
on activity and quality of tweets for specific topics
in micro-blog. Journal of Computational Information
Systems, 9(20):8127–8137.
Bild, D. R., Liu, Y., Dick, R. P., Mao, Z. M., and Wal-
lach, D. S. (2015). Aggregate characterization of user
behavior in twitter and analysis of the retweet graph.
ACM Trans. Internet Technol., 15(1):4:1–4:24.
Java, A., Song, X., Finin, T., and Tseng, B. (2007). Why
we twitter: Understanding microblogging usage and
communities. In Proceedings of the 9th WebKDD and
1st SNA-KDD 2007 Workshop on Web Mining and
Social Network Analysis, WebKDD/SNA-KDD ’07,
pages 56–65, New York, NY, USA. ACM.
Kwak, H., Lee, C., Park, H., and Moon, S. (2010). What is
twitter, a social network or a news media? In Proceed-
ings of the 19th International Conference on World
Wide Web, WWW ’10, pages 591–600, New York,
NY, USA. ACM.
Myers, S. A., Sharma, A., Gupta, P., and Lin, J. (2014).
Information network or social network?: The struc-
ture of the twitter follow graph. In Proceedings of
the Companion Publication of the 23rd International
Conference on World Wide Web Companion, WWW
Companion ’14, pages 493–498, Republic and Can-
ton of Geneva, Switzerland. International World Wide
Web Conferences Steering Committee.
Wang, X., Wei, F., Liu, X., Zhou, M., and Zhang, M. (2011).
Topic sentiment analysis in twitter: A graph-based
hashtag sentiment classification approach. In Pro-
DART 2015 - Special Session on Information Filtering and Retrieval
618
ceedings of the 20th ACM International Conference
on Information and Knowledge Management, CIKM
’11, pages 1031–1040, New York, NY, USA. ACM.
Watts, D. J. and Strogatz, S. H. (1998). Collective dynamics
of’small-world’networks. Nature, 393(6684):409–10.
Weng, J., Lim, E.-P., Jiang, J., and He, Q. (2010). Twit-
terrank: Finding topic-sensitive influential twitterers.
In Proceedings of the Third ACM International Con-
ference on Web Search and Data Mining, WSDM ’10,
pages 261–270, New York, NY, USA. ACM.
Yamaguchi, Y., Takahashi, T., Amagasa, T., and Kitagawa,
H. (2010). Turank: Twitter user ranking based on
user-tweet graph analysis. In Proceedings of the 11th
International Conference on Web Information Systems
Engineering, WISE’10, pages 240–253, Berlin, Hei-
delberg. Springer-Verlag.
Moving Beyond the Twitter Follow Graph
619
