Pedobarographic Features of Gait Measured by FDM1.5 PMD
Igor Gruić, Karlo Cebović, Josipa Radaš, Filip Bolčević and Vladimir Medved
Faculty of Kinesiology, University of Zagreb, Horvaćanski zavoj 15, 10000 Zagreb, Croatia
Keywords: Pedobarography, Gait, PMD, Pressure Acquisition Protocol, Data Processing, Biomechanics.
Abstract: Backgrounds: Main objective was to evaluate methods for assessment of pedobarographic features of gait
using FDM1.5 pressure measuring device (PMD) - within complete gait analysis, with regard to device,
protocol&data analysis, specifically to basic morphology and certain distinctive characteristics. Methods:
Protocol was standardized for descriptive&inferential statistical methods (63 quantitative variables).
Participants characteristics (n=22; 13 male&9 female): age 14-35 y.o., average 172,56cm body height,
average 73.11kg body mass (19.47 BMI), with minimum of 5 years of regular sport&recreational activities.
Results: Protocol output was consistent for repeated measurement of an individual. Tested differences
between genders, before&after ‘partialization’ of results (excluded influence of longitudinal
dimensionality), in both cases reveal significance in: Stride width (t_GSW=4.15), Step time_L
(t_TSTL=2.88), Step time_R (t_TSTR=3.59), bilateral asymmetry in Step time (t_TST_D=3.32), Cadence
(t_TC=-3.44) on p<0.01 level, and Ant/Post position (t_BAP=2.33), bilateral asymmetry in Time to change
heel to forefoot(t_LTP_D=2.26), Time maximum force Midfoot_D % of stance time (t_TMAXM=2.33), and
bilateral asymmetry in Contact time Heel (t_CH_D=2.33), on p<0.05 level. Differences in
barefoot/footwear gait were specially expressed in variable MAXPH (t= -8.84, p<0.05). Conclusions:
Statistical tools, such as partializations of the results by specific characteristic which tend to increase
heterogeneity, may standardize&improve the power of the protocol and method.
1 INTRODUCTION
During ordinary activities, trainings, or
competitions, high intensity foot-ground contacts
affect adaptation depending on movement structure,
type of surface, and generally, footwear. Health
effects of barefoot gait, incidence of injuries and
functional pathologies, footwear characteristics etc.,
are covered trough meta-analysis and reviews (e.g.
Giacomozzi, 2011), primarily in order to standardize
plantar pressure measurement protocols
(Giacomozzi, 2010, Giacomozzi et al, 2012)
Complementarities of normal functions of ankle
joint is conditioned by predisposed and phenotype
factors. Articulatio Talocruraris as angle joint covers
dorsal and plantar flexion (tibia, fibula, and talus).
Art. subtalaris covers inversion and eversion (talus,
calcaneus, cuboideum). Distal interfalangeal joints
as angle joints cover flexion and extension
(phalanges).
In order to reliably associate local pressure data
with foot function and structure, anatomy-based
masking of footprints is recommended (Giacomozzi
et al., 2012). Previous to iFAB-PG convergences (in
Giacomozzi, 2010), simple optic systems, e.g.
Sheffield system (Franks, 1997), were used. Pressure
distribution can be seen as the effectiveness of the
musculoskeletal system in absorbing the ground
reaction forces via the foot and its joints. Excessive
foot pressure may develop into calluses, which
become sites of peak pressure and pain (Caravaggi
et al 2014). Therefore, in assessment of data about
feet structure and function, new kinetic and
kinematic pressure measurement devices (PMDs)
are used (insoles, platforms, trackways, mats, etc.).
After leaving optical systems (Sheffield), new
approach was e.g. in Giacomozzi (2012) usage of
the Oxford kinematic foot model for medio-lateral
regionalisation of the foot – clinically relevant for
clubfoot and flatfoot – and e.g. the Rizzoli model for
longitudinal regionalisation, to clearly distinguish
metatarsal from toe or midfoot loading.
Besides classical kinetic approach for
measurement of vertical (Fz), antero-posterior (Fy)
and medio-lateral (Fx) forces (ELITE system,
Medved and Kasović, 2007), new templates for
plantar pressure measurements were offered by
different producers (e.g. in Giacomozzi, 2010).
Template for Segmented Foot Regions and Length
Measurements (FootMat software, Tekscan) where
66
Gruic, I., Cebovic, K., Radas, J., Bolcevic, F. and Medved, V..
Pedobarographic Features of Gait Measured by FDM1.5 PMD.
In Proceedings of the 3rd International Congress on Sport Sciences Research and Technology Support (icSPORTS 2015), pages 66-71
ISBN: 978-989-758-159-5
Copyright
c
2015 by SCITEPRESS – Science and Technology Publications, Lda. All rights reserved
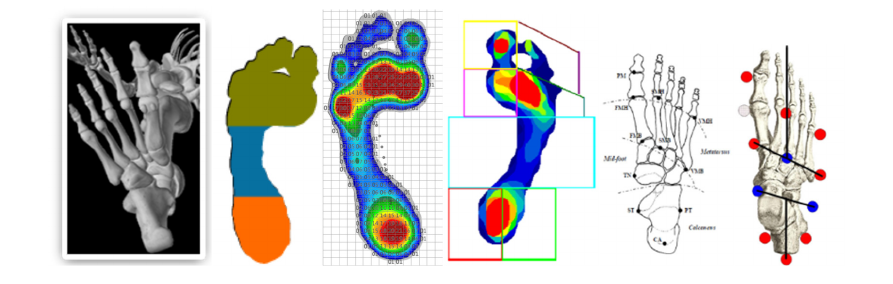
Figure 1: Examples of kinematic&kinetic models for foot analysis (Zebris: ref 13., Tekscan: Cousins et al, 2012.; Rizzoli:
Leardini et al, 2007.; Oxford: Stebings et al, 2006.).
“reliable plantar pressure data that can be collected
in children, aged 7 to 11 years in all regions of the
foot except the lesser toes which consistently
reported poor-to-moderate levels of reliability and
increased variability.” (Cousins et al, 2002), Novel,
Zebris and other, offered their foot model (Figure
1.).
Plantar pressure measurement devices (PMDs)
are now widespread mostly (Giacomozzi et al.,
2012): in the biomechanical research, in the clinical
context, as a key instrument for the prescription,
design and construction of plantar orthoses.
Biomechanical measurements and analyses in
general, encompass spatial kinematic variables,
ground reaction force, and multi-channel surface
electromyography (sEMG) (Medved and Kasović,
2007).
Main objective in this paper is to join, to support,
and to be in line, with mission of three main sections
within i-FAB-PG - 1)Technical Assessments, 2)
Data Analysis and 3) Applications, e.i. evaluation of
methods for assessment of pedobarographic features
of gait using FDM 1.5 PMD (Zebris Medical,
Gmbh).
Trough initial insight of possibilities that FDM
1.5 platform offers, it is a goal: 1) to test
preconditions for standardization of measuring
protocol for complete gait analysis within
Biomechanics Laboratory, Institute of Kinesiology,
Faculty of Kinesiology (analysis of metric
characteristics of tests, trough basic pedobarographic
indicators of forces, pressures, time-spatial, and
derived indicators, bilateral asymmetries), 2) to test
relations of pedobarographic characteristics with
basic morphology (later with kinetic and isokinetic),
and 3) to analyse differences with regard to
distinctive characteristics (e.g. gender, body height,
bilateral asymmetries, barefoot/footwear, ect.), in
order to capacitate laboratory for more demanding
analysis regarding different kinesiological activities.
2 METHODS
Measurement protocol: from initial standing position
(barefoot), subject walks over the trackway 9,5 m
long (with centrally positioned 158 cm long and 60,5
cm wide platform - FDM1.5, ZEBRIS medical,
Gmbh; sensor area 149,0x54.2 cm – L x W,
sampling rate 100 Hz, optional 200 Hz/300 Hz), to
the end of the trackway, turns around and goes back
(6 times). During the gait, subject should be
instructed to develop and reach velocity normal for
aiming him/herself towards ordinary activity/duty
when there are no disturbing gait aspects (late for
meeting, uncomfortable footwear, company etc.).
Measurements on platform are supported by 11264
capacitive sensors with density of 1.4 sensors/cm2,
with measuring range 1-120 N (accuracy ±5% FS).
Reports (accessible by Zebris Medical FDM
software for qualitative and quantitative analysis; for
reliability Zebris refers to Giacomozzi C, 2010)
offer 63 quantitative variables and graphics within
groups (table 1): pressure plots, gait parameters
(geometry, phases, timing) COP analysis,
force&pressure parameters&curves, three foot zone
analysis (Zebris model). Protocol was standardized
for descriptive and inferential statistical methods.
Normality of distributions of results was tested with
K-S test, reliability with Cronbach alpha: 0.99
(Standardized alpha: 0.99), homogeneity with
Average inter-item corr.: .99. Participants
characteristics (n=22; 13 male, 9 female): age 14-35
y.o., average 172,56 cm body height, average 73.11
kg body mass (and average 19.47 BMI), with
minimum of 5 years of regular sport and recreational
activities.
Pedobarographic Features of Gait Measured by FDM1.5 PMD
67

Table 1: Pedobarographic variables (Zebris protocol).
code description, unit, (L/D) code description, unit, (L/D foot) code description, unit, (L/D foot)
GFRL Foot rotation, degree L BLL Length of gait line, mm L MHL Maximum force H, N L
GFRR Foot rotation, degree D BLR Length of gait line, mm D MHR Maximum force Hl, N D
GSLL Step length, cm L BSL Single support line, mm L MAXPFL Max pressure FF, N/cm2 L
GSLR Step length, cm D BSR Single support line, mm D MAXPFR Max pressure FF, N/cm2 D
GSL Stride length, cm BAP Ant/Post position, m
m
MAXPML Max pressure MF, N/cm2 L
GSW Stride width, c
m
BLS Lateral symmetry, m
m
MAXPMR Max pressure MF, N/cm2 D
PSTPL Stance phase, % L FMF1L Maximum force1, N L MAXPHL Max pressure H, N/cm2 L
PSTPR Stance phase, % D FMF1R Maximum force1, N D MAXPHR Max pressure H, N/cm2 D
PSTLRL Load response, % L FTMF1L Time maximal force1, % L TMAXFL Time max force FF, %L*
PSTLRR Load response, % D FTMF1RTime maximal force1, % D TMAXFR Time max force FF , % D *
PSTMSL Mid stance, % L FMF2L Maximum force2, N L TMAXML Time max force MF, %L*
PSTMSR Mid stance, % D FMF2R Maximum force2, N D TMAXMR Time max force MF, % D *
PSTPSL Pre-Swing, % L FTMF2L Time maximal force2, % L TMAXHL Time max force H, %L*
PSTPSR Pre-Swing, % D FTMF2RTime maximal force2, % D TMAXHR Time max force H, % D *
PSWPL Swing phase, % L LTL Time to change heel to FF, sec L CFL Contact time FF, %L*
PSWPR Swing phase, % D LTR Time to change heel to FF, sec D CFR Contact time FF, % D *
PDSTP Double stance phase, % LTPL Time to change heel to FF, % L CML Contact time MF, %L*
TSTL Step time, sec L LTPR Time to change heel to FF, % D CMR Contact time MF% D *
TSTR Step time, sec D MFL Maximum force FF, N L CHL Contact time H, %L*
TST Stride time, sec MFR Maximum force FF, N D CHR Contact time H, % D *
TC Cadence, steps/min MML Maximum force MF, N L TVI
S
B
ody height
TV Velocity, km/h MMR Maximum force MF, N D
A
SI
S
L
eg height
(*% of stance time; FF-Forefoot, MF-Midfoot, H-Heel)
Table 2: Pedobarographic parameters (n=22;'_D’ is measure of bilateral asymmetry (L – R =_D)).
code X±SD code X±SD code X±SD code X±SD
TVIS 172.56±15.97 PSWPL 38.75±1.88 FMF2L 705.23±213.29 MAXPML 10.65±5.58
L_ASIS 97.81±9.56 PSWPR 37.62±2.15 FMF2R 711.08±199.45 MAXPMR 12.42±6.00
D_ASIS 98.87±9.74 PSWPR_D 1.13±1.87 FMF2_D -5.85±30.73 MAXPM_D -1.77±4.21
ASIS_D -1.06±2.40 PDSTP 23.65±3.39 FTMF2L 45.73±1.80 MAXPHL 39.41±11.59
GFRL 8.15±4.09 TSTL 0.55±0.05 FTMF2R 46.45±1.74 MAXPHR 40.13±11.51
GFRR 9.94±4.45 TSTR 0.54±0.05 FTMTF2_D -0.73±2.45 MAXPH_D -0.72±5.17
GFR_D -1.79±4.84 TST_D 0.01±0.02 LTL 0.25±0.06 TMAXFL 75.13±2.00
GSLL 67.86±9.74 TST 1.09±0.09 LTR 0.24±0.06 TMAXFR 75.32±1.67
GSLR 69.82±5.72 TC 111.41±9.40 LT_D 0.01±0.05 TMAXF_D -0.19±1.30
GSL_D -1.95±10.11 TV 4.56±0.54 LTPL 36.36±6.13 TMAXML 42.22±8.74
GSL 137.73±12.13 BLL 217.33±32.63 LTPR 34.25±6.78 TMAXMR 39.71±8.72
GSW 11.50±3.61 BLR 223.74±22.34 LTP_D 2.11±4.39 TMAXM_D 2.50±6.51
PSTPL 61.25±1.88 BL_D -6.41±19.01 MFL 694.84±196.64 TMAXHL 18.35±3.00
PSTPR 62.38±2.15 BSL 131.04±14.45 MFR 700.46±193.24 TMAXHR 17.08±3.23
PSTP_D -1.13±1.87 BSR 131.29±17.70 MF_D -5.62±21.33 TMAXH_D 1.27±2.70
PSTLRL 12.05±1.69 BS_D -0.25±11.74 MML 122.55±69.23 CFL 89.78±2.77
PSTLRR 11.48±1.89 BAP 137.99±15.71 MMR 142.56±74.94 CFR 89.66±3.60
PSTLR_D 0.57±1.46 BLS -1.47±2.96 MM_D -20.01±29.40 CF_D 0.12±1.58
PSTMSL 37.63±1.82 FMF1L 679.59±187.11 MHL 490.35±119.63 CML 66.95±6.87
PSTMSR 38.89±1.85 FMF1R 684.57±186.33 MHR 476.80±108.42 CMR 68.39±6.28
PSTMS_D -1.25±1.71 FMF1_D -4.99±31.78 MH_D 13.55±34.54 CM_D -1.44±5.36
PSTPSL 11.49±1.90 FTMF1L 19.00±23.98 MAXPFL 42.14±10.21 CHL 53.52±8.60
PSTPSR 12.15±1.87 FTMF1R 14.23±1.57 MAXPFR 42.05±11.52 CHR 50.84±9.29
PSTPS_D -0.66±1.73 FTMF1_D 4.77±23.78 MAXPF_D 0.09±5.27 CH_D 2.69±5.63
icSPORTS 2015 - International Congress on Sport Sciences Research and Technology Support
68

Collected data were processed within
Reliability/Item analysis, K-S normality tests,
descriptive analysis, correlation analysis, t-test, in
Statistica for W/5.0.
3 RESULTS
Pedobarographic features of normal gait are
presented trough results in 63 standard, and 29
derived variables in Table 2. Gender based
heterogeneity of subjects is presented in Table 3.,
and differences based on barefoot/footwear gait (as
additional source of heterogeneity) in Table 4.,
followed by Figure 2. Results in Table 5 present
gender based differences in certain pedobarographic
features before and after using statistical tools for
excluding common variance.
Table 3: Longitudinal dimensionality by gender (X±SD;
M=13, F=9); t-test differences.
x_M x_F t-value p
TVIS 178.59±14.41 163.84±14.60 2.35 0.03
L_ASIS 101.35±8.45 92.70±9.12 2.28 0.03
D_ASIS 102.55±8.37 93.56±9.50 2.34 0.03
Table 4: T-test for barefoot/footwear differences.
Mean SD t
p
MAXPH_barefoot -1.8 4.37
-8.84
0.01
MAXPH _shoes 0.9 4.16
4 DISCUSSION & CONCLUSIONS
Different approaches to assess pedobarographic
features of gait (e.g. (Lorkowski and Zarzycki, 2006;
Skopljak et al., 2014; Pomarino and Pomarino,
2014; Maurer et al., 2014, ect.), bring conclusions
based on different PMDs and protocols. Consistency
and repeatability were provided.
Pedobarographic parameters, acquired by
measurement protocol on tested PMD, have shown
consistent output for repeated measurement of an
individual. However, within small data base and
heterogeneous sample of participants, conclusions
and generalizations are limited. It is the case in this
paper, too.
Statistical tools, however, may improve power of
the method. By ‘partializations’ of the results by
specific characteristic which tend to increase
heterogeneity (age, sex, longitudinal dimensionality,
bilateral asymmetries, time-spatial parameters, etc.)
Table 5: Pedobarographic features; analysis of differences by gender (t-test), correlations between anthropometric variables
(M+F), and variables differentiating two groups by gender criterion (r), and analysis of differences by gender after
partializations on longitudinal dimensionality (t-test (p)).
X ±SD (M=13, F=9) r
t-test t -test(p)
code
X ±SD _M X ±SD _F TVIS LASIS DASIS t p t p
GSW 13.85±2.67 8.11±1.27 0.53 0.56 0.51 5.96 0.00 4.15 0.00
TSTL 0.57±0.03 0.51±0.03 0.53 0.49 0.51 4.44 0.00 2.88 0.01
TSTR 0.57±0.03 0.50±0.03 0.54 0.50 0.49 5.39 0.00 3.59 0.00
TST_D 1.14±0.06 1.00±0.06 0.55 0.52 0.52 5.07 0.00 3.32 0.00
TC 105.62±5.61 119.78±7.19 -0.58 -0.54 -0.54 -5.19 0.00 -3.44 0.00
BLL 232.22±26.58 195.83±29.24 0.84 0.80 0.81 3.03 0.01 1.47 0.16
BLR 233.78±21.95 209.23±13.67 0.91 0.89 0.84 2.97 0.01 1.84 0.08
BAP 145.65±14.83 126.91±9.19 0.88 0.83 0.80 3.36 0.00 2.33 0.03
BLS -2.49±2.92 0.01±2.46 -0.16 -0.18 -0.13 -2.10 0.05 -1.81 0.09
FMF1L 749.17±168.57 579.08±173.32 0.90 0.87 0.82 2.30 0.03 0.60 0.56
FMF1R 759.06±169.64 576.98±161.03 0.92 0.90 0.86 2.53 0.02 0.94 0.36
FMF2L 787.57±187.20 586.30±199.81 0.89 0.84 0.85 2.41 0.03 0.62 0.54
FMF2R 787.45±182.08 600.76±177.53 0.91 0.88 0.87 2.39 0.03 0.56 0.58
LTP_D 3.68±3.84 -0.16±4.32 0.01 -0.02 -0.03 2.19 0.04 2.26 0.04
MFL 768.88±181.97 587.88±173.34 0.91 0.86 0.86 2.34 0.03 0.50 0.62
MFR 773.98±175.11 594.26±174.79 0.92 0.89 0.87 2.37 0.03 0.51 0.62
MAXPMR 14.54±6.96 9.36±1.97 0.35 0.41 0.34 2.16 0.04 1.48 0.16
TMAXM 5.41±6.62 -1.69±3.50 0.20 0.20 0.22 2.93 0.01 2.33 0.03
CF -0.50±0.87 1.02±1.98 -0.53 -0.44 -0.44 -2.47 0.02 -1.53 0.14
CML 69.68±4.82 62.99±7.70 0.60 0.64 0.61 2.52 0.02 1.26 0.22
CH 4.76±5.92 -0.31±3.68 0.00 -0.02 -0.03 2.28 0.03 2.33 0.03
Pedobarographic Features of Gait Measured by FDM1.5 PMD
69

Figure 2: Barefoot gait (left graphs)/footware gait (right graphs) (Zebris); axes – x for % of measured time, y for Force (N),
and 4 lines (developing from left to right – total, heel, midfoot, forefoot).
it is possible to improve power of arguments.
Partializations imply extracting the common
variance, and comparison between rests of true
variances (explained in Milas, 2009). It goes in line
with 3
rd
fundamental step that have to be followed
towards standardisation in the use of PMDs
(Giacomozzi et al, 2012), i.e. definition and
standardisation of data processing and reporting (1
st
is definition and standardisation of tools and
protocols for the technical assessment of PMD
hardware performance, and 2
nd
is definition and
standardisation of pressure acquisition protocols)
Pedobarographic features are expectedly
different in male and female population due to well
analysed differences in valgus knee inclinations.
Tested differences between genders (table 5.), before
and after partialization of results (by excluding
influence of longitudinal dimensionality of subjects),
in both cases reveal significance in variables: Stride
width (t_GSW=4.15), Step time L (t_TSTL=2.88),
Step time R (t_TSTR=3.59), bilateral asymmetry in
Step time (t_TST_D=3.32), Cadence (t_TC=-3.44)
on P<0.01 level, and Ant/Post position
(t_BAP=2.33), bilateral asymmetry in Time to
change heel to forefoot, % L (t_LTP_D=2.26), Time
maximum force Midfoot D % of stance time
(t_TMAXM=2.33), and bilateral asymmetry in
Contact time Heel (t_CH_D=2.33), on p<0.05 level.
Differences in barefoot/footwear gait (table 4.)
were specially expressed in variable MAXPH (t= -
8.83782, p<0.05). It can be (limited) assumption,
that wearing shoes influences neuromuscular and
motor control(learning) decision mechanisms in a
way that individual 'delegates' amortisation
mechanisms in first contact (heel strike/load
response) to the shoe and elastic structures of its
composite materials (figure 2.). Initial greater force
(during contact with shoe) spreads, and transposes
impact on upper skin. Normal feet with „smaller
joint mobility are associated with larger pressure at
the rear- and forefoot. A trend for decreased pressure
at the midfoot was also detected in feet with a stiffer
medial longitudinal arch. A more flexible foot may
allow better distribution of pressure at the plantar
foot surface during gait thus limiting the
contribution to plantar tissue damage especially in
at-risk groups such as the diabetic feet.“ (Caravaggi
et al, 2014).
ACKNOWLEDGEMENTS
Research was conducted by Research Group of
Biomechanics Laboratory, Institute of Kinesiology,
Faculty of Kinesiology, as closure of UniZg project
“Pedobarographic features of human locomotion in
sports and medicine” intended to support future
developments in gait analysis.
REFERENCES
Caravaggi, P., Giacomozzi, C., & Leardini, A., 2014. Foot
joints mobility and plantar pressure in the foot. In
Book of Abstracts of 1st Clinical Movement Analysis
World Conference, ROME, 29th September - 4th
October 2014.
Cousins, S. D., Morrison, S.C. & Drechsler, W.I, 2012.
The reliability of plantar pressure assessment during
barefoot level walking in children aged 7-11 years,
Journal of Foot and Ankle Research 2012, 5:8.
Franks, C.I. 1997. Calibration of optical foot pressure
systems. Medical & Biological Engineering&
Computing, 1997, 35, 69-72.
Giacomozzi, C., 2010. Appropriateness of plantar pressure
measurement devices: A comparative technical
assessment. Gait posture Vol.32, Issue 1: 141-144.
Giacomozzi, C., 2010. Performance of plantar pressure
measurement devices (PMD): update on consensus
activities (commentary), Ann 1
st
Super Sanita 2010,
vol 46, No 4:343-348.
Giacomozzi, C., 2011. Potentialities and Criticalities of
Plantar Pressure Measurements in the Study of Foot
Biomechanics: Devices, Methodologies and
Applications, Biomechanics in Applications, Dr
Vaclav Klika (Ed.), ISBN: 978-953-307-969-1.
icSPORTS 2015 - International Congress on Sport Sciences Research and Technology Support
70
Giacomozzi et al., 2012. Anatomical plantar pressure
masking and foot models: potential for integration
with marker position systems. Journal of Foot and
Ankle Research 2012/5 (Suppl 1):O29.
Giacomozzi, C., Keijsers, N., Pataky, T., & Rosenbaum,
D., 2012. International scientific consensus on medical
plantar pressure measurement devices: technical
requirements and performance. Ann Ist Super Sanità
2012 | Vol. 48, No. 3: 259-271,
Leardini A, Benedetti, M.G., Berti, L., Bettinelli Nativo,
D.R., & Giannini, S., 2007. Rear-foot, mid-foot and
fore-foot motion during the stance phase of gait. Gait
Posture 2007, 25:453-462.
Lorkowski, J, Zarzycki, D. 2006. Clinical use of
pedobarographic examination - own experience and
review of literature. Przegl Lek. 2006; 63 Suppl 5:28-
32.
Maurer, J.D., Ward, V., Mayson, T.A., Davies,
K.R., Alvarez, C.M., Beauchamp, R.D., Black, A.H.
(2014). Classification of midfoot break using multi-
segment foot kinematics and pedobarography. Gait
Posture. 2014 Jan; 39(1):1-6.
Medved, V., Kasovic, M., 2007. Biomechanical analysis
of human movement in the function of sports
traumatology. Croatian Sports Medicine Journal.
2007; 22: 40-47.
Milas, G. 2009. Research methods in psychology and
other social sciences. Zagreb: Slap.
Pedobarographic features of human locomotion in sports
and medicine, University of Zagreb, 2013-2014,
project (head, PhD, Vladimir Medved).
Peharec, S., 2002. Pedobarographic analysis of gait and
running in top athletes (master thesis). Zagreb: Faculty
of Kinesiology, University of Zagreb.
Pomarino, D, Pomarino, A. 2014. Plantar Static Pressure
Distribution in Healthy Individuals: Percentiles for the
Evaluation of Forefoot Loading. Foot Ankle Spec.
2014 Apr 21; 7(4):293-297.
Skopljak, A., Muftic, M., Sukalo, A. & Masic, I. 2014.
Pedobarography in Diagnosis and Clinical
Application. Acta Inform Med, 22 (6), 374-378.
Specifications and operating instructions/software User
manual, zebris Medical, Gmbh.
Stebbins J, Harrington M, Thompson N, Zavatsky A,
Theologis T 2006. Repeatability of a model for
measuring multi-segment foot kinematics in children.
Gait Posture 2006, 23:401-410.
Pedobarographic Features of Gait Measured by FDM1.5 PMD
71
