Analysis of the 21/22 October 2014 Storm Experienced by the
Sailboat ECO40 in the Gulf of Lion
P. De Girolamo
1
, A. Romano
1
, G. Bellotti
2
, A. Pezzoli
3
, A. Boscolo
3
, M. Crespi
1
, A. Mazzoni
1
,
M. Di Risio
4
, D. Pasquali
4
, L. Franco
2
and P. Sammarco
5
1
Sapienza Università di Roma, DICEA, Via Eudossiana, 18, 00184, Roma, Italy
2
Università di Roma Tre, Dip. di Ingegneria, Via Vito Volterra, 62, 00146, Roma, Italy
3
Politecnico di Torino & Università di Torino, DIST, L.R. MeteoSport, Viale Mattioli 39, 10125, Torino, Italy
4
Università dell’Aquila, DICEAA, Laboratorio di Idraulica Ambientale e Marittima LIAM,
P.le Pontieri, 1, 67040 Monteluco di Roio, L’Aquila, Italy
5
Università di Roma Tor Vergata, DICII, Via del Politecnico, 1, 00133, Roma, Italy
Keywords: Sailboat, Waves, Wind, Forecast.
Abstract: On October 19, 2014 Matteo Miceli, a known Italian oceanic sailor, left the Port of Riva di Traiano (Rome,
IT) with the sailboat ECO40, an Italian vessel, for the Roma Ocean World Project. This ambitious challenge
consists in a non-stop sailing alone around the World in energy and food self-sufficiency. ECO40 is a Class
40 oceanic vessel (LOA of 12,0 m) that has been equipped with a data acquisition system for both the met-
ocean parameters recorded on-board (i.e. apparent and real wind speed and wind direction, atmospheric
pressure, current velocity, air and sea temperature, etc.) and the kinematic characteristics of the boat itself
(i.e. speed and course over ground). Furthermore, the boat has been equipped with a three high precision
GPS receivers, provided by Leica Geosystem, for measuring the movements of the boat and with an inertial
platform. Due to these high-precision instruments it has been possible to fully measure and characterize the
six degrees of freedom of the boat, and accordingly to use the boat as a “sailing wave buoy”. In this paper
we present the first analysis of the met-ocean data measured by the boat during the storm occurred in the
Gulf of Lion on October 21-22, 2014 that ECO40 faced just few days after its departure.
1 INTRODUCTION AND AIM OF
THE RESEARCH
On October 19 , 2014 Matteo Miceli, a famous
Italian oceanic sailor, left the Port of Riva di Traiano
located close to Rome (Italy) with the Italian
sailboat ECO40 for the Roma Ocean World Project.
This ambitious challenge consists in a non-stop
sailing alone around the World in energy and food
self-sufficiency. The planned route was the classic
clipper route which runs from west to east through
the Southern Ocean, in order to make use of the
strong westerly winds. Namely the route, very
similar to that of several prominent yacht races as
Around Alone and Vendèe Globe, consists in
passing the Gibraltar Strait, then in descending the
Atlantic Ocean and sailing around the Antarctic, at a
mean latitude of 50
o
S, from west to east rounding
the most famous capes of the world: Cape of Good
Hope, Cape Leeuwin and Cape Horn. Finally,
ascending the Atlantic Ocean and passing again the
Strait of Gibraltar coming back to the homeport. The
total distance to be covered by the sailboat was
estimated in about 28,000 nautical miles, while the
duration was estimated in about five months.
When Matteo was on the way back to Italy, after
rounding the three capes and sailing for 25.000
nautical miles, ECO40 capsized at the equator.
Matteo was about 600 miles offshore the Brazilian
coasts. Matteo was saved by a cargo. When he came
back to Italy, he organized a first expedition with
four friends to try to recover ECO40, which was not
successful. After one month Matteo and his friends
tried again and found ECO40 300 miles offshore the
Brazilian coasts. Now ECO40 is again in Italy.
ECO40 is a Class 40 oceanic vessel (LOA of 12,0
m) that has been equipped with a data acquisition
system for both the met-ocean parameters recorded
290
Girolamo, P., Romano, A., Bellotti, G., Pezzoli, A., Boscolo, A., Crespi, M., Mazzoni, A., Risio, M., Pasquali, D., Franco, L. and Sammarco, P..
Analysis of the 21/22 October 2014 Storm Experienced by the Sailboat ECO40 in the Gulf of Lion.
In Proceedings of the 3rd International Congress on Sport Sciences Research and Technology Support (icSPORTS 2015), pages 290-298
ISBN: 978-989-758-159-5
Copyright
c
2015 by SCITEPRESS – Science and Technology Publications, Lda. All rights reserved
on-board (i.e. apparent and real wind speed and
wind direction, atmospheric pressure, current
velocity, air and sea temperature, etc.) and the
kinematic characteristics of the boat itself (i.e. speed
and course over ground). Furthermore, the boat has
been equipped with a three high precision GPS
receivers, provided by Leica Geosystem, for
measuring the movements of the boat and with an
inertial platform. Thanks to these instruments it is
possible to fully measure and characterize the six
degrees of freedom of the boat.
In order to reduce the significant cost of the data
transfer just a small part of the measured data were
sent to the land team on daily basis; it is worth to
note that the transfer of the data is achieved by using
a satellite modem. The sampling frequency for the
met-ocean data acquisition is 2 Hz, nevertheless
only the data averaged over a time window which
had a duration of 10 minutes were sent to shore. It is
important to stress that these data, measured by the
boat and transmitted almost in real time, helped
significantly the team in charge of the safety of
ECO40; in fact the knowledge of the actual weather
conditions that the boat is really facing during its
navigation can improve the route strategy and
increase the boat safety. Furthermore, the boat
performance data (i.e. speed and course over
ground) can allow, after a certain amount of time
that is required for considering the database
statistically meaningful, to estimate the real polar
velocity curves of the boat. Indeed these curves were
used for the prediction of the optimal route (routage)
made by the land team by means of a route
optimization software, which was sent daily to
ECO40.
It is worth noticing that the actual polar velocity
curves of the boat differ from the theoretical ones
estimated by the designer of the boat. This is due to
several causes, among which plays an important role
the ability of the crew to "push" the boat to the
maximum of its performance and the presence of
waves that normally is not taken into account when
calculating the curves themselves.
The remaining data were supposed to be analyzed
once the boat had come back. Fortunately the data
were saved together with the boat.
The measurements of the boat movements, obtained
from the three GPS receivers, if properly analyzed
can provide the characteristics of waves that ECO40
encountered during its navigation. In other words it
can be stated that ECO40 can be used as a “moving
wave buoy” for measuring the waves characteristics
(i.e. significant wave height H
m0
, peak period T
p
and
mean direction θ) experienced during navigation.
These data are used mainly for two technical and
scientific purposes. The first purpose is the
calibration of the numerical models output that are
commonly used for the wind and wave forecast
and/or analysis into the oceans, and the calibration
of the remote sensing data (e.g. satellite wind and
wave measurements). The second purpose is directly
related to the vessel design. Indeed the knowledge of
both the movements and the loads that these kind of
vessel can deal with, together with the response of
the materials to the fatigue stresses, can improve
significantly the designing methods.
The aim of this paper consists in analyzing the first
storm experienced by ECO40 during its navigation
that occurred in the Gulf of Lion on October 21-22,
2014. In the following sections, first we present the
analysis of the Gulf of Lion weather event, and the
description of the available wind and waves data.
Then we show the results of the comparison between
the wind measurements carried out on board and
those reconstructed in forecasting and analysis, by
using the numerical data of the GFS (Global
Forecast System) and ECMWF (European Center
for Medium-range Weather Forecast). Finally, we
show a comparison of the present data with those
related to the storm that occurred in the Gulf of Lion
on 2 November 1995, which caused the sinking of
the Italian racing boat Parsifal, killing six of its nine
crew members. The weather conditions that caused
the sinking of the boat have been rebuilt by (Bertotti
et al., 1988).
2 THE ECO40’S ROUTE DURING
THE GULF OF LION EVENT
On 19 October 2014, when ECO40 left from the
Italian Port Riva di Traiano, the weather conditions
appeared to be clear: within the next 24/48 hours the
first seasonal front of cold air, expected to cause
mistral winds having wind speed exceeding 40
knots, would come from the Gulf of Lion.
Fortunately, ECO40 was able to reach the Asinara
Island and began to follow the route towards the
Balearic Islands before the arrival of the main storm:
the boat has faced the storm running on the quarter.
The route between the Asinara Island and the
Balearic Islands that the boat ECO40 has followed is
represented in Figure 1. The figure shows also
information of the travel times.
Eco 40 has covered more or less 200 nautical miles
in 24 hours, with a mean speed of almost 8.3 knots.
Figure 2 shows the plots of the speed over ground
(SOG) and of the course over ground (COG) during
Analysis of the 21/22 October 2014 Storm Experienced by the Sailboat ECO40 in the Gulf of Lion
291

the Gulf of Lion Event. We recall that these values
are not the instantaneous ones but are the values
averaged over a time interval of 10 minutes.
Figure 1: The route between the Asinara Island and the
Balearic Islands that the boat ECO40 has followed.
Figure 2: Time series of the speed over ground (upper
panel) and of the course over ground (lower panel) during
the Gulf of Lion Event.
3 WEATHER ANALYSIS OF THE
GULF OF LION STORM
In the days 20 and 21 October 2014, the atmospheric
circulation was characterized by a zonal flux from
West to East in the Northern of Europe. A high
pressure was centred on the Mediterranean Sea
(Figure 3 and Figure 4).
Figure 3: Surface Analysis for 20 October 2014 hour
00.00UTC (source: MetOffice).
Figure 4: Surface Analysis for 21 October 2014 hour
00.00UTC (source: MetOffice).
Figure 5: Upper Atmosphere Analysis at 500hPa for 21
October 2014 hour 12.00UTC (source: MetOffice). Color
filled area: temperature at 500hPa [°C]. Red solid line:
height level at 500hPa [mx10].
WPPDSports 2015 - Special Session/Symposium on Weather, Position and Performance data in Outdoor Sports
292
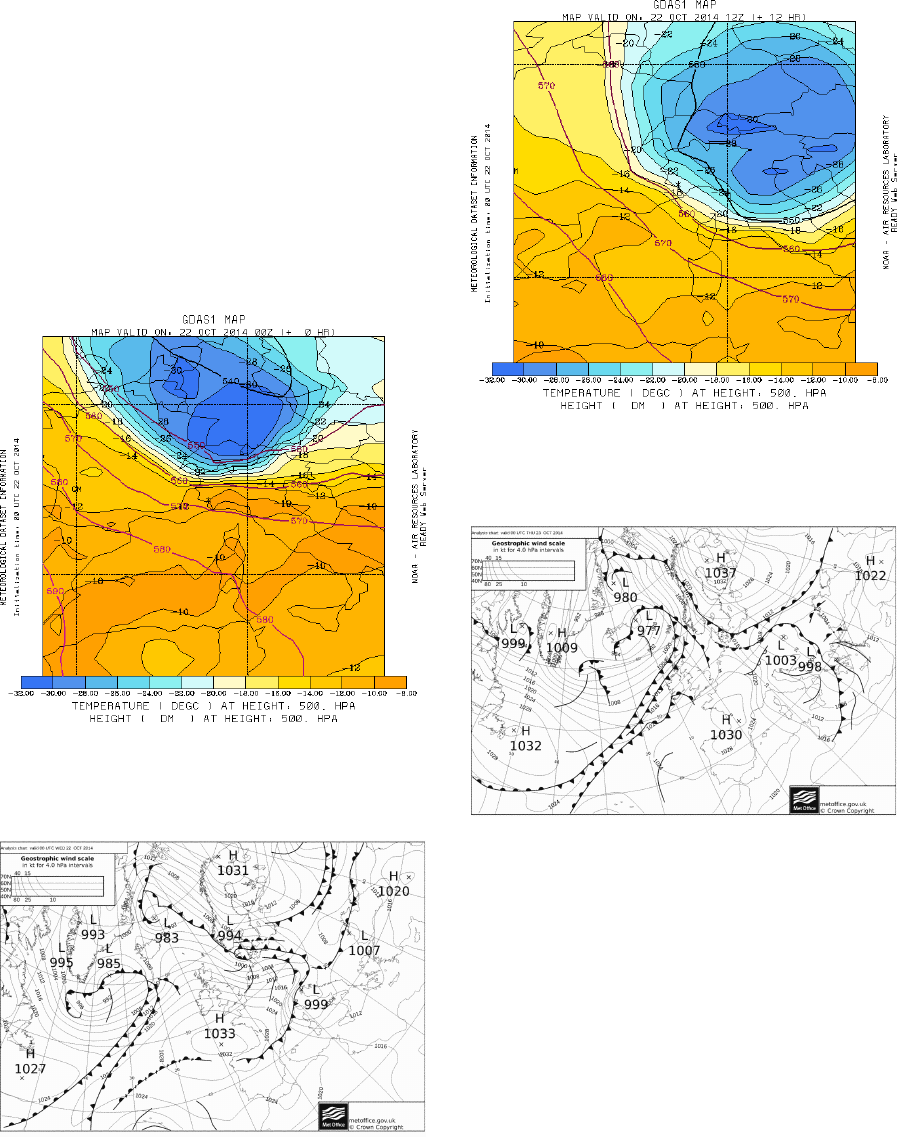
At the same time a frontal system, positioned
between a low pressure centred on the Atlantic
Ocean and a low pressure centred in the Poland’s
plan, started to move slowly toward South. The
movement of this frontal system was generated by
the faster change of direction of the zonal flux in the
UK island, in turn generated by the movement
towards East of the tropical low pressure “Gonzalo”.
The trough in upper atmosphere (see Figure 5)
associated with the cold air movement on the day of
October 21 and in the night of the October 22 (see
Figure 6), generated the movement to South of the
cold front (see Figure 7).
Figure 6: Upper Atmosphere Analysis at 500hPa for 22
October 2014 hour 00.00UTC (source: MetOffice). Color
filled area: temperature at 500hPa [°C]. Red solid line:
height level at 500hPa [mx10].
Figure 7: Surface Analysis for 22 October 2014 hour
00.00UTC (source: MetOffice).
Figure 8: Upper Atmosphere Analysis at 500hPa for 22
October 2014 hour 12.00UTC (source: MetOffice). Color
filled area: temperature at 500hPa [°C]. Red solid line:
height level at 500hPa [mx10].
Figure 9: Surface Analysis for 23 October 2014 hour
00.00UTC (source: MetOffice).
When the cold front encountered the Alps, it
developed the classical low pressure down-wind to
the mountain. Then a low pressure with the center at
998hPa was positioned on the Venice Gulf. The
opposition between this low pressure and the high
pressure with center at 1033hPa positioned on the
Biscay Gulf, jointly with the movement of the cold
air in upper atmosphere (see Figure 8), generated an
atmospheric situation characterized by an elevated
instability. This weather pattern was active on the
Mediterranean Sea for the entire day on October 22,
2014 and for a part of the October 23, 2014 (see
Figure 9)
This particular baric configuration generated
strong wind from N on the Mediterranean Sea in
Analysis of the 21/22 October 2014 Storm Experienced by the Sailboat ECO40 in the Gulf of Lion
293

particular on the Gulf of Lion, on the West of
Mediterranean Sea, on the Sicily Channel and on the
Sardinia Channel. Moreover, the slow movement of
the cold front and of the low pressure made an
adverse meteorological situation for a time as long
as 48h.
4 WIND DATA ANALYSIS
In this section the wind data measured on board
during the the Gulf of Lion event are presented and
analyzed.
The true wind speed V
w
and the true wind
direction θ
w
during the Gulf of Lion event, obtained
from the apparent wind and from the boat kinematic
characteristics, are shown in Figure 10. The upper
panel of Figure 10 shows the time series of the mean
values (i.e. averaged over 10 minutes) of the true
wind speed (black line) and the true wind gust (red
line) that represents the highest values of true wind
speed measured over 10 minutes. It is worth to note
that the maximum value of the averaged wind speed
reached 45 knots at the peak of the event, while the
values of the gusts were greater than 50 knots,
reaching a maximum value of 56 knots. The lower
panel of Figure 10 shows the time series of the true
wind directions; also in this plot both the quantities
that refer to the averaged values and the ones that
refer to the gust values are represented.
The upper panel of Figure 11 represents the
scatter plot between the averaged true wind speed
and the true wind gust. The plot shows that the wind
gust values are generally larger of about 15-20%
Figure 10: Upper panel: time series of the true wind speed
averaged over 10 minutes (black line) and of the true wind
gust (red line). Lower panel: time series of the true wind
direction averaged over 10 minutes (black line) and of the
true wind gust direction (red line); note: the dotted black
line refers to the mean direction of the true wind (θ
w-m
during the event is 313.6°).
Figure 11: Upper panel: scatter plot between the averaged
true wind speed and the true wind gust; the red line
represents the functional relationship, as obtained by
applying a linear regression to the measured data. Lower
panel: scatter plot between the averaged true wind
direction and the true wind gust direction.
than the averaged true wind speed; also, the
difference between the averaged wind speed and the
gusts tends to increase as the wind speed increases.
In order to highlight this feature, the functional
relationship, as obtained by applying a linear
regression to the measured data, has been
represented (red line) in the upper panel of Figure
11.
These wind data, measured by ECO40 during the
Gulf of Lion event, have been compared with two
different sources of data. The first comparison has
been carried out with the ECMWF (European Centre
for Medium-Range Weather Forecasts) data. Data
are provided with a spatial resolution of 0.125° and
with a time resolution of 6 hours.
A second comparison has been carried out by
using the forecast data provided by the numerical
model GFS (Global Forecast System). It has to be
stressed that the output of this model, that has a
WPPDSports 2015 - Special Session/Symposium on Weather, Position and Performance data in Outdoor Sports
294

spatial resolution of 1.0° and a time resolution of 3
hours, are the ones which have been used for the
routing of ECO40.
The results of these comparisons are shown in
Figure 12. The upper panel of Figure 12 represents
the time series of (i) the averaged wind speed (black
line) measured by ECO40 by the anemometer placed
on the top of the mast (as shown in Figure 10), and
(ii) the time series of the wind speed obtained in
analysis and by the GFS, linearly interpolated (in
time and space) along the route of the boat between
Sardinia Island and the Balearic Islands. The results
of the GFS model (i.e. forecast data) are identified
by a red dashed line, while the results of the
ECMWF model (i.e. analysis data) are identified by
a continuous blue line. Now, the forecast data have
been sent to the boat on October 10, 2014; therefore
we can evince that they have a higher accuracy in
the first 24-48 hours; obviously, as shown in Figure
12 as the time increases (over 24-48) the agreement
between the forecasted data and the measured ones
deteriorate.
The upper panel of Figure 12 shows that the
wind speed values measured on board are larger than
those estimated by the numerical models. Indeed,
this comparison is not completely correct given that
the results of the numerical models are provided at
the conventional height of +10 m above the mean
sea level, while the wind data measured on board
have been registered at the actual position of the
anemometer that is placed on the top of the mast:
when the boat is at its rest position (i.e. the boat is
not heeled), then the height of the anemometer is
about +19 m above the mean sea level (i.e. the
height of the top of the mast). Thus, in order to
properly compare the measured data with the
numerical results, it is therefore necessary to reduce
the measured wind data to the height of +10 m
above the mean sea level. This has been carried out
by using the vertical profile of the wind speed
proposed by (Pierson, 1955). This relationship
describes a logarithmic vertical profile of the wind
velocity, that has the following functional form:
(1)
where U
z
is the wind speed at the height z, U
10
represents the wind speed at +10 m above the mean
sea level, C
10
is a coefficient that is function of the
flow regime of the wind speed and of the surface
roughness that theoretically depends on the waves
conditions. In order to estimate C
10
the functional
form proposed by (Wu, 1969) has been used.
Figure 12: Upper panel: comparison between the true wind
speed (averaged over 10 minutes) measured at the top of
the mast (black line) and the numerical model output of
the GFS (dashed red line) and of the ECMWF data in
analysis (continuous blue line). Middle and lower panel:
comparison between the true wind speed (averaged over
10 minutes), evaluated at the height z = +10 m above the
mean sea level (black line) l.m.m as a function of two
heeling angles (α = 35°, middle panel; α = 45°, lower
panel), ) and the numerical model output of the GFS
(dashed red line) and of the ECMWF (continuous blue
line).
As shown in the following relationship the
coefficient C
10
depends just on the wind velocity,
while it does not take into account the wave field
Analysis of the 21/22 October 2014 Storm Experienced by the Sailboat ECO40 in the Gulf of Lion
295
(2)
C
K
represents the Von Karman coefficient, equal
to 0.4. Thus, eq. (1) has been used to evaluate the
measured wind speed at the conventional height of
+10 m above the mean sea level, once the actual
wind speed U
z
and the actual measurement height z
are known.
As already pointed out, the anemometer is
placed on the top of the mast, thus its height (and of
course the measurement height z) can change over
time. This is related to the changes in the boat
heeling, which for certain sailing trim, can be
characterized by very pronounced heel angles.
Consequently, in order to carry out a proper
comparison between the measured wind data and
computed ones, a parametric analysis, by varying the
measurement height z, has been performed.
As qualitatively shown in Figure 13, the heeling
angle α modifies the measurement height to be used
in the equation (1). The middle and the lower panel
of the Figure 12 show the results of the comparison
between the measured wind data and the numerical
ones. In these case equation (1) has been used by
varying the heeling angle α (equal to 35° and 45°),
and the measurement height z (equal to 15.56 m and
13.43 m respectively). It appears that as the heeling
angle increases (e.g. α > 35°) then the measured
wind data and the numerical ones (both those
obtained by using the GFS and the ECMWF) are in
agreement.
Figure 13: Sketch of the measurement height z as a
function of the heeling angle α.
Ongoing research is focused on improving the
comparison between the measured wind data and the
calculated ones by using the trim boat
measurements, as obtained from GPS measurements,
and by using a more accurate relationship for the
vertical profile of the wind speed, that takes into
account the sea surface roughness in a real sea state
(i.e. presence of waves).
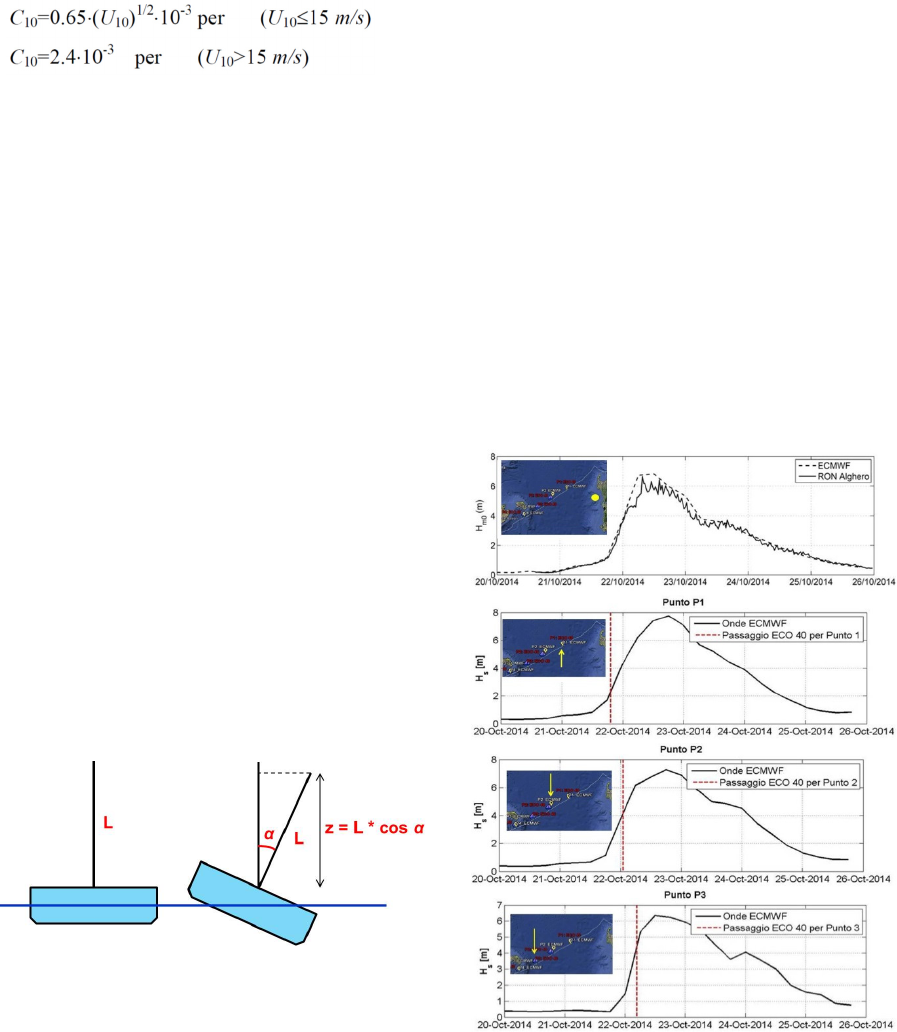
5 WAVE DATA ANALYSIS
This section describes briefly the analysis carried out
on the wave data collected during the Gulf of Lions
event. The available wave data sources are: the buoy
of Alghero (Italy), that is part of the RON (Italian
National Network for the wave measurements; see
Piscopia et al., 2002) and the data provided by the
numerical model of the ECMWF. Figure 14 shows
the time series of the significant wave height H
s
(left
panels) in few points of interest placed along the
route of the boat (right panels). The upper panel
shows the comparison between the significant wave
height H
s
measured by the Alghero buoy and the H
s
obtained by linearly interpolating the data provided
in analysis by ECMWF (dashed line). It is worth to
note that the two set of data are in good agreement:
indeed both the shape and the maximum values
appear quite similar. The remaining panels (second,
Figure 14: First panel (i.e. upper panel): comparison
between the significant wave height Hs measured by the
Alghero buoy and the same quantity obtained from the
analysis data of the ECMWF. Remaining panels (i.e.
second, third and fourth): evolution over time of the
significant wave height Hs, as obtained from the
numerical model of the ECMWF, evaluated in three points
of interest placed along the route of the boat. Note: the
vertical dashed red lines identify the time at which the
boat has passed in that point.
WPPDSports 2015 - Special Session/Symposium on Weather, Position and Performance data in Outdoor Sports
296
third and fourth) show the evolution over time of the
significant wave height H
s
, as obtained from the
numerical model of the ECMWF, evaluated in three
points of interest placed along the route of the boat.
The vertical dashed red lines identify the time at
which the boat has passed in that point and therefore
show the values of the significant wave height
experienced by the boat. Note that, in the future,
such numerical wave data will be compared with the
ones obtained by the signals measured by the three
high-precision GPS.
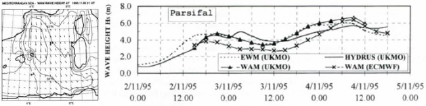
Finally, Figure 14 shows the significant wave
height time series during the Gulf of Lions storm of
November 1995 that has been reconstructed by
(Bertotti et al., 1998). We recall that this storm
caused the sinking of the Italian sailboat Parsifal and
the death of 6 crew members. Although a
quantitative comparison is not actually possible here,
we can qualitatively assess that the magnitude of the
sea state that ECO40 has faced is quite comparable
with that suffered by the Parsifal.
Figure 15: Significant wave height time series during the
Gulf of Lions storm of 2 November 1995 that has caused
the sinking of the Parsifal (Figures 5 and 6 of the paper of
Bertotti et al., 1998).
6 CONCLUDING REMARKS AND
ONGOING RESEARCH
This paper analyses the storm of October 21/22,
2014 faced by the boat ECO40 during the sailing in
the Gulf of Lion. The storm has been analysed on
the basis of the wind data, averaged over ten
minutes, measured and transmitted almost in real
time from the boat. These wind data have compared
with the ones obtained by using two numerical
models: the forecast data as from the GFS and the
analysis data as from the ECMWF. This comparison
has shown that the wind measurement height can
play an important role and therefore has to be
considered by knowing the arrangement of the boat
(i.e. heeling angle, etc.).
The measured values of the wind, averaged over ten
minutes, are comparable with the results obtained
from the numerical models: a good agreement is
noticeable within the first 24-48 hours. As the time
increases, then the numerical results tend to
deteriorate.
Furthermore, the forecast data seem to well predict
not only the magnitude of the event, in terms of
wind speed, but also the exact time of occurrence of
the storm peak, a parameter often prone to error.
A direct comparison between the forecast and the
measured wind showed relevant discrepancies, that
can be up to 50%. This difference is due to: (i) the
differences in altitude (i.e. the height at which the
wind measurements are carried out) that is estimated
to yield almost a 35% error and (ii) the gust
(approximately a 15% error).
Finally, we presented qualitative comparison
between the present wave data (obtained from the
RON buoy of Alghero and from the ECMWF
analysis data) and those reconstructed by (Bertotti et
al., 1998) that refer to the storm of November 1995
that caused the sinking of Parsifal. We have found a
substantial similarity in terms of sea-state magnitude
between the two events.
Currently, the ongoing research activities are
focused on improving the comparison between the
measured wind data and the calculated ones by using
the trim boat measurements, as obtained from GPS
measurements, and by using a more accurate
relationship for the vertical profile of the wind
speed, that takes into account the sea surface
roughness in a real sea state (i.e. presence of waves).
Furthermore, it is worth noticing that in the future a
comparison between the measured wave data, as
obtained by the signals measured by the three high-
precision GPS placed on the sailboat, and the ones
obtained from the available source of wave data (e.g.
numerical models, remote sensing techniques, wave
buoys, etc.) will be performed.
ACKNOWLEDGEMENTS
The authors would like to acknowledge Dr. Pier
Paolo Pecoraro (IDROGEOTEC) for his expertise
and help during the installation of the instruments.
The skipper Matteo Miceli is also acknowledged for
his contribution. A special acknowledgement is due
to Leica Geosystem for providing the high-precision
GPS reveivers.
REFERENCES
Bertotti, L., Cavaleri L., De Girolamo, P., Franco, L.,
Magnaldi S., 1998. Hindcast and forecast of the
Analysis of the 21/22 October 2014 Storm Experienced by the Sailboat ECO40 in the Gulf of Lion
297
Parsifal storm. Il Nuovo Cimento Vol 21, N. 3, pp.
281- 298.
Pierson, W. J., 1955. Wind generated gravity waves.
Advances in geophysics, 2, 93-178.
Piscopia, R., Inghilesi, R., Panizzo, A., Corsini, S.,
Franco, L., 2002, Analysis of 12-year wave
measurements by the Italian wave network.
Proceedings of the Coastal Engineering Conference.
Wu, J., 1969. Froude number scaling of wind-stress
coefficients. Journal of the Atmospheric Sciences,
26(3), 408-413.
WPPDSports 2015 - Special Session/Symposium on Weather, Position and Performance data in Outdoor Sports
298
