
Field Implementation of Eco-driving and Eco-signal System
Byungjin Ko
1
, Saerona Choi
2
, Byungkyu Brian Park
2
and Sang H. Son
1
1
Department of Information and Communication Engineering, DGIST, Daegu, Republic of Korea
2
Department of Civil and Environmental Engineering, University of Virginia, Charlottesville, U.S.A.
Keywords: Eco-driving, Eco-signal, V2X, and Speed Guidance.
Abstract: This paper proposed an integrated system between an eco-driving algorithm and an eco-signal control based
on vehicle-to-everything (V2X) communication, and evaluated the system’s environmental benefits. The
system calculates eco-speeds using vehicle information (e.g., current locations, vehicle speeds, and
acceleration profiles) and signal information. In addition, the system controls current signal phase to improve
fuel consumptions if a vehicle can pass the intersection by green time extension. We conducted field tests
with three scenarios to evaluate the system using dedicated short-range communication (DSRC) devices and
an external device that is able to collect vehicle specific information (e.g., speed and fuel consumption) within
controller area network (CAN).
1 INTRODUCTION
Excessive greenhouse gas (GHG) emissions have
negative effects including global warming (EPA, Ac-
cessed 21 Nov 2016). According to US environmen-
tal protection agency, transportation sector caused 26
percent of GHGs such as cars, trucks, etc. (EPA,
Accessed 22 Nov 2016). Given that the global
number of vehicles could reach 2 billion by 2035
(Voelcker, 2014), it is important to develop vehicle
technologies (e.g., electric vehicles) and vehicle
control strategies (e.g., eco-driving algorithms) to re-
duce fuel consumption and greenhouse gas emissions.
In terms of vehicle technologies, electric vehicles
have been considered an effective way to reduce
emissions, but its market penetration rate is still low.
Therefore, it is necessary to apply vehicle control
methods to minimize unnecessary vehicle idling time
and accelerations and to coordinate vehicle speeds
along the traffic signal. For this, it needs to allow
vehicle acceleration when a vehicle can pass an
intersection by accelerating and to avoid an abrupt
stop, a full stop, and idling time as much as possible.
We can also take advantage of vehicle-to-vehicle and
vehicle-to-infrastructure communications (a.k.a.,
V2X communication) by a dedicated short range
communication (DSRC) protocol so that we can
receive the traffic signal information or neighboring
vehicles’ trajectory information.
Many researchers have proposed various eco-
driving algorithms using V2X communication at a
signalized intersection to decrease fuel consumptions.
The general idea of these research is to recommend
speeds calculated by their own algorithms using the
current vehicle location and signal phase and timing
(SPaT) data, and to inform to the vehicle through
V2X communication. Rakha and Kamalanathsharma
used an explicit objective function to minimize the
total fuel consumption at a signalized intersection
(Rakha and Kamalanathsharma, 2011). Nunzio et al.
proposed an algorithm that provides a quick sub-
optimal solution for the fuel minimization problem
(Nunzio et al, 2013). Xia et al. performed a field test
using 4G/LTE network and cloud-based server
infrastructure at a fixed-time traffic signalized
intersection (Xia et al, 2012). Jin et al. proposed a
power-based longitudinal control algorithm for a
connected eco-driving system (Jin et al, 2016). These
research efforts clearly demonstrated potential
benefits of eco-driving system. However, their
proposed systems allowed that vehicles only receive
SPaT data transmitted via communication links from
an infrastructure, it means vehicles’ trajectories
should be decided considering given traffic signal
status. Therefore, it would be a more effective way to
minimize fuel consumptions if a vehicle’s trajectory
can be decided considering both the vehicle and
signal information via two-way communication
between the vehicle and an infrastructure.
Ko, B., Choi, S., Park, B. and Son, S.
Field Implementation of Eco-driving and Eco-signal System.
DOI: 10.5220/0006310002850292
In Proceedings of the 3rd International Conference on Vehicle Technology and Intelligent Transport Systems (VEHITS 2017), pages 285-292
ISBN: 978-989-758-242-4
Copyright © 2017 by SCITEPRESS – Science and Technology Publications, Lda. All rights reser ved
285
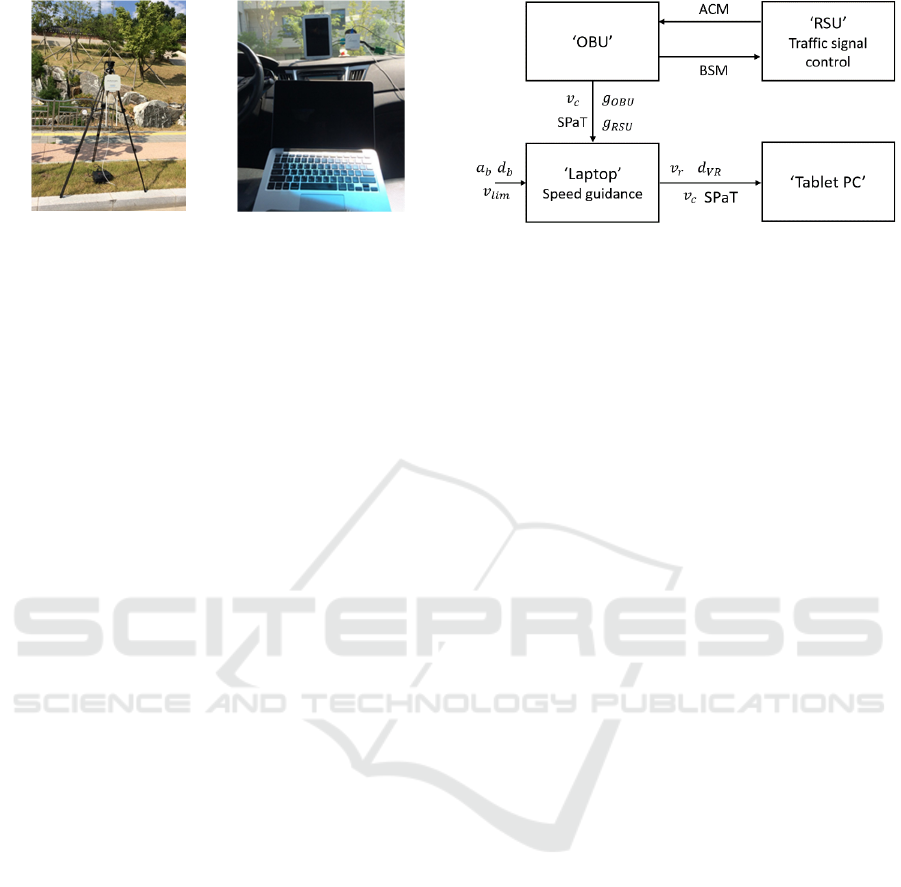
(a) (b)
Figure 1: Devices for a field test; (a): RSU; (b): Laptop,
tablet PC, and OBU.
In this paper, we proposed an eco-speed guidance
system including an eco-driving algorithm and traffic
signal controls. The system guides eco-speeds based
on SPaT, global positioning system (GPS), and
vehicle speed information collected via DSRC at a
signalized intersection. Moreover, we applied an eco-
signal mechanism in the proposed system that extends
remaining green time to avoid unnecessary
acceleration/idling time and reduce travel-time of
vehicle at a signalized intersection. Moreover, the
system used an interactive two-way communication
between an on-board unit (OBU) and a roadside unit
(RSU). The primary objective of this paper is to
reduce fuel consumptions by providing the eco-speed
guidance to a driver considering the driver’s accelera-
tion/deceleration behaviour. We deployed RSU on
the roadside of DGIST campus in Korea, OBU,
configured a vehicle with a tablet PC, and a laptop to
operate the eco-speed guidance system as shown in
Figure 1. RSU controls traffic signal phases consider-
ing the eco-signal mechanism using received vehicle
trajectory information and broadcasts a message
periodically that contains SPaT and its location
information. The laptop receives the message through
OBU. Based on the received information, the laptop
calculates recommended speed and displays the
calculated speed and SPaT information through the
tablet PC.
The main contributions of this paper are described
as follows. First, we presented an eco-speed guidance
system using a hybrid of eco-signal and eco-driving
mechanisms. Second, we proposed a system
architecture using interactive V2X communications
between a vehicle and RSU and tested the system in
field. Third, our proposed system reflects the driver’s
acceleration/deceleration behavior on the eco-driving
mechanism. Forth, we evaluated the proposed system
based on fuel consumption collected from a controller
area network (CAN) data using various scenarios.
The rest of this paper is organized as follows.
Figure 2: Flow chart of proposed eco-guidance system.
Section 2 illustrates the system model. The eco-
speed guidance and eco-signal algorithms are proposed
in Section 3. Section 4 describes the results of field
tests and performance evaluation. Finally, we conclude
the paper and discuss future work in Section 5.
2 ECO-GUIDANCE/SIGNAL
SYSTEMS
To decrease fuel consumptions at an intersection, a
vehicle is required to coordinate the speed based on
the SPaT information, the current speed, and the
remaining distance from the intersection. In this
section, we describe an eco-speed guidance system
that includes eco-driving and eco-guidance
mechanisms. Note that we only consider the scenario
that only one vehicle, which is equipped with OBU,
is on the road. To demonstrate our proposed system
in the real world, we set up a test-bed based on DSRC
and conducted the field test.
2.1 System Architecture
Figure 1 illustrates the devices used in our system.
RSU (LocoMate COMMANDO) is installed on the
roadside. OBU (LocoMate Mini2), a tablet PC, and a
laptop are mounted in a vehicle. RSU and OBU equip
their own GPS antennas. We used a single signal
phase (green, yellow and red) for an approach, and
the RSU controls the traffic signal.
Figure 2 shows the flow chart of proposed eco-
guidance system. RSU works for two main tasks: 1)
conducts a traffic signal control, 2) and extends the
current remaining green time if a vehicle, which
cannot cross an intersection within the green
remaining time, can pass the intersection with the
additional green time. In addition, RSU periodically
receives vehicle trajectory information from OBU
and broadcasts an a-la-carte message (ACM) that
VEHITS 2017 - 3rd International Conference on Vehicle Technology and Intelligent Transport Systems
286
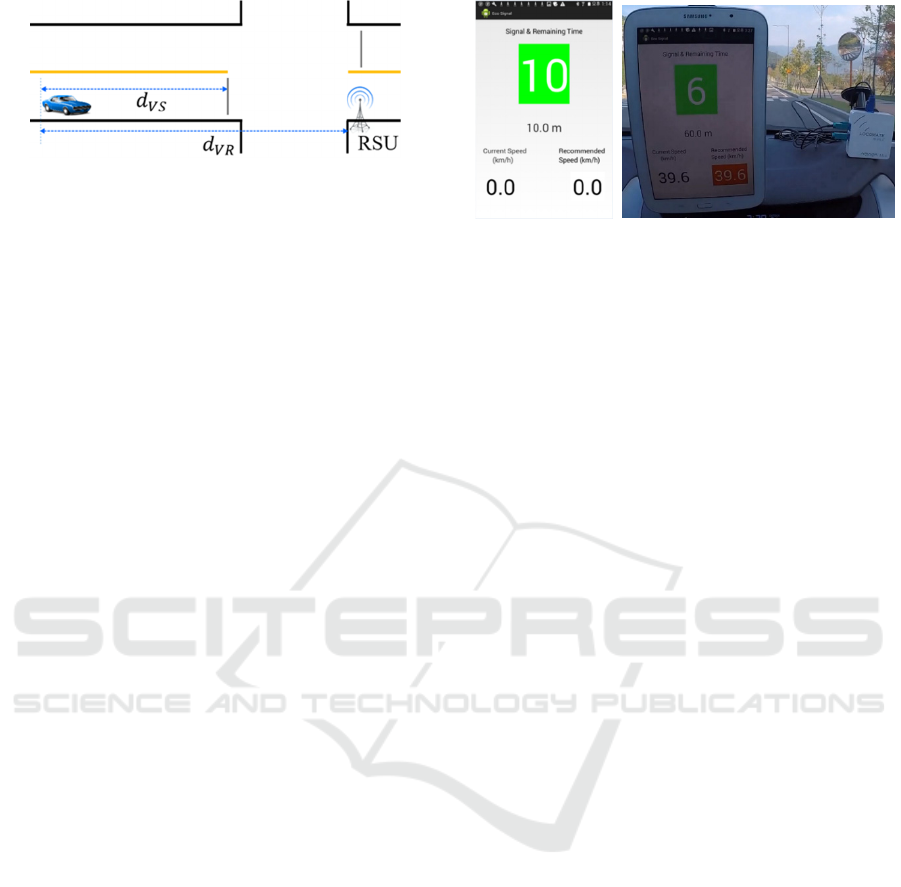
Figure 3: Road environment.
contains SPaT information and its GPS location. As
shown in Figure 3, RSU is deployed at the corner of
intersection. In order to describe the current state of a
traffic signal system, SPaT message is ordinarily used
along with the map message in an intersection (SAE
International, 2016). However, we only used ACMs
for including SPaT and location information because
we considered a simple scenario targeting on a single
vehicle. OBU broadcasts a basic safety message
(BSM) including the current GPS location and
vehicle speed via V2X communication in every 0.1
second, and it transmits the current speed, the location
information and the received information to the
laptop via user datagram protocol (UDP).
The laptop performs for the eco-speed guidance
using information from the OBU, the driver’s
acceleration behavior, and a speed limit (
). Then,
the recommended speed and vehicle maneuver (e.g.,
accelerating, speed maintenance, and decelerating)
are transmitted to the tablet PC, along with the current
speed, SPaT, and the remaining distance information.
The received information is represented on the screen
like Figure 4 (a). The numbers and shading color of
‘Signal & Remaining Time’ corresponds to the
current signal state and remaining signal times. When
the current speed exceeds the recommended speed,
the system changes the shading color to red to warn
the driver as shown in Figure 4 (b).
2.2 Vehicle Trajectory Planning
Acceleration behavior is important because it has a
critical impact on fuel consumption at a signalized
intersection. In previous research (Barth et al, 2011),
the best trajectory to minimize fuel consumption
accelerates to a target speed quickly and then keeps
the target speed until a vehicle passes an intersection
completely. Besides, the best trajectory for the
deceleration is to decrease the current speed to a
target speed quickly, and to keep the speed until the
vehicle reaches a stop bar. We used this concept to
plan a vehicle trajectory in the proposed system.
In addition, we considered following cases as test
scenarios. First, a vehicle maintains the current speed
to pass an intersection within the remaining green
(a) (b)
Figure 4: (a): Design of guidance application in tablet PC;
(b): Screen during the field test.
time. Second, a vehicle accelerates to pass the
intersection within the remaining green time. Third, a
vehicle passes the intersection in next green time
without a full stop when the vehicle cannot enter the
intersection at the current signal. Forth, a vehicle
accelerates to a target speed at yellow or red time,
when the vehicle does not reach the stop-bar with the
current speed until the signal changes to green,
instead of a lower speed approach to the stop-bar.
3 ALGORITHMS
The proposed system guides eco-speeds based on
SPaT information, the remaining distance from RSU,
the current vehicle speed, and driver’s accelera-
tion/deceleration behaviour. Moreover, the system
also considers the eco-signal mechanism that RSU
extends the remaining green time while it calculates
eco-speeds. The system updates the recommended
speed every second.
3.1 Eco-Speed Guidance Algorithm
The notations for an Eco-speed guidance algorithm is
described in Table 1. Several acceleration models
have been proposed and applied in previous studies
(Xia, 2013; Akcelik and Biggs, 1987; Rakha et al,
2004; Aycin and Bbnekohal, 1998) such as constant
acceleration, linear-acceleration, sinusoidal accelera-
tion, and polynomial acceleration. In this paper, we
used the constant acceleration model of which the
gradient is the average acceleration of driver in order
to calculate a recommended speed (
). The acceler-
ation model is presented in Figure 5 and equation (1).
(
)
=
+
( ≤
)
(
−1
)
(>
)
(1)
Field Implementation of Eco-driving and Eco-signal System
287
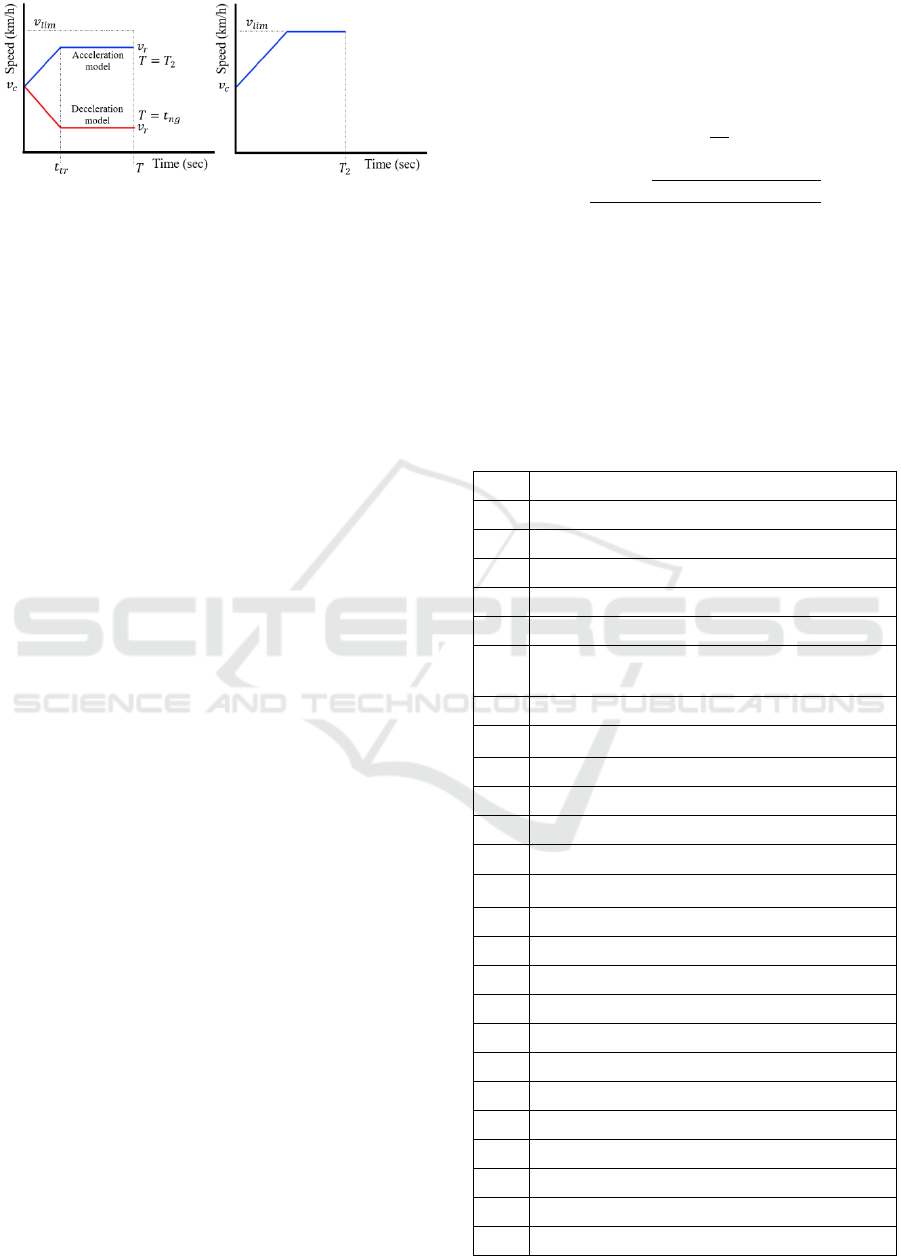
(a) (b)
Figure 5: Acceleration/deceleration profile; (a):
acceleration /deceleration to the recommended speed; (b):
acceleration to the speed limit.
In addition, there are deceleration models that are
similar with acceleration models. We used the
constant deceleration model of which the gradient is
the average deceleration of driver in order to calculate
a recommended speed when decreasing the speed to
the target speed. The deceleration model is presented
in Figure 5 (a) and equation (2).
(
)
=
−
+
( ≤
)
(
−1
)
(>
)
(2)
The speed controls such as acceleration, speed
maintenance, and deceleration depend on the
expected moving distance during the specific time in
every signal state. Accelerating is only allowed when
a vehicle can pass the intersection within green time.
For the acceleration at green, the expected maximum
moving distance during
, which follows the
acceleration model, needs to be longer than the
distance between a vehicle and RSU (
) where
represents the remaining green time (
) or the
expected remaining green time (
). It is represented
by
≥
.
is the expected remaining
green time to be extended according to the eco-signal
algorithm. When a vehicle cannot pass the intersec-
tion within
, the vehicle anticipates that RSU will
increase the remaining green time by the β
2
⁄
where β
is the maximum green extension time.
The maximum moving distance at green time repre-
sents the area of graph in Figure 5 (b), which repre-
sents the vehicle accelerates from the current speed to
and then maintains the speed during the remain-
ing green time. At yellow or red, the distance between
the vehicle and the stop bar (
) needs to be longer
than the expected moving distance during
with
the current speed (
) where
is the remaining
time until next green (
<
). If acceleration is
allowed,
is calculated using equation (3).
=
+
(3)
To this end, the time to recommended speed (
)
as shown in equation (5) needs to be calculated first.
It is calculated by equations (3) and (4).
should be
shorter than
where
includes
,
, and
.
=
(
)
=
(
+
)
+
(
−
)
(4)
=
(
)
(
)
(5)
There are two deceleration cases. First, the current
speed exceeds
, which is represented by
<
. Second, a vehicle will pass a stop-bar by
maintaining the current speed at red or yellow, which
is represented by
>
where
is the dis-
tance between the vehicle and a stop-bar. At the first
case,
is recommended to a driver when a vehicle
Table 1: Summary of notations.
average acceleration of driver
average deceleration of driver
distance between a vehicle and RSU
distance between a vehicle and a stop bar
(at green time) or
(at yellow or red time)
expected maximum moving distance during
expected moving distance with the constant speed
during
expected maximum moving distance during
expected maximum moving distance during
speed control
time to recommended speed
remaining green time
expected remaining green time (=
+β
2
⁄
)
remaining time until the next green
,
, or
or
recommended speed
current speed
speed limit
total delay time of n vehicles
traffic signal timing plan
arrival time at the stop bar of an individual vehicle v
D the total delay (second)
β green extension time
yellow interval
red interval
VEHITS 2017 - 3rd International Conference on Vehicle Technology and Intelligent Transport Systems
288
can pass an intersection with
within the remain-
ing green time. The other case, the recommended
speed is calculated with the same way of acceleration.
in equation (8) needs to be calculated first by
equations (6) and (7).
should be shorter than
.
Then,
is calculated by equation (6).
=−
+
(6)
=
(
)
=
(
−
)
+
(7)
=
(8)
In addition, there are two cases for speed
maintenance. First, a vehicle can pass an intersection
within current green time. The expected moving
distance of a vehicle during
(
) with the current
speed needs to be longer than
. It is represented
by
≥
. Second, a vehicle cannot pass an
intersection within current green time but it needs to
avoid a full stop and pass a stop-bar at next green
time. To this end,
with the current speed needs
to be same with the distance between a vehicle and a
stop-bar (
). It is represented by
=
.
Note that the system cannot always avoid a full stop
if
is not long enough.
Using this method, the proposed system calculates
the recommended speed regarding the acceleration,
the deceleration, and the speed maintenance. The
details of the algorithm are described in appendix 1.
3.2 An Eco-signal Algorithm
RSU extends the remaining green time to decrease the
fuel consumption. When a vehicle cannot pass an
intersection, it can avoid a full stop, idling time, and
acceleration from 0 to the target speed that cause
higher fuel consumption through the extended green
time.
We adopted an eco-signal mechanism proposed
by Jung (2016). It aims to minimize total delays at a
signalized intersection by exploiting a genetic
algorithm to find an optimal signal timing plan. As
described in equation (9), the optimal signal timing
plan is selected among feasible signal timing plans
with the number of n vehicles by minimizing delay.
More detailed information about the eco-signal
mechanism is described in literature (Jung, 2016).
min
∈,∈
∑
(
,
)
(9)
Subject to:
=
+β,,
,..,
+β,,
,1≤
(9.1)
≤
≤
(9.2)
0≤β≤β
(9.3)
Where
β is green extension time;
is a traffic signal timing plan;
is the arrival time at the stop bar of an
individual vehicle v;
D is the total delay (second);
and r are yellow and red intervals respectively.
Because we considered a single vehicle for field
tests, we do not exploit a genetic algorithm to find the
optimal value (β), which derives the minimum delay.
The algorithm pseudocode is presented in appendix 2.
4 PERFORMANCE
EVALUATION
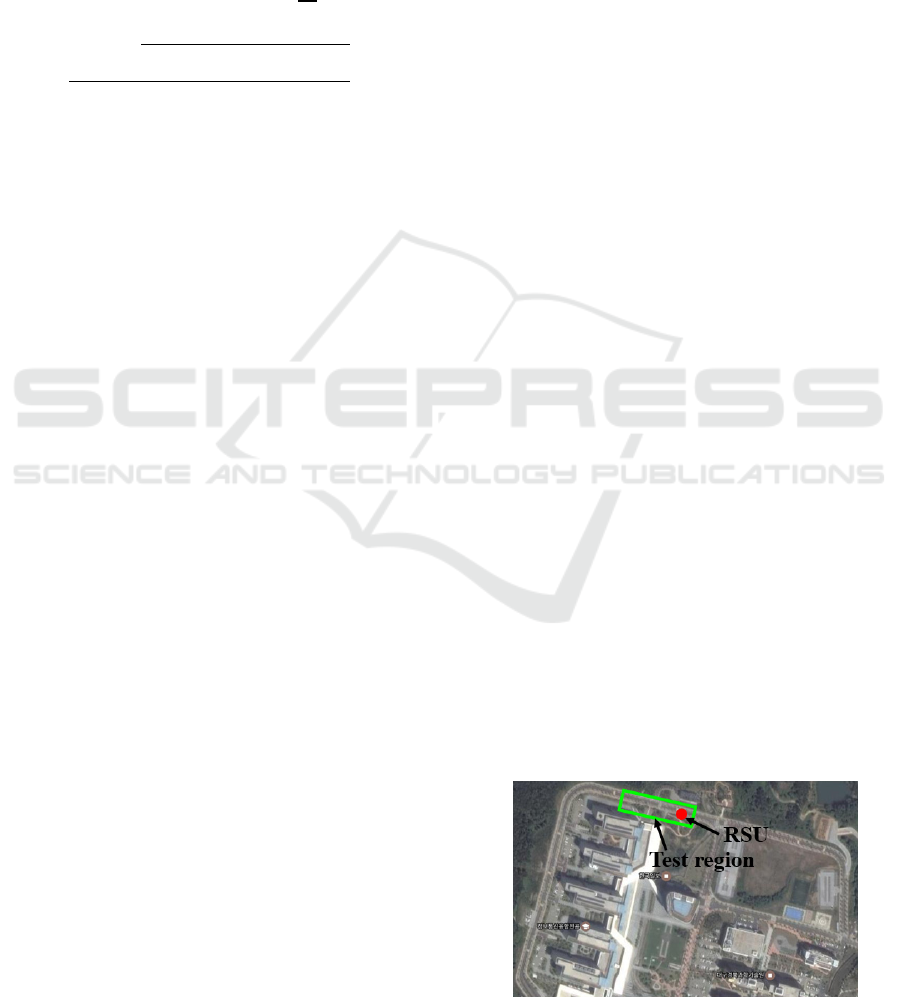
To evaluate the proposed system with field tests, we
installed RSU in DGIST campus as shown in Figure
6. The length of test-bed is 105 meters. We assumed
that the test-bed consists of two intersections; a
vehicle moves from the first intersection to the next
intersection. The distance between a stop-bar and
RSU is 15 meters.
is 40 km/h (11.12m/s).
is
1.7/
and
is 3.15/
. Green time and red
time are 20 seconds and yellow time is 3 seconds.
is 12 seconds. The vehicle used for field test is
Hyundai Avante MD.
We evaluated the system performance in terms of
fuel consumptions and travel-time. The exact amount
of fuel injected into the engine is measured through a
controller area network (CAN) in real time. The travel
time to cross the intersection is calculated based on
GPS information.
Figure 6: Field test region in DGIST campus.
Field Implementation of Eco-driving and Eco-signal System
289
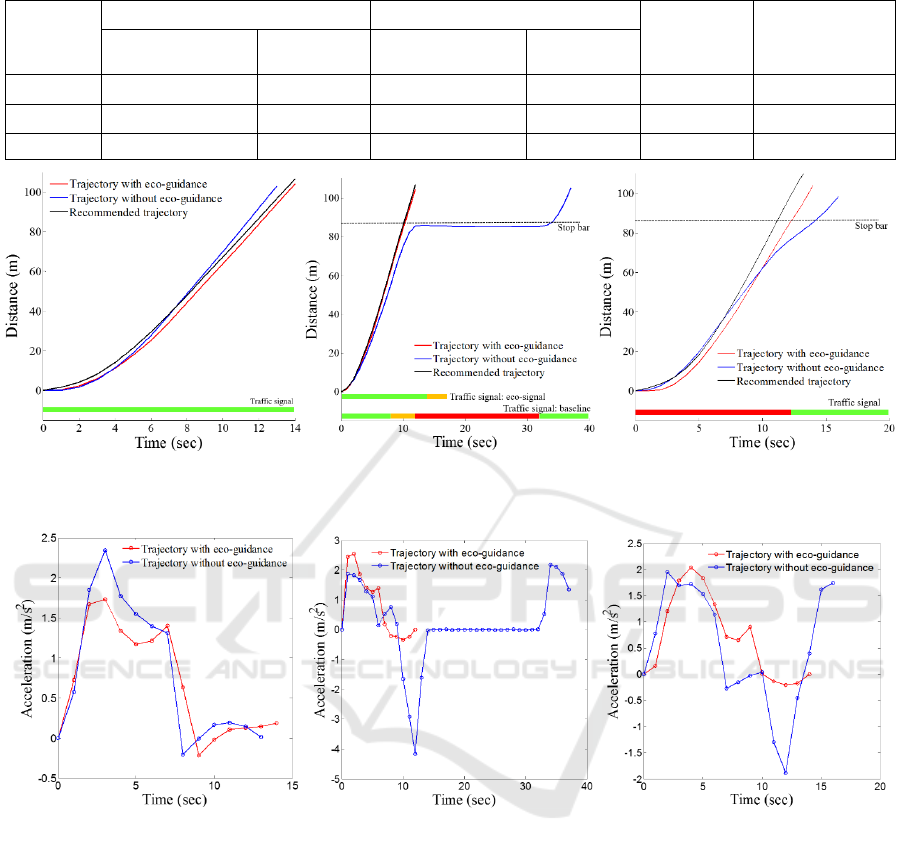
Table 2: Comparison of fuel consumption and travel time.
Scenario With the guidance Without the guidance Fuel saving Travel time saving
Fuel consumption
(ml)
Travel time
(sec)
Fuel consumption
(ml)
Travel time
(sec)
1 24.06 13.52 29.26 12.78 17.8 % -5.8 %
2 27.81 13.14 46.47 38.27 40.16 % 65.7 %
3 26.59 14.52 36.55 18.96 27.3 % 23.4 %
We compared the case with our proposed system
and without case. In the without case, information of
traffic lights is provided on a tablet PC without
remaining signal times. We conducted three scenarios
with a stopped vehicle: it starts 1) when remaining
green time is 15 seconds, 2) when remaining green
time is 7 seconds, and 3) when remaining red time is
12 seconds. Each scenario was conducted five times.
For each scenario, fuel consumptions and travel-
time of the vehicle compared statistically using t-test.
Note that the recommended speed is valid until
passing the RSU. The RSU needs to send SPaT infor-
mation of the downstream intersection to the vehicle
for the recommended speed after the vehicle passes
the RSU. Scenario 1 is to compare with/without the
system when the vehicle can pass the intersection
given remaining green time. Figure 7 presents vehicle
movements by a time-distance graph based on GPS
information. The vehicle accelerates from 0 to
or
the recommended speed and then maintains the speed
until passing the intersection. The case with the eco-
guidance took more time (5.8%) than without case to
pass the intersection as shown in Table 2 (α<0.05).
However, fuel consumption decreased by 17.8%
when the eco-guidance was applied (α < 0.05). This
is because the vehicle with the eco-guidance does not
accelerate to excessive speeds as shown in Figure 10.
Scenario 2 is to test the eco-guidance when the
Figure 7: Time-moving distance graph in
scenario 1.
Figure 8: Time-moving distance
graph in scenario 2.
Figure 9: Time-moving distance
graph in scenario 3.
Figure 10: Acceleration profile
in scenario 1.
Figure 11: Acceleration profile
in scenario 2.
Figure 12: Acceleration profile i
n
scenario 3.
VEHITS 2017 - 3rd International Conference on Vehicle Technology and Intelligent Transport Systems
290

vehicle could not pass the intersection within
remaining green time. In Figures 8 and 11, a vehicle
without the eco-guidance starts to decelerate the
speed from the yellow signal and waits for the green
signal at the stop bar. The vehicle with the eco-
guidance passed the intersection without deceleration
within the extended green time. As the results, the
eco-guidance significantly reduced fuel consumption
by 40.16% compared with the driving without the
guidance as shown in Table 2 (α < 0.05). This is
because the vehicle could pass the intersection
without unnecessary deceleration. Moreover, the eco-
guidance also significantly reduced travel-time by
65.7% to pass the intersection with the eco-guidance
system (α<0.05).
Scenario 3 is the case the red time remains 12
seconds. In this scenario, the vehicle without the eco-
guidance approached to the stop-bar without the
information of remaining red time. As shown in
Figure 9, the vehicle decelerated to the stop-bar and
then accelerated when the traffic light changed to
green. The vehicle with the eco-guidance accelerated
from 0 to the recommended speed and maintained the
speed during the remaining red time. As shown in
Table 2, the eco-guidance reduced fuel consumption
and travel time when compared without case by
27.3% and 23.4% (α<0.05), respectively. This is
because the vehicle does not need to decelerate while
approaching to the intersection during it followed
eco-guidance information.
Because the participants complied the eco-
guidance very well, vehicle speeds with eco-guidance
and recommended speed by eco-guidance were
similar as shown in Figures 7, 8, and 9.
5 CONCLUSION AND FUTURE
WORK
In this paper, we proposed an eco-speed guidance
system using a hybrid of eco-driving and eco-signal
mechanisms. Our system guides the recommended
speed to a driver based on driver acceleration/
deceleration behavior, SPaT information, and the
remaining distance from the intersection. We
evaluated our proposed system with field tests using
communication devices (e.g., DSRC) in terms of fuel
consumption collected via CAN data and travel time.
As a result, we found that the proposed system
contributes to reduce fuel consumption and travel
time when a driver complied eco-guidance
information.
In the near future, we will further investigate the
effect of multiple vehicles on the eco-guidance and
the safety critical issues and improve our system to
cover the more complicated situation on the vehicles,
which partially follow the guidance, in field.
Moreover, we will consider multiple intersections in
a wide test region to test various scenarios and the
more accurate vehicle localization to calculate the
precise recommended speed to overcome GPS errors.
ACKNOWLEDGEMENTS
This research was supported in part by Global
Research Laboratory Program (2013K1A1A2A0207
8326) through NRF, and the DGIST Research and
Development Program (CPS Global Center) funded
by the Ministry of Science, ICT & Future Planning.
REFERENCES
US Environmental Protection Agency (EPA). Climate
Change Indicators: U.S. and Global Temperature,
[Online], Available: https://www.epa.gov/climate-
indicators/climate-change-indicators-us-and-global-
temperature. [Accessed 21 Nov 2016].
US Environmental Protection Agency (EPA). Source of
Greenhouse Gas Emissions, [Online], Available:
https://www.epa.gov/ghgemissions/sources-
greenhouse-gas-emissions. [Accessed 22 Nov 2016].
Voelcker, J. (2014) 1.2 Billion Vehicles On World’s Roads
Now, 2 Billion By 2035: Report, [Online], Available:
http://www.greencarreports.com/news/1093560_1-2-
billion-vehicles-on-worlds-roads-now-2-billion-by-
2035-report. [29 Jul 2014].
Rakha, H. and Kamalanathsharma, R. K. (2011) ‘Eco-
driving at signalized intersections using V2I
communication.’, 14th International Conference on
Intelligent Transportation Systems, IEEE, Washington,
DC.
Nunzio, G. D., Wit, C. C. d., Moulin, P. and Domenico, D.
D. (2013) ‘Eco-driving in urban traffic networks using
traffic signal information.’, 52nd IEEE Conference on
Decision and Control, IEEE, Firenze.
Xia, H., Boriboonsomsin , K., Schweizer, F., Winckler, A.,
Zhou, K., Zhang, W. and Barth, M. (2012) ‘Field
Operational Testing of ECO-Approach Technology at a
Fixed-Time Signalized Intersection.’, 15th
International Conference on Intelligent Transportation
Systems, IEEE, Anchorage, Alaska.
Jin, Q., Boriboonsomsin, K. and Barth, M. J. (2016)
‘Power-Based Optimal Longitudinal Control for a
Connected Eco-Driving System.’, IEEE Transactions
on Intelligent Transportation Systems, vol. 17, no. 10,
Oct, pp. 2900-2910.
SAE International (2016) J2735 Dedicated Short Range
Communications (DSRC) Message Set Dictionary.
Barth, M., Mandava, S., Boriboonsomsin, K. and Xia, H.
(2011) ‘Dynamic ECO-driving for arterial corridors.’,
Integrated and Sustainable Transportation System
(FISTS), IEEE Forum on, Vienna.
Xia, H., Boriboonsomsin, K. and Barth, M. J. (2013)
‘Dynamic eco-driving for signalized arterial corridors
and its indirect network-wide energy/emissions
Field Implementation of Eco-driving and Eco-signal System
291

benefits.’, Journal of Intelligent Transportation
Systems, vol. 17, no. 1, pp. 31-41.
Akcelik, R. and Biggs, D. C. (1987) ‘Acceleration profile
models for vehicles in road traffic.’, Transportation
Science, vol. 21, no. 1, pp. 36-54.
Rakha, H., Snare, M. and Dion, F. (2004) ‘Vehicle
dynamics model for estimating maximum light-duty
vehicle acceleration levels.’, Transportation Research
Record: Journal of the Transportation Research Board,
vol. 1883, pp. 40-49.
Aycin, M. and Bbnekohal, R. (1998) ‘Linear acceleration
car-following model development and validation.’,
Transportation Research Record: Journal of the
Transportation Research Board, vol. 1644, pp. 10-19.
Jung, H., Choi, S., Park, B. B. and Son, S. H (2016) ‘Bi-
Level Optimization for Eco-Traffic Signal System.’,
5th
International Conference on Connected Vehicles
and Expo (ICCVE), IEEE, Seattle.
APPENDIX I
Pseudocode of eco-speed guidance algorithm
if green signal then
if
/
≤
and
≤
then
← speed maintenance;
←
;
end if
else if
/
≤
and
>
then
← deceleration;
←
;
end else if
else if
≥
then
← acceleration;
←
∗
+
;
end else if
else if
≥
then
if
<
then
← acceleration;
←
∗
+
;
if
=
then
←speed maintenance;
←
end if
end if
else if
=
then
← speed maintenance;
←
end else if
else
← deceleration;
←
;
end else
end else if
else
←
;
if
<
then
← acceleration;
end if
else if
=
then
← speed maintenance;
←
end else if
else
← deceleration;
end else
end else
end if
else if yellow signal then
if
/
>
then
← acceleration;
←
∗
+
;
end if
else if
/
=
then
← speed maintenance;
←
;
end else if
else
← deceleration;
←
/
;
end else
end else if
else
if
/
>
then
← acceleration;
←
∗
+
;
end if
else if
/
=
then
← speed maintenance;
←
;
end else if
else
← deceleration;
←
/
;
end else
end else
APPENDIX II
Pseudocode of eco-signal algorithm
for 0≤≤
then
←
+;
for n vehicles then
if
≥
then
←
;
end if
else
←
+
++;
end else
end for
if
−1
>
and >0 then
←;
end if
end for
VEHITS 2017 - 3rd International Conference on Vehicle Technology and Intelligent Transport Systems
292
