
Data Density Considerations for Crowd Sourced Population Estimations
from Social Media
Samuel Lee Toepke
Private Engineering Firm, Washington DC, U.S.A.
Keywords:
Population Estimation, Social Media, Enterprise Architecture, Volunteered Geographic Data, Twitter,
Amazon Web Services, Normalization.
Abstract:
When using social media data for population estimations, data density is of primary concern. A high density
of quality, crowd-sourced data in a specified geographic area leads to a more precise estimation. Nonethe-
less, data acquisition/storage has to be balanced against the provisioned cost/size constraints of the technical
implementation and the ability to receive data in that area. This investigation compares hourly population
estimations based on Tweet quantity, for several major west coast cities in the United States of America. An
estimation baseline is established, and data is artificially removed from the estimation to explore the impor-
tance of data density. Experimental data is obtained and stored using an enterprise cloud solution, density
observations/results are discussed, and follow-on work is described.
1 INTRODUCTION
Population estimation of an urban area is of criti-
cal importance for resource planning, emergency re-
sponse, land-use allocation, environmental protec-
tion, etc. Governing bodies have continued to rely on
a combination of traditional practices to generate pop-
ulation data; namely through the use of census infor-
mation, time-use surveys, land-use maps and geospa-
tial data. These methods are time consuming, of low
spatiotemporal precision, and costly to implement;
though novel fusion of the aforementioned methods
has been shown to increase utility (Freire et al., 2015).
In recent years, research involving the estimation
of population density of an urban space, using so-
cial media services, has been rapidly gaining inter-
est. A user of a social media service can generate
geospatially enabled ‘posts’ while tagging an image,
string of text, or other piece of information. Disag-
gregation of this data based on its latitude, longitude
and temporal components generates insight into the
population patterns of a given geographic space (Sagl
et al., 2012). Population estimation is best visualized
as a function of time and space; common represen-
tations include a dasymetric map (Mennis and Hult-
gren, 2006) and/or an occupancy curve (Stewart et al.,
2015).
Massive growth of connected technologies has
created new opportunities for using volunteered so-
cial media data to supplement traditional population
estimation methods. These technologies include:
• Social media services. Twitter, Facebook,
Foursquare, Panaramio, etc. allow users to gener-
ate geospatially enabled data, and make that data
publicly available (Goodchild et al., 2016).
• Pervasive computing devices. Modern smart-
phones and tablets are readily accessible, with a
low financial barrier to entry. The majority are
outfitted with a GPS sensor, touch-screen, battery,
Internet connection, and a full sensor suite.
• Highly available Internet. A constant, inexpen-
sive connection through cellular or Wi-Fi allows
distribution of generated data to a wide audience.
Using an application programming interface
(API) published by the social media service, it is fea-
sible to use an enterprise software solution to regu-
larly query these services, and receive/process crowd-
sourced data (Aubrecht et al., 2011). Denser data of-
ten leads to a more complete population estimation;
but constraints may limit the amount of data that can
be attained/stored/processed for a given area.
This investigation focuses on running data-loss
experiments on Twitter data obtained from the down-
town areas of cities in the United States of America
(USA). Data acquisition/processing is discussed, and
the implications of data-loss are explored in several
charts.
Toepke, S.
Data Density Considerations for Crowd Sourced Population Estimations from Social Media.
DOI: 10.5220/0006314300350042
In Proceedings of the 3rd International Conference on Geographical Information Systems Theory, Applications and Management (GISTAM 2017), pages 35-42
ISBN: 978-989-758-252-3
Copyright © 2017 by SCITEPRESS – Science and Technology Publications, Lda. All rights reserved
35

2 BACKGROUND
The field of earth observation consists of using elec-
tronic resources to explore the planet. Aforemen-
tioned growth of use/accessibility of smart devices
and social media services has enabled the ‘citizens as
sensors’ (Goodchild, 2007) paradigm, allowing con-
tributors to provide a wealth of crowd-sourced infor-
mation to those who are interested (Coleman et al.,
2009). This information can range from annotating
satellite data using the OpenStreetMap project (Hak-
lay and Weber, 2008), to contributing to a wiki page,
to reporting on unique geographic locations using text
or imagery. Not only does the contributed informa-
tion provide value, processing of the geospatial meta-
data can provide insight into the human population
patterns and individual activities throughout the day
(Aubrecht et al., 2016).
The use of volunteered data is not without chal-
lenges. It is imperative to not treat the data as abso-
lute; incorrect submissions can exist for any number
of reasons, and objective comparison to truth is of-
ten difficult to affect (Haklay, 2010). This specific
use case can have accuracy degraded by the use of
illicit accounts to boost perceived population in cer-
tain locations and/or venues. Nonetheless, the data is
still useful for this estimation, with follow-on work
including comparison against an objective measure.
One of the benefits of crowd-sourced data is also
one of its biggest drawbacks, the massive amount
of data being produced, consumed, processed, and
stored (Miller, 2010) (Boyd and Crawford, 2012). Ef-
fective knowledge extraction requires planning, pro-
visioning, maintenance and retiring of computational,
algorithmic and human resources. Policies on how
to best manage this data directly affect the end result
of processing, for each project. Constraints include
cost, time, skillset of investigators, access to enter-
prise/human resources, etc. With the intention of ex-
ploring how algorithmic output can change based on
data density, this investigation shows the implications
of artificial data loss on Twitter data being used for
population estimation.
Previously, only one city was the focus of inves-
tigation; recent code refactoring allows the rapid ad-
dition of new cities to query. Five major cities in the
western U.S. were chosen for the following reasons:
• Each city has a densely populated downtown area.
• The west coast is directly at risk for coastal and
seismic natural disasters. With a possible “Cas-
cadia Rising” (FEMA, 2016) level event in the
future, population estimation for emergency first
responders will be critical for cities like Portland
and Seattle (Heaton and Hartzell, 1987).
• A high level of tech-adoption, and voluntary use
of social media services by the city’s residents is
beneficial to the investigation.
The cities are as follows:
• San Diego, California (CA); a coastal town in
southern California with a large military presence,
and many institutions of higher learning.
• San Francisco, CA; a metropolitan port city sur-
rounded by water on three sides.
• San Jose, CA; the southern end of Silicon Valley.
• Portland, Oregon (OR); a counter-cultural and en-
vironmentally conscious city.
• Seattle, Washington (WA); home to many tech-
nology firms including Amazon and Microsoft.
The Tweets are retrieved/stored for the above
cities, and processed as described in the following
section.
3 ARCHITECTURE
Geospatially enabled, crowd-sourced Twitter data is
gathered using a modern enterprise implementation
based on elastic cloud and web services. This solution
is the next generation of the previous Twitter retriev-
ing software (Toepke and Starsman, 2015). While
the previous code was a proof of concept, this imple-
mentation is modularly designed for rapid expansion
to new cities of interest. This task is completed by
adding another configuration file with the specifica-
tions for the city, mainly the latitude/longitude coor-
dinates for each Twitter query.
Amazon Web Services (AWS) (Services, 2015) is
a suite of inexpensive cloud services that are available
to the general public. AWS’s cloud offerings have
gained massive growth in the past few years, and have
made a powerful platform available with a low barrier
to entry (Leong et al., 2015).
The AWS technologies used are as follows:
• Lambda, runs as a scheduled task twice an hour
that executes the source code, using a serverless,
code-in-the-cloud paradigm.
• DynamoDB, is leveraged as a fully managed,
NoSQL object store for the Twitter data.
• Elastic MapReduce (EMR), Data Pipeline, and S3
export the Twitter data to a text file for local pro-
cessing.
• Identity and Access Management, CloudWatch
and CodeCommit are used administratively.
GISTAM 2017 - 3rd International Conference on Geographical Information Systems Theory, Applications and Management
36

The source code is written using Java Platform,
Enterprise Edition (Oracle, 2016); and performs all
web service, security, data storage and AWS inte-
gration tasks. The inherent scalability/elasticity in
Lambda/DynamoDB allows the implementation to
grow organically as new cities are added, and with
no further infrastructure configuration from the devel-
oper. Architecture blueprint can be seen in Figure 1.
Figure 1: AWS Twitter Query/Storage Architecture.
To create the functionality of true geospatial
queries, the Java Topology Suite (JTS) (Suite, 2016)
is leveraged during Tweet processing. JTS is a
lightweight library that enables spatial analysis meth-
ods, and is utilized heavily by open source Java geo-
graphic information system projects, e.g. GeoServer,
GeoTools and uDig. In this case, the point-in-polygon
(Haines, 1994) algorithm is used, which allows geo-
graphic searching without a full geospatial solution
like PostgreSQL/PostGIS (PostGIS, 2016). While the
current Tweet collection code utilizes a quadrangle
with horizontal/vertical edges, JTS allows querying of
areas with arbitrary orientation and number of edge
vertices, which is critical when analyzing individual
structures.
Existing functionality that is not currently uti-
lized includes the creation of a geohash (Moussalli
et al., 2015) which is generated when each Tweet
is placed in the data store. The geohash string is a
lightweight description that allows efficient search-
ing for geographic neighbors. A geohash of twelve
characters is used, which maps to a cell space of
3.7cm*1.9cm (Elastic, 2016), and is more than ade-
quate precision for this work. The geospatial resolu-
tion of each Tweet is dependent on the device sub-
mitting the data, and the combination of technologies
leveraged e.g. global positioning, Wi-Fi, cellular tri-
angulation, etc. While none of the aforementioned
technologies have centimeter-level accuracy, the extra
length of the geohash does not add undue complex-
ity; and future-proofs the algorithm against increases
in resolution.
Twitter and Instagram were both considered as
sources of crowd-sourced data for reasons previously
elucidated (Toepke and Starsman, 2015). As of mid-
2016, the Instagram API is constructed such that
downloading freely available data for the purpose of
research is no longer supported. The API allows an
application to be in a ‘sandboxed’ or ‘production’
mode. If in sandboxed mode, the developer gets full
access to the Instagram API, but only posts from pre-
viously configured test users will appear in the query
results. This policy is effective from a development
perspective, but the lack of crowd-sourced data is a
non-starter for research of this nature.
When attempting to move the application to pro-
duction, the developer is required to select the current
state of the application. Only two states applied in
this case:
• “My app is still in development and/or is a test
app.”
• “Other.”
The selections caused the following responses
from the Instagram API:
• “We do not approve development or test apps.
Please only submit your app when it’s ready for
production.”
• “We do not accept submissions for integrations
that do not fall into one of the approved use cases.
You can find more information about valid use
cases in the Permission Review documentation.”
Thus, Instagram is no longer a viable option for
freely-available crowd-sourced research data in 2016.
There is a company (Gnip, 2016) which sells histori-
cal and/or full-stream access to social media data, but
the cost is out of scope for this work.
Once adequate data has been captured, the data
is exported from DynamoDB using an EMR job, and
saved into a text file for local processing. Using Java,
queries/experiments were run on the data to show the
implications of a loss of data density. The experi-
ments start with using 100% of the gleaned Tweets,
then proceed to remove 10% for each further run, until
the density is down to 0% of the original post quantity.
Charts are generated using an open source tool named
GNU Octave (Octave, 2016), and are discussed in the
results/observations section.
4 RESULTS/OBSERVATIONS
The data consists of geospatially enabled posts from
the Twitter API occurring from 2016-06-07 23:01:35
(GMT) to 2016-11-04 23:57:03 (GMT). Publicly
available web service APIs were used to download the
data in a JavaScript Object Notation format.
Upon processing the Twitter data from the col-
lection time period, immediate observations can be
Data Density Considerations for Crowd Sourced Population Estimations from Social Media
37
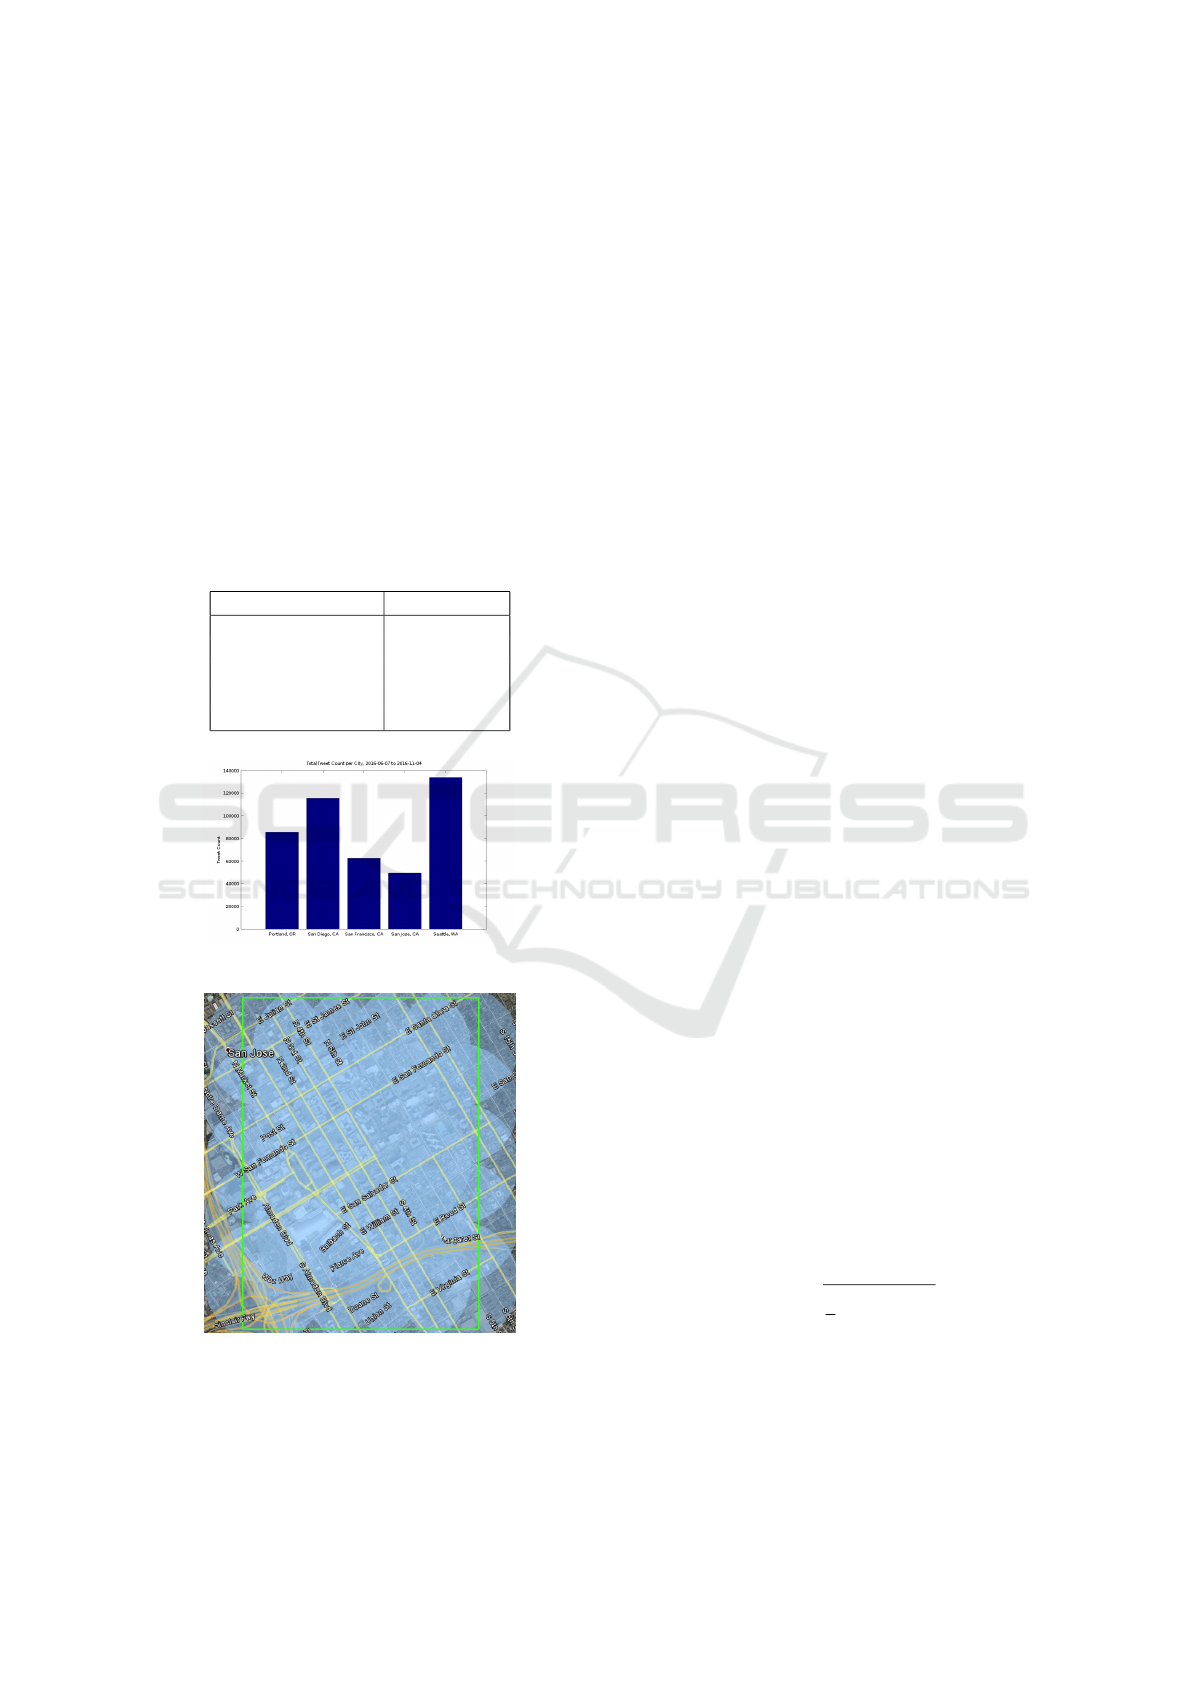
made. The raw Tweet count for the different cities
varies, with the most (Seattle, WA), having more
than twice as many Tweets as the least (San Jose,
CA), which can be seen in Table 1, and visualized
in Figure 2. A reason for the disparity is unknown,
and could range from differing population density, to
more/less user activity on social media services. Dur-
ing collection, the same geospatial distance is kept be-
tween the latitude/longitude boundary points for the
different cities, with the collection area being placed
over downtown as precisely as possible. The average
query area for each city is approximately 3.2633612
kmˆ2. A map visualizing the boundary, and overlap-
ping queries for the city of San Jose, CA can be see in
Figure 3.
Table 1: Total Tweet Count Per City.
City Tweet Count
San Jose, CA 49,557
San Francisco, CA 62,555
Portland, OR 85,745
San Diego, CA 115,574
Seattle, WA 133,955
Figure 2: Total Tweet Count Per City.
Figure 3: Twitter Query Locations and Boundary for San
Jose, CA.
On average, all cities show a dip towards the mid-
dle of the week, with Tweet count growing stronger
at the end of the week, which can be seen in Fig-
ure 4. Of note, Tweet collection from downtown San
Jose, CA for the investigation (Toepke and Starsman,
2015), shows a a parabolic curve from Sunday to Sat-
urday with a mid-week peak. The difference in the
curvature for the two datasets can be the result of dif-
ferent social media use-patterns that have developed
over the past two years, and/or the result of a non-
consistent collection time period.
To begin investigation of Tweet removal, Friday
was chosen as an experimentation day. The average
tweet count for Friday is not the lowest, nor the high-
est; but in the median. An average Tweet count per
hour can be seen in Figure 5. All cities show a strong
upward trend between 0600 and 0800, and a strong
downward trend between 1700 and 1800. The trends
correlate precisely with the beginning/end of the work
day. As expected, the lowest hours for Tweet genera-
tion are from 0000 to 0500, correlating to when users
are sleeping.
Normalizing each of the data sets is useful to view
the Twitter patterns independent of total quantity of
Tweets. Using a basic normalization algorithm (Abdi
and Williams, 2010), such that the length of each data
vector is equal to 1, the resulting graph for normalized
average Tweet count per hour for a Friday can be seen
in Figure 6. It is of note that San Francisco, CA gets
a slower start to the day, but tends to generate more
Tweets, for longer, after the end of the workday. This
is perhaps indicative of a strong ‘after-work’ social
culture; a similar pattern is also seen for San Diego,
CA.
Under the assumption that the full data is of 100%
quantity, Java code is used to randomly remove data
in increasing steps of 10%. These tests are performed
arbitrarily on Portland, OR, with the city being in the
median of the cities for Tweet quantity. Once normal-
ized, the resulting plots are shown in Figure 7. As
each plot has an increasing amount of data removed,
it can be seen deviating more from the full data line.
100% removal is not displayed, as there is no data
visible. Though coarse, even with 90% of the data re-
moved, the generated plot offers useful insights into
the population density throughout the day.
Root mean square error (RMSE) (Chai and
Draxler, 2014), is then used to better visualize the ef-
fects of decreasing data quantities. RMSE Equation:
RMSE =
s
1
n
n
∑
i=1
(y
i
− ¯y
i
)
2
(1)
Each resulting data vector is compared against the
full 100% data quantity vector, and the results can be
seen in Figure 8. A full averaging of all the days of
the week can be seen in Figure 9. Of note:
GISTAM 2017 - 3rd International Conference on Geographical Information Systems Theory, Applications and Management
38
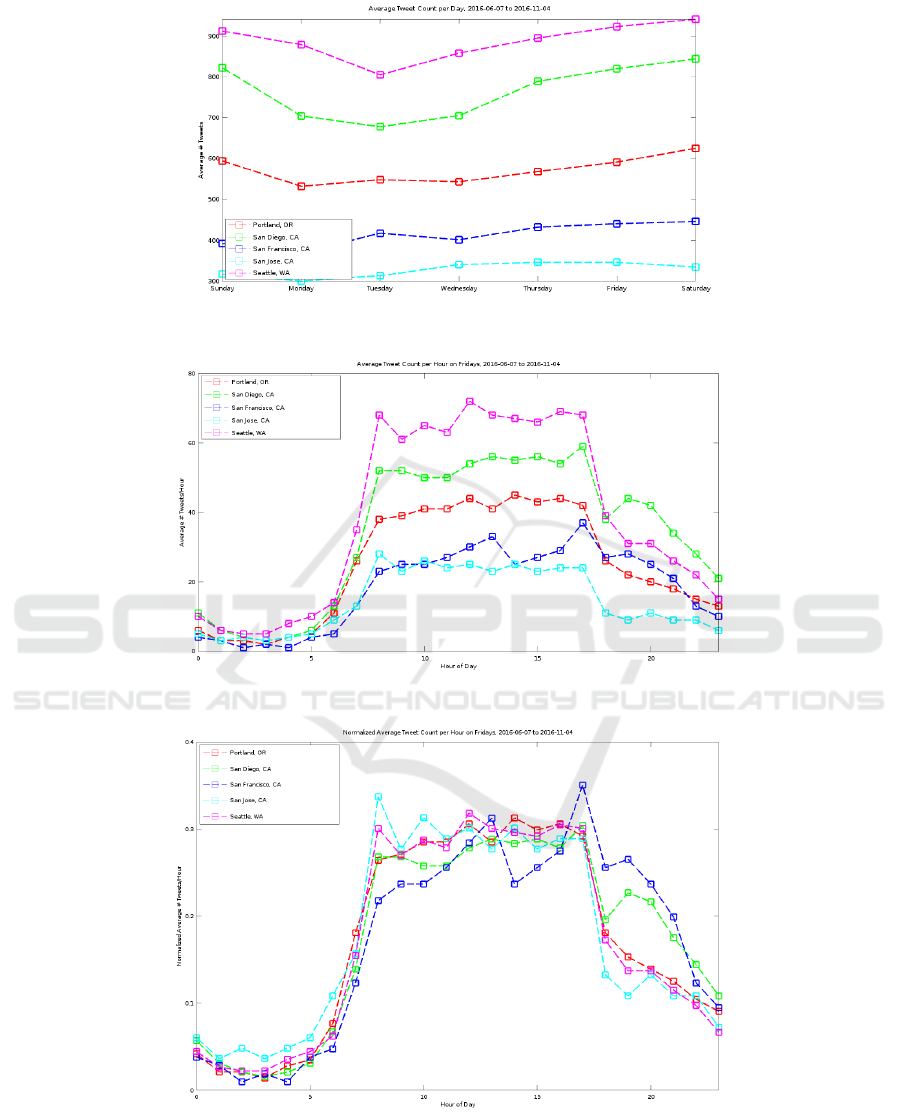
Figure 4: Average Tweet Count per Day.
Figure 5: Average Tweet Count Per Hour, Fridays.
Figure 6: Normalized Average Tweet Count Per Hour, Fridays.
• For each city, a pareto optimal point (Hochman
and Rodgers, 1969) exists between 50% and 90%
loss.
• A reasonable population estimation can still be
gleaned with even up to 50% of the data being
artificially removed.
• It can be seen that overall data quantity has an im-
pact on the RMSE, with the population estimation
Data Density Considerations for Crowd Sourced Population Estimations from Social Media
39
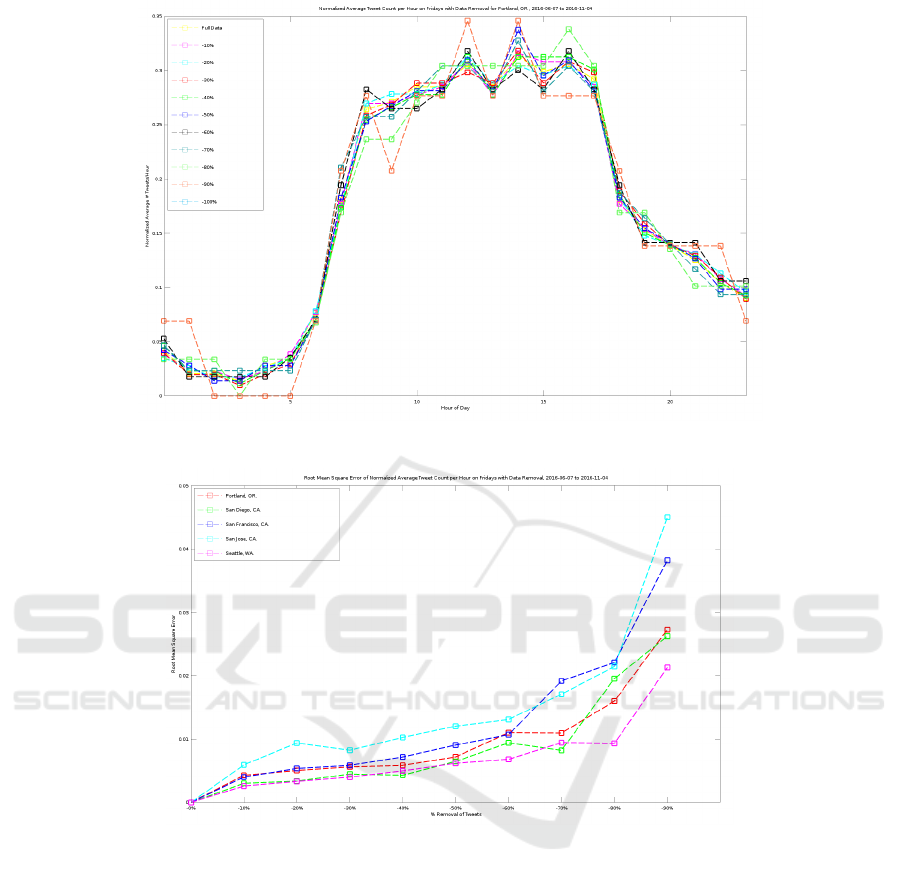
Figure 7: Normalized Average Tweet Count Per Hour, Fridays for Portland, OR with Data Removal.
Figure 8: Root Mean Square Error for Normalized Average Tweet Count Per Hour, on Fridays, with Data Removal.
of cities with the most overall Tweets being not as
adversely affected by loss of data. Seattle, WA
shows the lowest RMSE with San Jose, CA show-
ing the highest RMSE. This is seen visibly in Fig-
ure 9, which makes an average from all days of
the week.
This work processes estimations of a population,
based on voluntary social media data at a city-size res-
olution. Performing the same density reduction tests
using accurately obtained population data, e.g. from a
corporate campus that uses active access controls for
each person, would enhance insight.
5 FOLLOW-ON WORK
This investigation shows the ramifications of data
density for a population estimation using crowd-
sourced, geospatially enabled social media data.
There are many avenues for further work.
• It has been shown that due to the small amount
of Tweets that are actually geotagged, when using
the public API an almost complete set of Tweets
is available (Morstatter et al., 2013). Obtaining
full-stream Twitter data for the geospatial areas
in question, and comparing/contrasting with the
publicly available data would strengthen previ-
ously obtained results.
GISTAM 2017 - 3rd International Conference on Geographical Information Systems Theory, Applications and Management
40
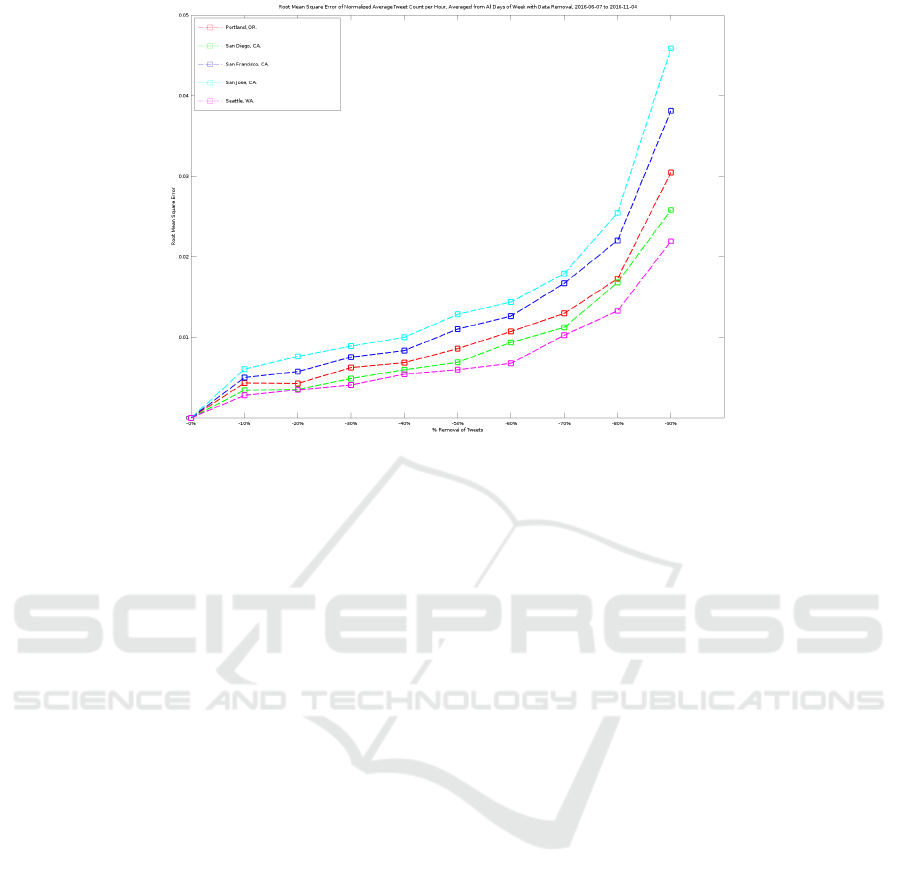
Figure 9: Root Mean Square Error for Normalized Average Tweet Count Per Hour, Averaged from All Days of Week, with
Data Removal.
• Perform experimentation on tighter geographical
boundaries. E.g., would these results still hold for
a single residential apartment building, a univer-
sity dormitory or a busy restaurant? What would
the impact of reduced data density be on structure
occupancy curves (Toepke, 2016) for a building
throughout days of the week?
• Integration of other social media sources such as
Twitter, Facebook, Foursquare, Panaramio, etc.
• Attempt to normalize data acquisition amongst
downtown areas. The investigation areas are
picked with care, but not with deep knowledge
of each urban area. One stadium in one city, or
several large office buildings, can skew the total
Tweets for an area.
• Experimentation in secondary and/or smaller
cities. Each city investigated has a large popu-
lation of technology adopters; which makes using
social media for population estimation possible.
Performing this work on cities that don’t generate
as much data would provide useful for showing
limitations of this work.
• The Twitter data collection code is still in-
flight. Comparing/contrasting estimation results
with data removal from different time periods can
glean useful results. E.g. data collected during a
holiday period may be vastly different from data
collected during an off-holiday season.
6 CONCLUSIONS
This work has described a new technical implemen-
tation for acquisition of crowd-sourced, geospatially
enabled Twitter data using AWS. Data is continuously
retrieved from five major west coast cities in the USA,
and the results of several data-removal experiments
are shown to elucidate the importance of data quan-
tity. RMSE error is calculated and displayed for each
city, averaged over an entire week; and estimation
precision is discussed. It is shown that even with a
large artificial loss of data, useful insights into popu-
lation dynamics can be seen; with error mitigated by
overall Tweet quantity.
REFERENCES
Abdi, H. and Williams, L. (2010). Normalizing data. En-
cyclopedia of research design. Sage, Thousand Oaks,
pages 935–938.
Aubrecht, C.,
¨
Ozceylan Aubrecht, D., Ungar, J., Freire, S.,
and Steinnocher, K. (2016). Vgdi–advancing the con-
cept: Volunteered geo-dynamic information and its
benefits for population dynamics modeling. Transac-
tions in GIS.
Aubrecht, C., Ungar, J., and Freire, S. (2011). Explor-
ing the potential of volunteered geographic informa-
tion for modeling spatio-temporal characteristics of
urban population: a case study for lisbon metro us-
ing foursquare check-in data. In International Con-
ference Virtual City and Territory (7
`
e: 2011: Lisboa),
Data Density Considerations for Crowd Sourced Population Estimations from Social Media
41

pages 57–60. Department of Civil Engineering of the
University of Coimbra and e-GEO, Research Center
in Geography and Regional Planning of the Faculty of
Social Sciences and Humanities of the Nova Univer-
sity of Lisbon.
Boyd, D. and Crawford, K. (2012). Critical questions for
big data: Provocations for a cultural, technological,
and scholarly phenomenon. Information, communica-
tion & society, 15(5):662–679.
Chai, T. and Draxler, R. R. (2014). Root mean square er-
ror (rmse) or mean absolute error (mae)?–arguments
against avoiding rmse in the literature. Geoscientific
Model Development, 7(3):1247–1250.
Coleman, D. J., Georgiadou, Y., Labonte, J., et al. (2009).
Volunteered geographic information: The nature and
motivation of produsers. International Journal of Spa-
tial Data Infrastructures Research, 4(1):332–358.
Elastic (2016). Geohash grid aggregation, elasticsearch ref-
erence 5.0.
FEMA (2016). Cascadia rising 2016.
Freire, S., Florczyk, A., and Ferri, S. (2015). Modeling day-
and night-time population exposure at high resolution:
Application to volcanic risk assessment in campi fle-
grei. In Proceedings of the Twelfth International Con-
ference on Information Systems for Crisis Response
and Management, Kristiansand, Norway.
Gnip (2016). Gnip.
Goodchild, M. F. (2007). Citizens as sensors: the world of
volunteered geography. GeoJournal, 69(4):211–221.
Goodchild, M. F., Aubrecht, C., and Bhaduri, B. (2016).
New questions and a changing focus in advanced vgi
research. Transactions in GIS.
Haines, E. (1994). Point in polygon strategies. Graphics
gems IV, 994:24–26.
Haklay, M. (2010). How good is volunteered geographical
information? a comparative study of openstreetmap
and ordnance survey datasets. Environment and plan-
ning B: Planning and design, 37(4):682–703.
Haklay, M. and Weber, P. (2008). Openstreetmap: User-
generated street maps. IEEE Pervasive Computing,
7(4):12–18.
Heaton, T. H. and Hartzell, S. H. (1987). Earthquake
hazards on the cascadia subduction zone. Science,
236(4798):162–168.
Hochman, H. M. and Rodgers, J. D. (1969). Pareto opti-
mal redistribution. The American Economic Review,
59(4):542–557.
Leong, L., Toombs, D., and Gill, B. (2015). Magic quad-
rant for cloud infrastructure as a service, worldwide.
Analyst (s), 501:G00265139.
Mennis, J. and Hultgren, T. (2006). Intelligent dasymet-
ric mapping and its application to areal interpola-
tion. Cartography and Geographic Information Sci-
ence, 33(3):179–194.
Miller, H. J. (2010). The data avalanche is here. shouldnt we
be digging? Journal of Regional Science, 50(1):181–
201.
Morstatter, F., Pfeffer, J., Liu, H., and Carley, K. M. (2013).
Is the sample good enough? comparing data from
twitter’s streaming api with twitter’s firehose. arXiv
preprint arXiv:1306.5204.
Moussalli, R., Srivatsa, M., and Asaad, S. (2015). Fast and
flexible conversion of geohash codes to and from lat-
itude/longitude coordinates. In Field-Programmable
Custom Computing Machines (FCCM), 2015 IEEE
23rd Annual International Symposium on, pages 179–
186. IEEE.
Octave, G. (2016). Gnu octave.
Oracle (2016). Java software.
PostGIS (2016). Postgis – spatial and geographic objects
for postgresql.
Sagl, G., Resch, B., Hawelka, B., and Beinat, E. (2012).
From social sensor data to collective human behaviour
patterns: Analysing and visualising spatio-temporal
dynamics in urban environments. In Proceedings of
the GI-Forum, pages 54–63.
Services, A. W. (2015). Overview of amazon web services.
Technical report. [Online; accessed 06-November-
2016].
Stewart, R., Piburn, J., Webber, E., Urban, M., Morton, A.,
Thakur, G., and Bhaduri, B. (2015). Can social media
play a role in developing building occupancy curves
for small area estimation? In Proc. 13th Int. Conf.
GeoComp.
Suite, J. T. (2016). Jts topology suite.
Toepke, S. (2016). Structure occupancy curve generation
using geospatially enabled social media data. In 2nd
International Geographical Information Systems The-
ory, Applications and Management, volume 1, pages
32–38.
Toepke, S. L. and Starsman, R. S. (2015). Population
distribution estimation of an urban area using crowd
sourced data for disaster response.
GISTAM 2017 - 3rd International Conference on Geographical Information Systems Theory, Applications and Management
42
