
EVARES: A Quality-driven Refactoring Method for Business Process
Models
Wiem Khlif
1
, Nouchène Elleuch Ben Ayed
2
and Hanêne Ben-Abdallah
2,1
1
Mir@cl Laboratory, University of Sfax, Sfax, Tunisia
2
King Abdulaziz University, K.S.A.
Keywords: BPMN Models, Transformation Rules Ordering, Perspectives, Quality Metrics, Quality Sub Characteristics.
Abstract: The business performance of an enterprise tightly depends on the quality of its business process model (BPM).
This dependence prompted several propositions to improve quality sub-characteristics (e.g. modifiability and
reusability) of a BPM through transformation operations to change the internal structure of the model while
preserving its external behaviour. Each transformation may improve certain metrics related to one quality sub
characteristic while degrading others. Consequently, one challenge of this model transformation-based quality
improvement approach is how to identify the application order of the transformations to derive the “best”
quality model. This paper proposes a local optimization-based, heuristic method to decide on the application
order of the transformations to produce the best quality BPM. The method is guided by both the perspectives,
and the impact of each transformation on the quality metrics pertinent to the perspectives as well as the quality
sub characteristics of interest to the designer. The method’s and an experimental evaluation are presented.
1 INTRODUCTION
To improve the performance of its business process,
an enterprise often needs to restructure its Business
Process Model (BPM). To provide for model
restructuring, several refactoring techniques have
been proposed, cf. (La Rosa et al., 2011). These
techniques are transformation-based and structural
pattern-driven, and they restructure a model without
changing its external behaviour. In addition, they are
quality focussed to assist business analysts to improve
quality sub-characteristics of the BPM like
understandability, reusability, and modifiability. For
example, several works (e.g. (La Rosa et al., 2011))
rely on the empirically shown fact that their
transformations can lead to “better structured”
models.
The model transformation-based approach to
improve the quality of a BPM faces two main
challenges: completeness of the transformation
operations, and identification of their application
order which produces the best quality model. The
second challenge is the focus of this paper where the
quality sub characteristics are assessed through a set
of BPM metrics.
The final quality of a BPM depends on the order
of application of the transformations for two reasons:
On the one hand, a transformation may have
conflicting impact on quality metrics and thus sub-
characteristics; on the other hand, being structural
pattern-based, the application of a transformation
enable and/or disable other transformations.
Evidently, with a large set of transformations, it is
impractical to try all possible (exponential number of)
combinations of transformations to identify the “best”
quality model. Evidently, an ad hoc application
approach defeats the restructuring purpose.
Face to this challenge, the literature is rather
silent. In fact, this challenge is addressed only by
(Fernández-Ropero et al., 2013) who statistically
proposes to apply the transformation categories in a
particular order; but, within one category, the
transformations are still applied in an ad hoc way. In
addition, none of the existing transformation-based
works, e.g. (Fernández Ropero et al., 2013), considers
the gain of transformation-based refactoring
techniques in terms of business perspectives and/or
quality sub-characteristics.
This paper proposes a new approach to tackle this
challenge within the method EVARES (EVAluation
and REStructuration of BPMN models) (Khlif et al.,
2017). EVARES is a quality-driven and
transformation-based method to refactor BPMN
Khlif, W., Ayed, N. and Ben-Abdallah, H.
EVARES: A Quality-driven Refactoring Method for Business Process Models.
DOI: 10.5220/0006315504090416
In Proceedings of the 19th International Conference on Enterprise Information Systems (ICEIS 2017) - Volume 3, pages 409-416
ISBN: 978-989-758-249-3
Copyright © 2017 by SCITEPRESS – Science and Technology Publications, Lda. All rights reserved
409

models. Its refactoring operations were determined
based on a set of structural patterns that we identified
empirically. It assesses quality in terms of a set of
pertinent metrics (e.g., CW, CFC, TNG, NSF, Den,
NOA, etc (Cardoso et al., 2006).
This paper enhances EVARES with a local
optimization-based, heuristic algorithm to decide on
the application order of the transformations to
produce the best quality BPM (Section 2). The
algorithm is guided by the perspectives (functional,
organizational, informational, behavioural), and the
impact of each transformation on the quality metrics
pertinent to the perspectives as well as the quality
sub-characteristics of interest to the designer. To do
so, we identify, for each transformation, the set of
modelling metrics that it affects. In addition, we
classify the transformations according to business
process perspectives and quality sub characteristics
(modifiability, comprehension and reusability)
(ISO/IEC25010, 2011). Besides presenting the
algorithm, this paper also presents how EVARES
assesses the quality of a BPM (Section 3) and the
EVARES tool (Section 4). Finally, Section 5 presents
related works and outlines future work.
2 RULE APPLICATION ORDER
IDENTIFICATION
EVARES (Khlif et al., 2017) is a method for
restructuring BPMN models based on semantic and
structural information. It operates in two phases:
restructuring followed by evaluation (Section 4).
The EVARES restructuring phase is driven by 28
transformation rules which we identified based on a
set of structural patterns we determined empirically
(Khlif et al. 2017). To facilitate their application, the
transformation rules operate on canonical fragments
that can be determined by the algorithm proposed in
(Polyvyanny, 2012) to decompose a BPMN model
into two special kinds of process fragments: Single
Entry Multiple Exit (SEME) to apply the behavioral
and informational rules, and Single Entry Single Exit
(SESE) fragments to apply the organizational and
multi-perspective rules. The selection of the
transformation rules is driven by the designer’s
perspective(s) of interest. Thus, we classify EVARES
transformation rules into organizational, functional,
behavioral, informational and multi-perspectives.
Due to space limitation, we present six rules (Khlif et
al., 2017) that we will illustrate, in section 4, through
the ‘Loan process’ example model.
R1-beh: If an exclusive gateway has fan-outs to two
parallel gateways G1 and G2 which are linked
respectively to activities A,B and A, C, then link B
and C to the exclusive gateway which will be linked
to A by a parallel gateway.
R2-Org: Merge directly connected activities
performed by two actors in the same lane and
associate the resulting activity with the actor who has
permission to perform the original activities.
R3_Org: Duplicate an activity in two lanes if it is
followed by a parallel fragment that is performed by
actors in the two lanes, and these actors have the
permission to perform the first activity.
R4-Org: If a lane contains only an activity
respectively followed or it is between two parallel
fragments which are performed by actors in different
lanes and who have the permission to perform the first
activity, then apply successively the following rules:
R3-Org, R2-Org.
R3_Org and R4_Org can also be applied in one lane.
We call, respectively, these variants R3_Org_V and
R4_Org_V. In this case, R4_Org_V applies
successively R3_Org_V and R2_Org.
R5_Inf: If there is more than one end event in
different lanes, then all end events will be grouped
with an exclusive, inclusive or parallel gateway,
depending on the initial structural context.
R6_Multi: If an inclusive fragment is attached to two
exclusive fragments containing a duplicated task,
then associate it to the actor who has the permission
to perform it.
Table 1 summarizes the effects of these rules on
the metrics. The minus sign (-) means the metric
should be minimized to improve the model, while the
plus sign (+) means the metric should be maximized
to improve the model quality; the sign NA means that
the metric is not affected by the rule.
We propose a greedy algorithm for the rule
application order identification problem (see
Algorithm 1). The algorithm expresses an optimum
local choice in the hope to produce a global
optimization. Once made, a choice cannot be
unperformed, even if, in one step, this choice is
detrimental to the production of an optimal solution.
ICEIS 2017 - 19th International Conference on Enterprise Information Systems
410
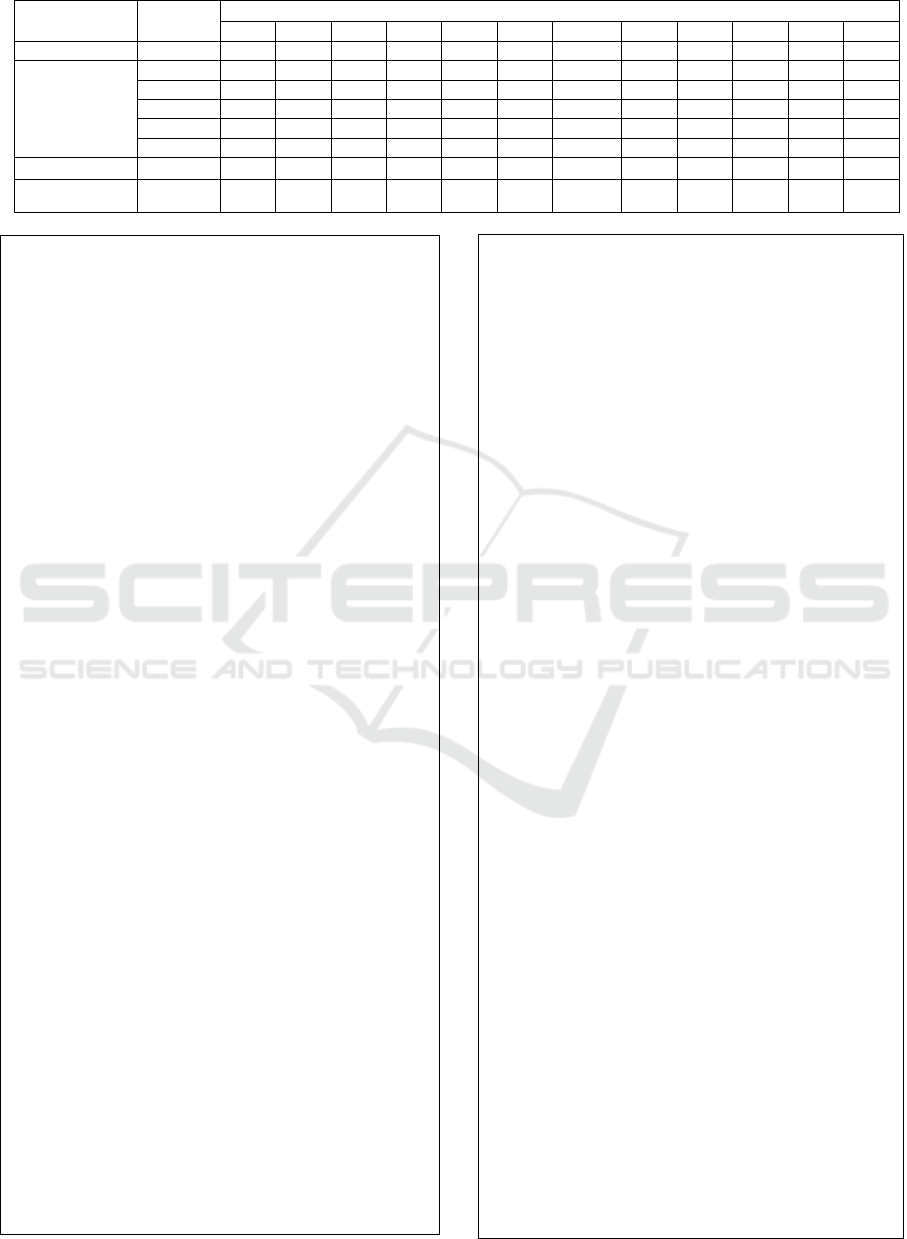
Table 1: Trends of quality metrics when applying the transformation rules.
Perspectives
Rules
Complexity and coupling metrics
CW
CFC
NSF
TNG
NL
NOA
NSFG
TNE
Den
GH
AGD
MGD
Behavioural
R1-Beh
-
-
-
-
NA
-
-
NA
-
-
-
-
Organizational
and functional
R2-org
-
NA
-
NA
NA
-
-
NA
-
NA
NA
NA
R3-org
-
-
-
-
-
-
-
NA
-
NA
NA
NA
R3_Org_V
-
-
-
-
NA
-
-
NA
-
NA
NA
NA
R4-org
-
-
-
-
-
-
-
NA
-
NA
NA
NA
R4_org_V
-
-
-
-
NA
-
-
-
-
NA
NA
NA
Informational
R5_Inf
NA
NA
-
-
NA
NA
-
-
-
NA
NA
NA
Multi-
perspectives
R6_Multi
-
-
-
-
NA
-
-
NA
-
-
-
-
Algorithm 1
Input: Model M, a Set of Rules SR, Choice
selected perspectives, a set of Metrics
SMeas divided to SMeas
-
to minimize and
SMeas
+
to maximize
Output: Metric Values newVMeas, a Set
of Selected Rules SRF to apply, and the
restructured model M1
1. Main(){
2. GQMcalGlobalQuality(M);
3. F[]decompose(M);
4. K1
5. While ( not empty(F[])){
6. Max0; Min99999;
7. For (j=1; j<=count(F[]); ++j) {
8. SRF[k][j]identifyRules(Choice[],SR[],F
[j]);// SRF: a set of rules to apply
based on the chosen perspective(s)
9. ARF[k][j]chooseApplicableRule
(SRF[k][j], F[j], M);// ARF: set of
applicable rules
10. M1transform(M, ARF[k][j]);
11. GQM[j]calGlobalQuality(M1);
12. If SMeas==SMeas
+
then {
13. if (max<GQM[j]) then{ maxGQM[j];
14. BRF[k] ARF[k][j];}} //this is:
best rule to apply in this iteration
15. else if (min>GQM[j]) then{minGQM[j];
16. BRF[k] ARF[k][j];}} }
17. M transform(M, BRF[k]);
18. F[]decompose(M); K++;}}
19. Function chooseApplicableRule(ARF,
F, M) return string{
20. VMeas[]calMeasuresValues
(SMeas, M);
21. If (ARF is empty) then exit;
22. Else For each rule R in ARF do
23. {Mtransform(M,R);
24. newVMeas[]=calMeasuresValues
(SMeas, M);
25. If SMeas==SMeas
-
then{ //R invokes
measures to minimize
26. flagTrue;
27. For (i=1; i<=count(VMeas);i++){
28. If(NewVmeas[i]>Vmeas[i])then
29. flagfalse; end if; }
30. If (flag==True) then return R;
31. Else{ // Compare gains to losses
32. gaincomputeGain(VMeas[],newVMeas[],
"to_minimize");
33. LosscomputeLoss(VMeas[],newVMeas[],
"to_minimize");} End if;
34. If gain>loss then return R;
35. Else if SMeas==SMeas
+
then{// R
invokes only measures to maximize
36. flagTrue;
37. For (i=1; i<=count(VMeas);i++){
38. If (NewVmeas[i]<Vmeas[i])then
39. flagfalse; end if;}
40. If (flag==False) then // Compare
gains to losses
41. {gaincomputeGain(VMeas[],newVMeas[]
,"to_maximize");
42. LosscomputeLoss(VMeas[],newVMeas[]
,"to_maximize");}End if;
43. If gain>loss then return R;}
44. Else // R invokes mixed measures
45. {NSum0; Sum0;
46. For (i=1; i<=count(VMeas);i++){
47. NSum+=NewVmeas[i]; Sum+=Vmeas[i];}
48. If NSum/Sum<=1 then return R;}}
49. Function calGlobalQuality(M) {
50. Var total=0;
51. VM[]calMeasuresValues(SMeas, M);
52. For(i=1;i<=n;++i){
53. total=+VM[i]*VM[i];}
54. return (square(Total));}
55. Function computeGain(VMeas[],
newVMeas[,objective)return number{
56. NSum0; Sum0;
57. For (i=1; i<=count(VMeas);i++){
58. NSum+=NewVmeas[i];Sum+=Vmeas[i];}
59. If (objective=="to_minimize") then{
60. Return (1-(NSum/Sum));}
61. Elseif (objective=="to_maximize")
then { return (1-(Sum/NSum));}}
62. Function computeLoss(VMeas[],
newVMeas[],objective) return number{
63. NSum0; Sum0;
64. For (i=1; i<=count(VMeas);i++){
65. NSum+=NewVmeas[i];Sum+=Vmeas[i];}
66. If (objective=="to_minimize") then{
67. Return (1-(Sum/NSum));}
68. Else if (objective=="to_maximize")
69. then {Return (1-(NSum/Sum));}}
EVARES: A Quality-driven Refactoring Method for Business Process Models
411

As described in Algorithm 1, the heuristic
identifies, for each instance M
i
of the model in an
iteration i, all rules applicable to the fragments
identified in M
i
while respecting the perspectives
chosen by the designer (lines 5-8). Then, the
algorithm examines, for each rule, if it improves the
overall quality (See Exp. 1) of a model M
i
in order to
determine their applicability and retain it as candidate
(lines 19-48). This decision takes into account how
the metrics affected by each rule will be interpreted to
obtain a good quality model. This leads to three
possible cases: all metrics must be minimized (lines
25-34), all metrics must be maximized (lines 35-43),
or the metrics are the mixture of the two cases (line
44-48). In each case, the rule is retained only if the
new metrics’ values are not against their tendency as
shown in Table 1.
If the designer chooses a perspective and there is
no applicable rule, the algorithm considers all rules
on an equitable basis. Once the rules to be applied are
identified, the algorithm selects the best rule that
improves the overall quality lines (12-17).
The overall quality is calculated based on all
metrics that are assumed to be minimized or
maximized. Given the metrics and their values,
v
1
,...v
n
, the overall quality of a model M is defined as
follows:
n
2
2
2
1
2
v+....+ v+v
i
MQ
(1)
Note that Algorithm 1 stops if the model M
i
does not
contain any fragments or no rule is applicable.
3 EVARES QUALITY
EVALUATION
EVARES proposes an evaluation method based on a
quantitative measurement and an interpretation. The
evaluation method can be driven by either the
perspectives or the quality sub-characteristics.
3.1 Perspective-driven Measurement
and Interpretation
In EVARES, the measurement activity pilots the
restructuring process based on the selected
perspectives, and it estimates the added value of the
restructuring process. The quality metrics
measurement compares the initial BPMN model and
the restructured one. It calculates all metrics and
classifies them in the two levels (Khlif et al., 2017).
At the first level, the metrics belong to one of three
categories: complexity, coupling and cohesion. At the
second level, the metrics of each category are
associated to perspectives.
Each time a rule relative to the designer’s
perspective is identified as applicable, the values of
all its impacted metrics are calculated and saved in a
report classified according to its quality sub-
characteristics. The interpretation uses the initial
model report (M
i
) and the restructured one (MR). It
calculates the improvement ratio RI
mi
(lines 55 -69).
A positive RI
mi
indicates that the transformation
improves the model quality; otherwise, it degrades it.
3.2 Quality Sub-characteristics-driven
Measurement and Interpretation
Even when the calculated improvement Ratio (RI)
indicates an improvement in the restructured model
based on the business/organizational goals, what
about the model’s intrinsic quality? That is, what is
the impact of restructuration based on quality sub-
characteristics such as understandability,
modifiability and reusability? The model quality
depends on the metrics’ tendency associated with
each sub-characteristic.
3.2.1 Case of Metrics to Minimize or
Maximize
The measurement activity produces for each quality
sub-characteristic the associated metrics and their
values. The interpretation of the quality metrics gives
an evaluation of the business process quality based on
the following information for each metric:
a priority order between the metrics based on
their use frequency. It is deduced from the
literature (Cardoso et al., 2006).
a threshold interval that reflects the optimal
value of a metric. It is the result of empirical
studies (Sánchez-González et al., 2010).
Given the priorities and the values, the
interpretation activity determines the sum
k
weighted by the priorities and the metrics values
associated to the same quality sub characteristic
.
k
D
Formally, for each sub-characteristic
k
D
, the global
quality model
k
is calculated as follows:
Let
1
,..
n
pp
the priorities assigned to each
metric in
k
D
.The weight of each metric is:
1
ik
ik
n
ik
i
p
p
(2)
ICEIS 2017 - 19th International Conference on Enterprise Information Systems
412
Let
1
,..
n
vv
be the metrics’ values determi-
ned by the measurement activity. Then:
1
n
k ik ik
i
v
(3)
After that, we calculate the sum
mink
(resp.
maxk
) of
the metrics threshold minimal values (resp. maximal
values) in a sub-characteristic
k
D
. These values are
weighted by the metrics priorities
ik
.
mink
et
maxk
are calculated as follows:
Let
minik
t
and
maxik
t
the minimal and maximal
thresholds associated to the metrics. Then:
min min
1
n
k ik i k
i
t
(4)
max max
1
n
k ik i k
i
t
(5)
The comparison between
mink
et
maxk
provides an
assessment (efficient, medium or inefficient) of the
model according to the sub-characteristics
.
k
D
min maxk k k
(6)
3.2.2 Case of Mixed Metrics
To assess the BPM quality in the case of mixed
metrics (i.e., they have tendencies to be minimized
and maximized) in the same sub-characteristic, we
use fuzzy logic (Zadeh, 1965) which is based on
"degrees of truth". Fuzzy sets have elements with
degrees of membership. In fact, we calculate, for each
category of metrics’ tendency, the membership
degrees of the metrics.
For the metrics that should be maximized :
We calculate the membership degree
i
q
associated
to each metric m
i
that should be maximized:
min
max min
i
i
vv
q
vv
(7)
Where
i
v
: the metric value,
min
v
: the metric threshold minimal value
max
v
: the metric threshold maximal value
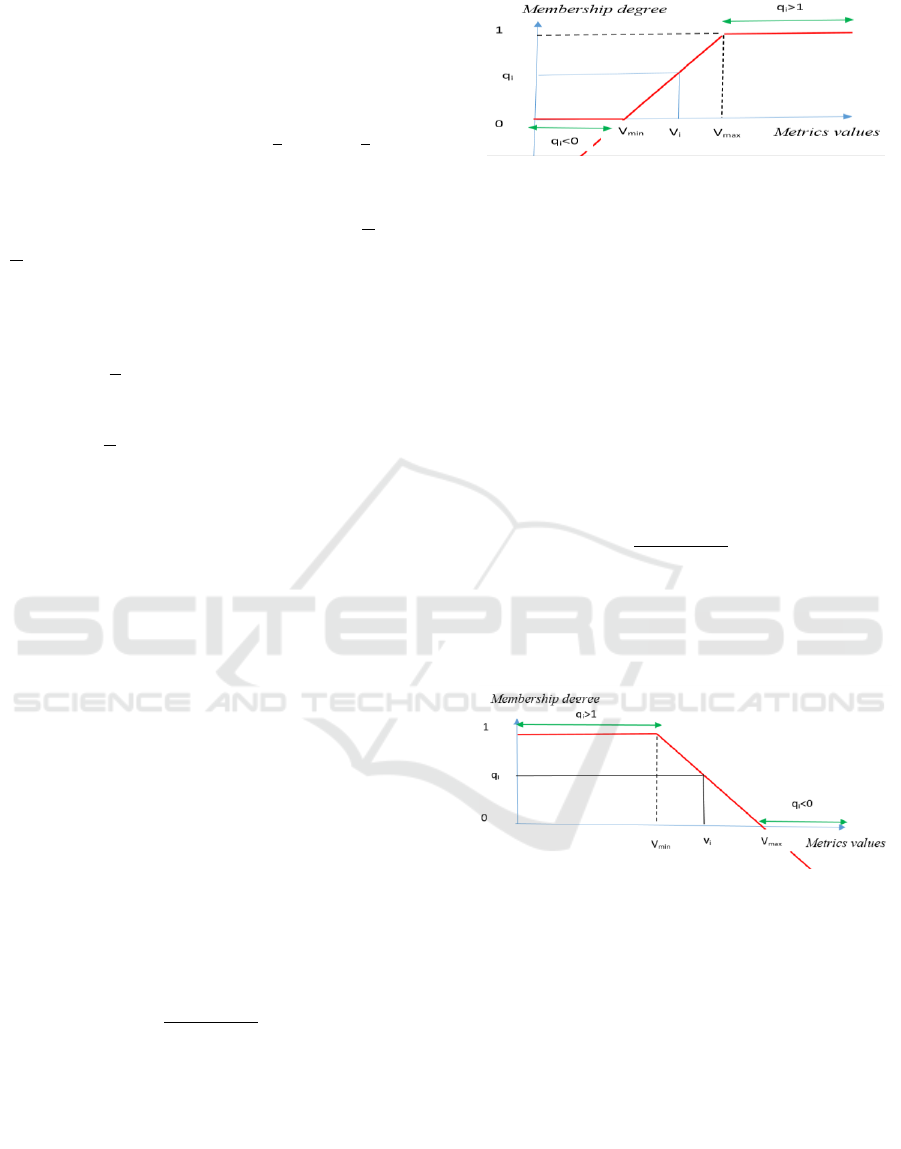
Fuzzy logic allows different degrees of response to
the question "Is the metric value high? "(Figure 1) :
Figure 1: Membership function of a fuzzy set of metrics that
should be maximized.
Below or equal
min
v
, the metric value is
high with a 0% confidence level.
Above or equal to
max
v
, the metric value is
high with a 100% confidence level.
In
min max
,vv
, the metric value
i
v
has a
high value with a
i
q
confidence.
For the metrics that should be minimized:
We calculate the membership degree
i
q
associated
to each measure
i
m
that should be minimized:
max
max min
i
i
vv
q
vv
(8)
Where
i
v
: metric value,
min
v
: metric threshold minimal value
max
v
: metric threshold maximal value
Figure 2: Membership function of a fuzzy set of metrics that
should be minimized.
Fuzzy logic also allows to respond to the question
"Is the metric value minimal? "(Figure 2) :
The metric value is minimal with 100%
confidence level if it is equal or below
min
v
.
The metric value is minimal with 0%
confidence level if it is equal or above
max
v
.
In
min max
,vv
, the metric value
i
v
is minimal
with a
i
q
confidence degree.
In each case (metrics that should be maximized or
minimized), the membership degree is equal to:
EVARES: A Quality-driven Refactoring Method for Business Process Models
413
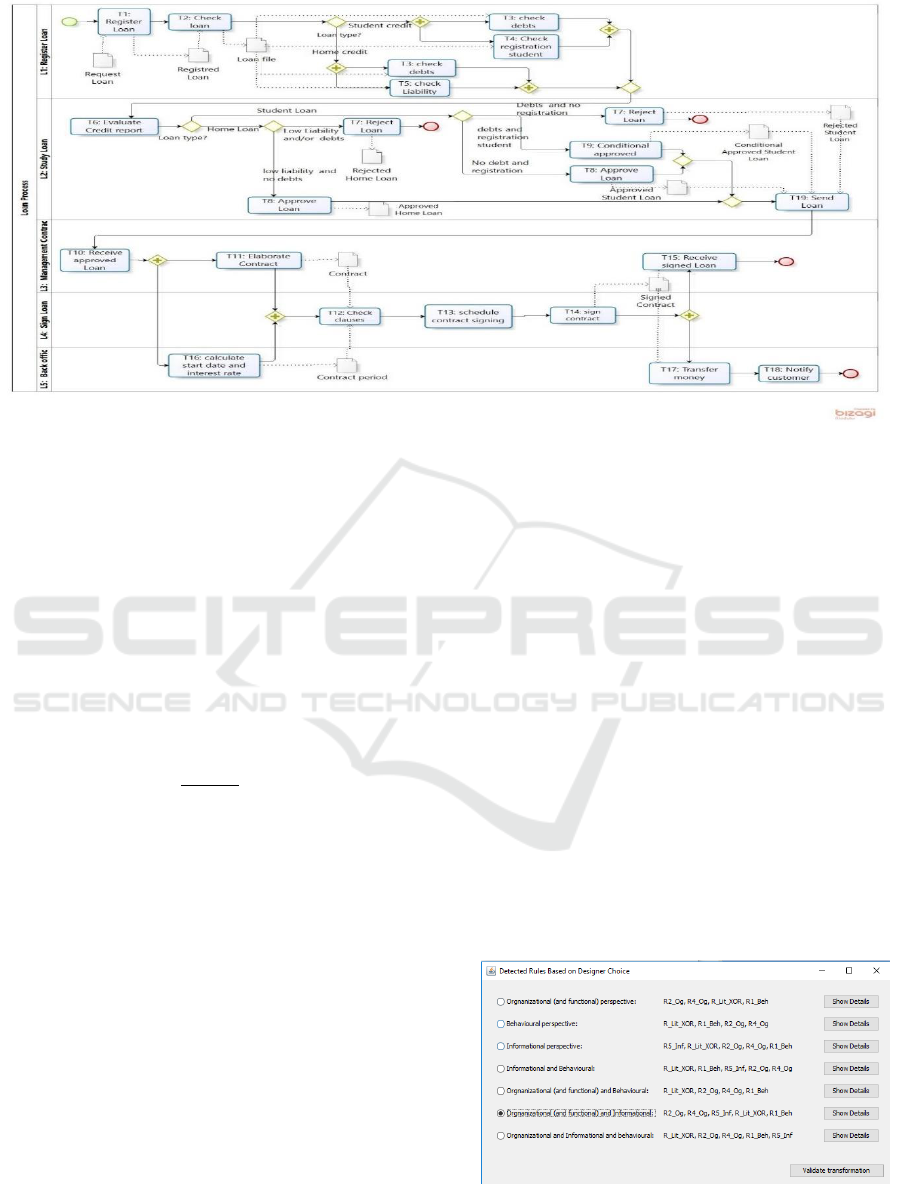
Figure 3: BPMN example: Loan process.
If
1
i
q
then
1
i
q
(9)
If
0
i
q
then
0
i
q
(10)
Let
1
,..
k nk
qq
the membership degrees of metrics that
belong to a sub-characteristic, then we calculate the
average values
k
q
obtained from metrics values that
should be minimized and maximized:
1
n
ik
i
k
q
q
n
(11)
We assess the quality model as follows:
If
1
k
q
then the model is very efficient;
If
0
k
q
then the model is inefficient;
If
0,0,5
k
q
then the model is medium;
If
k
q
> 0,5 and
k
q
<1 then the model is
efficient
To facilitate the application and evaluation of our
method, we have implemented a tool named
EVARES Quality as an Eclipse TM plug-in (Eclipse,
2011). It is composed essentially of two components:
1) The BPMN model restructurer contains the Rule
application order identification and Transformer; and
2) The BPMN quality evaluator contains the
Calculator and the Interpreter. In order to illustrate the
functioning of our tool, we apply it to the “Loan
process” model shown in Figure 3.
4 EVARES QUALITY TOOL
4.1 BPMN Model Restructuring
Once the designer chooses his/her perspective(s) of
interest, the rule application order identification
module displays the set of rules corresponding to all
combinations of the chosen perspectives (Figure 4).
For instance, in the case of organizational and
informational perspectives, the heuristic promotes at
each iteration, the applicable organizational and
informational transformation rules that will be
retained even if they don’t produce the best model
quality. By selecting the "Show details" button in
Figure 4, the rule application order identification
represented by Figure 5 will display the result of the
running example. In this GUI, the designer retains
those rules he/she thinks are convenient. In the
running example, suppose we retain the informational
Figure 4: All possible combinations based on the designer’s
objectives.
ICEIS 2017 - 19th International Conference on Enterprise Information Systems
414
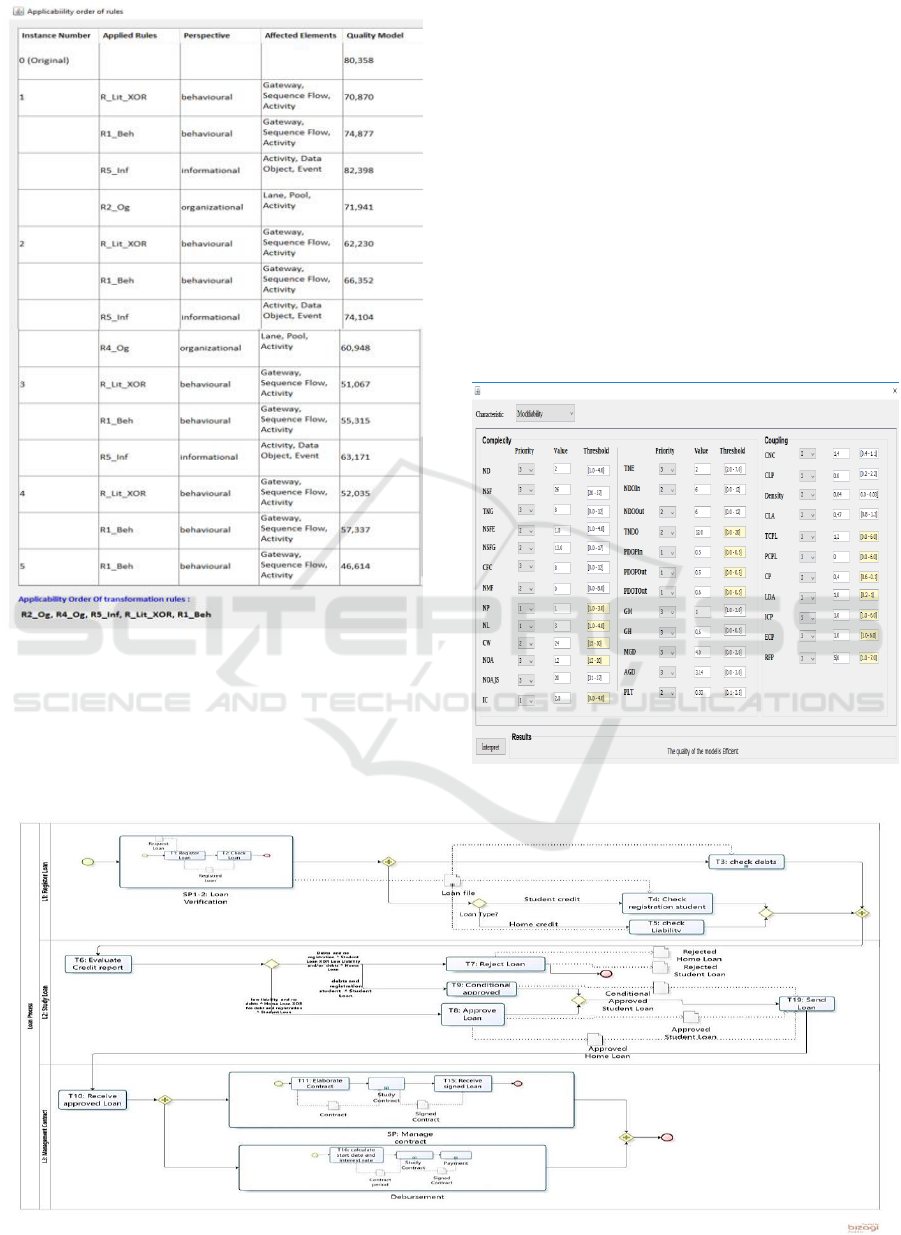
Figure 5: Rules order applied to "Loan Process" for the
informational and organizational perspectives.
rule R5_Inf even though it increases the quality
model. Based on the selected rules, the tool displays
the applicability order of rules that provides the best
quality by favouring the chosen perspective(s). In the
example, the best order is: R2_Og, R4_Og, R5_Inf,
R_Lit_XOR, R1_Beh. Figure 6 presents the model
after transformation.
4.2 BPMN Quality Evaluator
The metrics calculator produces the metrics values
before and after the transformation of the model.
Afterward, the interpreter calculates the ratio
improvement (RI) of metrics, and compares the
obtained results to threshold values of metrics
deduced from empirical studies (Sánchez-González
et al., 2010). Some threshold are introduced by the
user with stars (*). Based on the quality sub-
characteristic, the interpreter gives an evaluation of
the business process under analysis (Figure 7).
Figure 7: Quality model evaluation.
Figure 6: Loan Process after the last transformation.
EVARES: A Quality-driven Refactoring Method for Business Process Models
415

5 RELATED WORKS AND
CONCLUSION
Refactoring/transformation-based approaches to
improve the quality of BPM stand on three pillars:
quality assessment means, refactoring operations, and
their application strategy.
For model quality assessment, our method
EVARES relies on a set of metrics mapped to quality
sub-characteristics (ISO/IEC 25010, 2011). It assess
more quality sub-characteristics than existing
propositions, e.g., (Fernández-Ropero et al., 2013)
cover understandability and modifiability whereas
Rolon et al. (Rolon et al., 2015) evaluate usability and
maintainability. In particular, this paper showed how
EVARES uses metrics to assess understandability,
modifiability and reusability. In addition, EVARES
characterizes the metrics’ tendency for each quality
sub-characteristic.
As for the second pillar, several researchers
proposed refactoring operations (La Rosa et al.,
2011), e.g., R-lit-XOR that replaces two or more
nested gateways of the same type with a single one.
EVARES offers transformations that account for
both the structural and semantic information, which
more open quality improvement opportunities. In
addition, EVARES classifies the proposed
transformations into the perspective(s).
Finally, except for (Fernández-Ropero et al.,
2013), none of the proposed works define an
application order strategy for their transformations.
Indeed, the authors use a statistical approach to
identify the best order of applying three categories of
refactoring operators (i.e., irrelevant, granularity and
completeness). To do so, they first propose six
execution orders of operators. Second, they execute
the six orders and collect the metrics’ values for each
BPM. Finally, they apply a univariant general linear
model test on the collected values to show that one
particular order best improves understandability and
modifiability: reducing the granularity, then
removing irrelevant elements. Nonetheless, in each
category, the transformation order is left undefined.
This statistical approach of identifying the
transformations’ application order is impractical for a
large number of transformations.
We by passed these difficulties by adopting a
heuristic approach that accounts for the metrics’
tendency. More specifically, we presented a heuristic,
greedy algorithm that, iteratively, selects applicable
transformations in order to optimize locally the model
according to both the designer’s perspectives and
quality sub-characteristics.
Evidently, our heuristic approach to the identification
of transformation application order operates through
a local optimization technique whose result depends
tightly on the correlation among the rules. Hence, our
future work focuses on analyzing the correlations
among the transformation rules. In addition, we will
examine restructuring BPM that is based on temporal
constraints.
REFERENCES
Cardoso, J., Mendling, J., Neuman, J., Reijers, H.A., 2006.
A discourse on complexity of process models. In
BPM’06, Intern. Workshop on Business Process
Mamagement. LNCS, Berlin, Springer, pp. 115-126.
Curtis, B. Kellner, M. Over, J., 1992. Process Modeling. In
Communication of the ACM, 35(9).
Dijkman, R., Gfellerb, B., Kusterb, J., Volzerb, H., 2011.
Identifying refactoring opportunities in process model
repositories. In Journal of Information and Software
Technology, 53(9), pp.937-948.
Eclipse Specification. (2013). Available from:
http://www.eclipse.org/.
Fernández-Ropero, M., Pérez Castillo, R., Cruz-Lemus,
J.A., Piattini, M., 2013. Assessing the Best-Order for
Business Process Model Refactoring. In (SAC’13),
proc. of 28th Symposium On Applied Computing.
Coimbra. Portugal, pp. 1400–1406.
ISO/IEC 25010. 2011. Software and system engineering–
Software product Quality Requirements and Evaluation
(SQuaRE)– Guide to SQuaRE. .
ISO/IEC 19510. 2013. Object Management Group BPM
http://www.iso.org/iso/catalogue_detail.htm%3Fcsnu
mber%3D62652.
Khlif, W., Ben-Abdallah, H., Elleuch, B. N, 2017. A
methodology for the semantic and structural
restructuring of BPMN models. BPM’17, Journal of
Business process management, Vol 23 (1), pp.16 – 46.
La Rosa, M., Wohed, P., Mendling, J., ter Hofstede,
A.H.M., Reijers, H. A., Van der Aalst, W.M.P., 2011.
Managing process model complexity via abstract
syntax modifications. In IEEE Transactions on
Industrial Informatics. 7(4), pp. 614–629.
Polyvyanny, A. 2012. Structuring process models.
Dissertation, University of Potsdam, Potsdam,
Germany, January.
Rolón, E., Chavira, G., Orozco, J., Soto, J.P., et al. 2015.
Towards a framework for evaluating usability of
business process models with BPM in health sector.
AHFE’15, 6
th
Conf. on Applied Human Factors and
Ergonomics. Vol 3, pp. 5603-5610.
Sánchez-González, L., García,F.,Mendling,J., Ruiz, F.
2010. Quality Assessment of Business Process Models
Based on Thresholds. In CoopIS’10, 18
th
Conf. on
Cooperative Information Systems, pp. 78-95.
Zadeh, L.A., (1965). Fuzzy sets. In Information and
Control. 8 (3): 338–353.
ICEIS 2017 - 19th International Conference on Enterprise Information Systems
416
