
Predicting the Stability of Large-scale Distributed Stream Processing
Systems on the Cloud
Tri Minh Truong, Aaron Harwood and Richard O. Sinnott
University of Melbourne, Melbourne, Australia
Keywords:
Stability, Resource Estimates, Stream Processing Systems.
Abstract:
Large-scale topology-based stream processing systems are non-trivial to build and deploy. They require un-
derstanding of the performance, cost of deployment and considerations of potential downtime. Our work
considers stability as a primary characteristic of these systems. By stability, we mean that unstable systems
exhibit large-spikes in latency and can drop throughput frequently or unpredictably. Such instabilities can be
due to variations of workloads or underlying hardware platforms that are often difficult to predict. To under-
stand and tackle this for large-scale stream processing systems, we apply queueing theory and simulate the
results through a series of experiments on the Cloud.
1 INTRODUCTION
Stream processing is becoming increasingly impor-
tant to information and business processes. Real-time
information needs arise from almost all sectors. Many
applications are built for competitive advantages such
as financial trading systems or customers services.
Other applications are used to monitor real-time traf-
fic or security attacks e.g preventing real-time fraud.
Major online service providers are looking at trends
so that they can serve suitable items to on-line cus-
tomers as they click through web pages. The chal-
lenge with stream processing is the very high vol-
ume and processing demands of real-time data and
the need for very low latency.
Further distributed systems research is required
to meet the challenges placed upon the new genera-
tion of big data stream processing systems (Hu et al.,
2014; Krempl et al., 2014). We call such systems,
simply, big systems. It is no longer sufficient for such
big systems to process data in batches, as is usually
assumed in high performance computing. Data must
be processed online and in real-time. The real-time
results from such big systems must be available to the
users and the users must be able to interact with the
processing in real-time.
A core challenge of stream processing is to adapt
to dynamic configuration of the underlying infrastruc-
ture in the presence of bursty traffic. The rise of a new
breed of general-purpose frameworks for stream pro-
cessing with simple programming APIs allows users
to create massive distributed systems that hide the
complexity of scaling out and fault-tolerance (Toshni-
wal et al., 2014; Kulkarni et al., 2015; Zaharia et al.,
2010). (Heinze et al., 2014a) points out that this gen-
eration of data streaming systems are driving the de-
sign of cloud-based stream processing.
While there are many research works proposed to
dynamically scale stream processing systems such as
(Heinze et al., 2014c; Gedik et al., 2014; Heinze et al.,
2014b; Lohrmann et al., 2015), they are not straight-
forward to deploy, even to Cloud environments. The
problem lies with resource estimation. Thus, resource
estimates are only discussed as a result of scaling op-
erator parallelism, e.g where acquiring or releasing
resources is needed. Scaling increases or decreases
the waiting time for services. There has not been any
approaches that explicitly solve resource estimation
problems in terms of stability.
Resource estimation is especially difficult due to
different stream processing queries with various data
streams and fluctuating workloads. It is in this aspect
that our research is most concerned. From a queueing
theory perspective, every finite buffering system has a
non-zero probability that the buffer will become full.
As such, resource estimates have a direct connection
to stability prediction. The question is how to gauge
the cost to pay for such stability.
Truong, T., Harwood, A. and Sinnott, R.
Predicting the Stability of Large-scale Distributed Stream Processing Systems on the Cloud.
DOI: 10.5220/0006357606030610
In Proceedings of the 7th International Conference on Cloud Computing and Services Science (CLOSER 2017), pages 575-582
ISBN: 978-989-758-243-1
Copyright © 2017 by SCITEPRESS – Science and Technology Publications, Lda. All rights reserved
575

1.1 Contributions
This paper proposes a strategy to estimate resources
required for stream processing systems by applying
queueing theory to predict the stability of such sys-
tems. The goal is to achieve an appropriate utilised
level for effective use with minimum resources and
at the same time provide processing stability under
heavy workload. The contributions of this paper in-
clude:
• We apply queueing theory to provide a model for
understanding and for predicting stability, and
• A reliable resource estimation technique through
simple performance metrics based on measure-
ment and monitoring which can be adapted to
many topology-based stream processing frame-
works and Cloud environments.
1.2 Related Work
Related work such as (Pietzuch et al., 2006; Cardellini
et al., 2015; Eidenbenz and Locher, 2016; Chatzis-
tergiou and Viglas, 2014) focus on efficient operator
placement which determines, within a set of available
distributed computing nodes, the nodes that should
host and execute each operator. These works pro-
pose adaptivity strategies to optimize the Quality of
Service of stream processing systems at deployment
based on assumptions of knowledge of the resource
requirements. In real world scenarios, such assump-
tions are not realistic and can lead to sub-optimal uti-
lization of available resources.
Many existing works on elasticity propose the use
of metrics such as the congestion index, throughput,
CPU, latency or network usage, etc. (Heinze et al.,
2015) implemented stream processing system elas-
ticity. An optimization algorithm proposed in this
work was used to find the parameter configuration
based on setting of six parameters for the scaling
strategy, which (1) minimized the monetary cost and
(2) ensured a good quality of service. Recent work
(Jamshidi and Casale, 2016) proposed an auto-tuning
algorithm that leveraged Gaussian Processes to find
optimal configurations given a limited budget of ex-
periments.
(Aniello et al., 2013) propose schedulers used to
deploy a topology in tuning Storm (Toshniwal et al.,
2014) performance. This solution focused on adap-
tively placing and migrating tasks at runtime based on
statistics such as where to place tasks that exchange
comparably large amounts of data. Recently, Heron
(Kulkarni et al., 2015) has improved Storm's con-
gestion handling mechanism by using back-pressure
approaches however elasticity is not explicitly ad-
dressed.
The Stela system (Xu et al., 2016) does not change
running topologies because it is considered intrusive
to the applications. When the user requests a scale-
out with a given number of new machines Stela then
decides which operators to give more resources to,
by increasing their parallelism based on an Expected
Throughput Percentage metric. Stela first identifies
these operators that are congested based on their in-
put, processing and output rates. It relies on the Con-
gestionRate parameter to control the sensitivity of the
algorithm.
Recent work (Lohrmann et al., 2015) proposed an
elasticity model that provides latency guarantees by
tuning task-wise parallelism level in a fixed size clus-
ter.
Our work is orthogonal to these works (Xu et al.,
2016; Lohrmann et al., 2015; Jamshidi and Casale,
2016) and achieves these metrics and statistics based
on analysis in terms of stability which can be incor-
porated to improve resource utilization at runtime.
2 BACKGROUND
First generation big system architectures are “batch-
based”, for example Apache Hadoop (Zikopoulos
et al., 2011) and Apache Spark (Zaharia et al., 2010)
and many such research and development projects
that ultimately became Apache Software Foundation
projects. These use map-reduce like processing on
batches of data (Dean and Ghemawat, 2008; Condie
et al., 2010). The concept of a data stream is not
necessarily maintained in such approaches. These
architectures have progressed to include the con-
cept of micro-batching, to better handle data in real-
time. Second generation big system architectures are
“topology-based”, for example Apache Storm (Tosh-
niwal et al., 2014), Apache Samza (Kleppmann and
Kreps, 2015), Aurora (Abadi et al., 2003) and Yahoo!
S4 (Neumeyer et al., 2010). In such approaches, pro-
cessing is decomposed into components and the data
stream concept is maintained between components.
In this research we focus on topology-based archi-
tectures which arguably have the strongest research
focus in stream-based distributed systems today.
2.1 Topology-based Stream Processing
Background
Topology-based stream processing platforms repre-
sent processing components, which we call operators,
as nodes in a directed graph, where the edges repre-
CLOSER 2017 - 7th International Conference on Cloud Computing and Services Science
576
sent the flow of tuples in the stream between operators
(see Figure 1). Apache Storm is arguably the most
widely used topology-based stream processing plat-
form today. Operators that have no incoming edges
are called sources (Spouts in Apache Storm) and they
produce tuples. A source typically receives data from
a big data provider, e.g. Twitter, where each “tweet”
is transformed into a tuple within the system. Oper-
ators with no outgoing edges are called sinks (usu-
ally a database) and they remove tuples from the sys-
tem. Operators with both inputs and outputs generally
transform the incoming tuple stream from one tuple
type to another. Operators may receive multiple input
streams of differing tuple types and produce multiple
output streams of differing tuple types.
Database
Publish/
Subscribe
User
Interface
Twitter
Google
Facebook
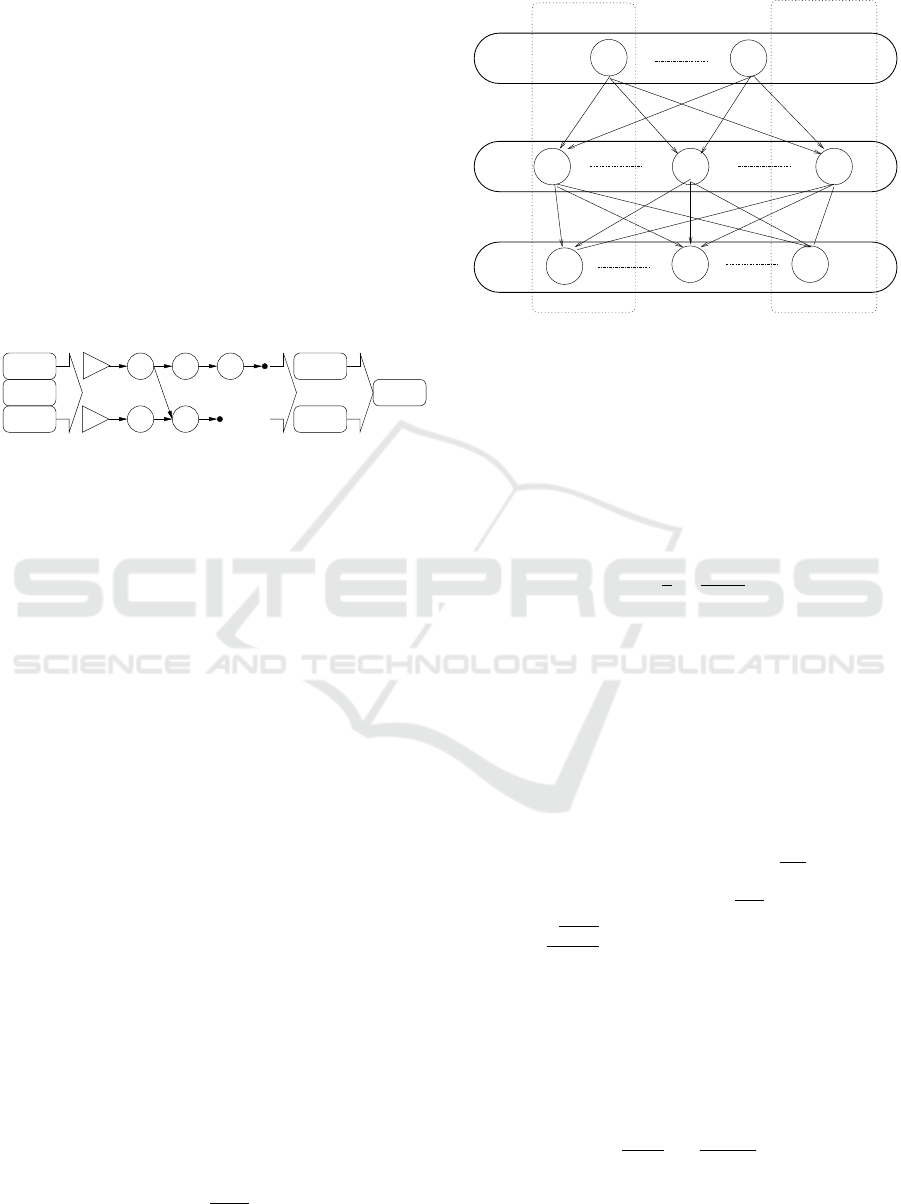
Topology−based stream processing system
Figure 1: Conventional view of the role of a topology based
stream processing system. We use triangles to represent
sources, hollow circles for operators and solid dots as sinks.
The role of a topology-based platform is to allow
programmers to define the operators and the topology
needed and then to transparently map this to some un-
derlying hardware in such a way that programmers
see only that operators receive tuples and emit them.
A good platform will transparently provide a reliable
and efficient sub-communication system, thereby re-
moving such details from the programmer. Further-
more, to be competitive, the platform will provide a
means to scale up, whereby multiple instances of an
operator can be transparently used by the platform to
increase the throughput of stream processing (see Fig-
ure 2).
2.2 Queueing Theory model
We use queueing theory to model our stream pro-
cessing system. In particular, each component of the
topology can be considered as a queueing system.
Some notations are necessary for the discussion. Let
random variable t be the time interval between the ar-
rival times of 2 successive tuples and let u be the pro-
cessing/service time of a tuple, which is assumed to
be independently and identically distributed for all ar-
rival times.
One fundamental measure of queueing system
performance is the traffic intensity a which can be
given as:
a =
E(u)
E(t)
.
Worker 1
Parallelism of operators for maximum througput
Element
Sink
Worker N
Process
Source
Figure 2: Multiple instances of an operator are used to in-
crease the throughput of stream processing. Instances are
shown as circles and instances of the same operator are
grouped together in horizontal box. Arrows represent com-
munications. Note that the source is also considered as
an operator with no incoming communications. Workers
are actual machines. Resource estimates are based on how
many resources should be acquired for the stream process-
ing applications.
For c identical servers, the quantity
ρ =
a
c
=
E(u)
cE(t)
is the server utilization and represents the average
fraction of time that each server is busy (assuming the
traffic is evenly distributed to the servers). Thus, the
traffic intensity a is a measure of the required number
of servers and a measure of congestion (ρ).
In our approach, the number of servers is trans-
lated into the number of instances required to remove
congestion with ρ → 1 and a →c.
Furthermore, we can consider each instance to be
a single-server G/G/1 queueing system. Thus letting:
• λ be the mean arrival rate (i.e λ =
1
E(t)
),
• µ be the service rate (i.e µ =
1
E(u)
), and
• c
x
=
√
Var(x)
E(x)
be the coefficient of variation of x ∈
{
t,u
}
.
Under heavy traffic for a queueing system where
ρ = a = λ/µ and ρ → 1, Kingman’s approximation
(Kingman, 1961) states that the expected (mean or av-
erage) steady state time a tuple spends in the queue is
given as:
W
q
=
ρ
1 −ρ
c
2
t
+ c
2
u
2
E(u) (1)
As a result, we can estimate the latency (waiting
time + processing time) for the average tuple and the
Predicting the Stability of Large-scale Distributed Stream Processing Systems on the Cloud
577

buffer size needed in each instance in order to avoid
back-pressure (congestion).
3 METHODOLOGY
3.1 Stable Resource Estimation
Techniques
The basic principle behind scalable stream process-
ing platforms is the notion of operators that consume
one or more data streams, process received tuples
and continuously output results in the form of data
streams. Taking advantage of topology-based archi-
tectures to address the problem of resource estima-
tion, we propose the following strategy based on this
observation: the topology provides a means to scale
up whereby multiple instances of an operator can be
transparently used by the platform to increase the
throughput of stream processing.
To start estimating, we start with each operator
having 1 instance which is given 1 CPU as the basic
unit for execution. From the Heron design (Kulkarni
et al., 2015), each instance is mapped to an execu-
tor which is run inside a Java Virtual Machine as a
single thread. Thus in order to fully utilize the CPU
resources, more instances can be added starting with
the spout operator. When the point of back-pressure
occurs i.e there are too many spout operator instances
vs. bolt operator instances, we can profile the ex-
pected performance of the given topology.
In case of back-pressure, the operator which
causes the back-pressure will be given more instances
in order to speed up the flow. Another challenge is
when the throughput of stream processing increases.
We argue that as long as the throughput is increasing,
the process of adding instances should continue. The
rate of back-pressure is a percentage of time which
the system spends on dealing with back-pressure. For
example, if every period of 60 seconds, the time spent
on back-pressure is 40 seconds, then on average, the
system rate of back-pressure is approximately 66%.
In practice, the back-pressure rate is proportional to
the data dropping rate. In essence, this process min-
imizes the rate of back-pressure and achieves higher
throughput given a set of resources.
Our approach is similar to (Gedik et al., 2014)
which makes use of 2 locally computed metrics: con-
gestion and throughput. Based on such information, a
control algorithm reactively adapts the parallelism of
local operators to workload changes.
At the same time, increasing parallelism may re-
sult in better throughput but only to a certain point
as the effects of load can exacerbate back-pressure.
However, even if load is under-utilized, back-pressure
can simply arise by chance. This depends on the sta-
bility of the configuration.
It is in this aspect that the balance of performance
and cost needs to be optimised. Through combining
empirical results such as tuple processing time distri-
bution into an analytical framework such as queuing
theory, we are able to measure the expected proba-
bility of back-pressure. As a result, we can provide
guarantees of data delivery/processing and achieve
the desired throughput with minimal back-pressure
rate probability. Furthermore, the analysis of CPU
memory in terms of queue sizes can also be modelled.
Utilising baseline performance, we can give ap-
proximate estimates of the resource requirements
needed to achieve the required throughput for stream
processing systems.
3.2 Predicting Stability
Queueing theory typically deals with system perfor-
mance in a steady-state. That is, most queueing mod-
els assume that the system has been operating with the
same arrival rate, average service time and other char-
acteristics for a sufficiently long period that the prob-
abilistic behaviour of performance measures such as
queue length and customer delay is independent of
when the system is actually observed. Without mea-
surement data, it is not possible to predict stability.
In a stable and fully utilised queueing system
where no significant overheads exist, the queue time
will approximate to the execution time. If the queue
time is more than the execution time, it means the
traffic is low. In such scenarios, we can increase the
throughput until the queue time is around the same as
the execution time.
The execution time gives information in terms
of system load. If more processes are scheduled
under given resource constraints, increased context-
switching overheads will occur especially when the
number of processes exceeds the underlying CPU re-
sources. For queue times which are larger than exe-
cution times, this does not necessarily mean that the
traffic is low, but rather it is an indication of the over-
heads of context switching. In this case, increasing
the throughput might exacerbate the problem.
A stable system requires that the execution time
is less than the inter-arrival time so that the queueing
system is stable. While the data items inter-arrival
rates can be measured directly, it is harder to mea-
sure the maximum processing rate of all component
instances. In the case where the execution time or pro-
cess rate is less than the arrival rate, the system will
CLOSER 2017 - 7th International Conference on Cloud Computing and Services Science
578

Table 1: Performance measurement data at runtime.
Symbol Description
Measured by online normal estimator
u
e
the execute time is the time
from start of processing for
each tuple to the end of the
processing
E(u
e,i
),Var(u
e,i
) the mean and variance of the
execute time at component i
u
q
the queue time is the mea-
surement of time difference
between the start of every
such processing
E(u
q,i
),Var(u
q,i
) the mean and variance of the
queue time at component i
t
e
the data inter-arrival time
E(t
i
),Var(t
i
) the mean and variance of the
data items inter-arrival time
for component i
Derived using the above measurements
λ
i
=
1
E(t
i
)
the mean arrival rate for
component i
µ
q,i
=
1
E(u
q,i
)
the service rate including
queue time for component i
µ
e,i
=
1
E(u
e,i
)
the processing rate for com-
ponent i
a
i
=
λ
i
µ
e,i
the optimal traffic intensity
where queue management
cost is negligible for compo-
nent i
c
x
=
√
Var(x)
E(x)
the coefficient of variation of
x ∈
t
i
,u
q,i
expect to have increased waiting times. The queue
time in this scenario (u
∗
q
) reflects the total time to ex-
ecute each tuple and includes the execution time and
overheads due to queue management.
3.2.1 Queueing theory in action
For a given set of resources, our approach is to in-
crease the inter-arrival rate by increasing the spout
processes when the queue time is greater than the exe-
cution time. As the queue time decreases with respect
to the execution time under the same resource con-
straints, the system throughput will increase and ex-
hibit higher CPU loads. When no reduction in queue
time occurs at each i
th
bolt component, the system is
fully utilised i.e as ρ → 1 and this is u
∗
q,i
.
It is widely known in queueing theory that the
higher the average utilization level, the longer the wait
times. However, it is important to note that this re-
lationship is nonlinear. Unless average utilization is
strictly less than 100%, the system will be unstable
and the queue will continue to grow. Thus, under typ-
ical traffic conditions, we have
E(u
q,i
) = E(u
∗
q,i
) ×e
q,i
where e
q,i
≥ 1 is an excess coefficient.
As given in equation (1), the utilization ρ gives
estimates of the expected waiting time in the queue
for tuples and the average delay approaches infinity as
the utilization approaches one at u
∗
q,i
. The higher the
degree of variability in the system, the worse the de-
lays for the same utilization level. Thus, excess CPUs
have to be provided to maintain stability using e
q,i
as
the excess coefficient.
If all workers are homogeneous, the quantity a
i
gives an indication of the number of required servers
or ρ =
λ
cµ
< 1.
In heterogeneous environments, these goals can be
harder to achieve. Assuming effective load-balancing
among parallel instances, the workload is expected to
spread evenly and thus, E(u
q,i
) will be the minimum
queue time of all instances of the i
th
component.
In heterogeneous environments, the performance
metrics are not necessarily useful because the ma-
chine that runs an instance may happen to have slower
CPU speed than others. Moreover, it is noted that
getting the right measurements is not easy because
they can be machine-dependent. If the configurations
were calculated based on the slowest machine perfor-
mance, the ‘real’ utilization would be a lot lower be-
cause other machines are capable of faster processing.
However, due to the nature of heterogeneity, config-
uration using the fastest CPU will result in instabil-
ity at runtime. As shown in later results, instability
will significantly penalize throughput of stream pro-
cessing. It is also known that queueing systems have
economies of scale, e.g the smaller the system, the
longer the delays will be for a given utilization level.
Our approach is to over schedule the processes over
heterogeneous resources to exploit the randomness in
spreading out data streams over all resources as well
as scaling up the queueing system.
In so doing, we observe both inter-arrival stabil-
ity and queue time stability. Inter-arrival rate stabil-
ity means that the system keeps up with increases in
throughput. Whereas, queue time stability means that
the context-switching overheads due to over schedul-
ing are not significant. The goal is to achieve a queue
time state where the resources are fully utilised for ef-
fective throughput and at the same time support inter-
arrival stability.
Predicting the Stability of Large-scale Distributed Stream Processing Systems on the Cloud
579
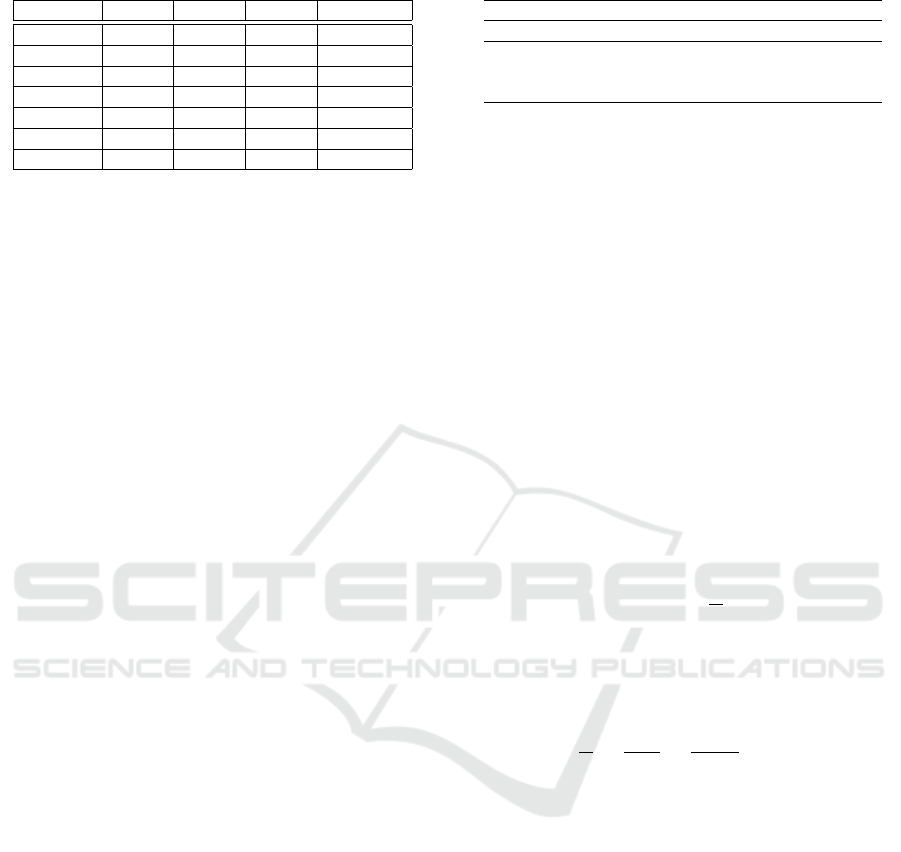
Table 2: Host Types and Capacity.
VCPUs Disk RAM Location
Instance 1 2 70 GB 8 GB Melbourne
Instance 2 2 70 GB 8 GB Melbourne
Instance 3 2 70 GB 8 GB Melbourne
Instance 4 4 70 GB 16 GB Melbourne
Instance 5 4 70 GB 16 GB Melbourne
Instance 6 16 70 GB 64 GB Melbourne
Total 30 280 GB 120 GB Melbourne
4 EXPERIMENTS
4.1 Setup
While there are a number of topology-based plat-
forms, in our work we chose Heron (which extends
Apache Storm) due to its popular streaming APIs that
have been adopted by the research community and
their ability to analyse the performance of individual
operators.
This work was based on a single availability
zone and carried out on the Big Systems Research
Group’s 200 node NeCTAR (NeCTAR, 2016) allo-
cation. NeCTAR has a 10Gb backbone and associ-
ated interconnects, hence delays due to networking
congestion are not a factor. However for larger scale
streams with network buffering issues, then such fac-
tors would have to be considered as part of the queue-
ing system/algorithms.
4.2 Preliminary Results
We use a simple topology called ExclamationTopol-
ogy. This topology comes within the Apache Storm
distribution as a topology for testing purposes. The
topology has one spout type and one bolt type ar-
ranged into 2 levels. The logic of the spout randomly
emits one word from a pre-defined set of words. The
logic of the bolt is to append 3 exclamation marks at
the end of each tuple it receives and emits it to the
next level (if there is one).
In combination with back-pressure information,
each instance provides performance data without
modifying the stream processing platform. Each
spout will periodically be sampled using estimators
to get the time between emits. This is a measurement
of the inter-arrival rate where the tuple is injected into
later bolts. Similarly, at each bolt, we periodically
sample the execution time and queue time. As with
emits in spouts, bolt emits also give measurement of
inter-arrival rates for the tuples which flow to later
bolts.
In Figure 3, we observe that the throughput in-
Table 3: Parameters.
Mean (ns) Standard Deviation
Utilization Low High Stable
Spout emit t
e,1
4000 2000 150000
Bolt 1 exec u
e,1
1200 1500 15000
Bolt 1 queue u
q,1
7000 2500 200000
Bolt 1 emit t
e,2
7000 2500 200000
Bolt 2 exec u
e,2
300 500 1500
Bolt 2 queue u
q,2
8000 3200 250000
creases by adjusting the level of parallelism of differ-
ent components based on measurement metrics and
back-pressure monitoring. The measurement results
in Table 3 are collected by stepping through a num-
ber of configurations. Starting with topology con-
figuration 1-1-1 where each component’s parallelism
is 1 and each component is given 1 CPU. From this
configuration, we obtain the throughput of 7 million
tuples per second (MT/s) consistently and no back-
pressure is detected. We start increasing spout com-
ponent parallelism to 2 and achieve throughput of 7
MT/s as shown for topology 2-1-1 in Figure 3. This
is due to the back-pressure of bolt 1. As shown in
Table 3, the bolt 1 execution time (u
e,1
= 1500) is
lower than the spout emit rate (t
e,1
= 2000) but the to-
tal queue time of bolt 1 (u
∗
q,1
= 2500), which includes
queue management overheads. Thus, in order to have
stability, the utilization (ρ =
λ
cµ
< 1) must be strictly
adhered to. Thus, back-pressure is expected for this
configuration at bolt 1 specifically.
On the other hand, the configuration topology of
1-2-1 in which bolt 1 has a parallelism of 2 shows that
the throughput is significantly increased since the uti-
lization ρ =
λ
cµ
=
u
∗
q,1
t
e
1
×2
=
2500
2000×2
< 1. Furthermore,
the configuration of 2-2-1 does not gain the same
throughput as compared to 1-2-1. In this configura-
tion, the back-pressure is detected at bolt 2 and it is
predictable because the bolt 2 queue time u
∗
q,2
= 3200
whereas the inter-arrival rate for bolt 2 is t
e,2
= 2500
under high utilization. As soon as we increase paral-
lelism at bolt 2 to configuration 2-2-2, the throughput
is increased again as shown.
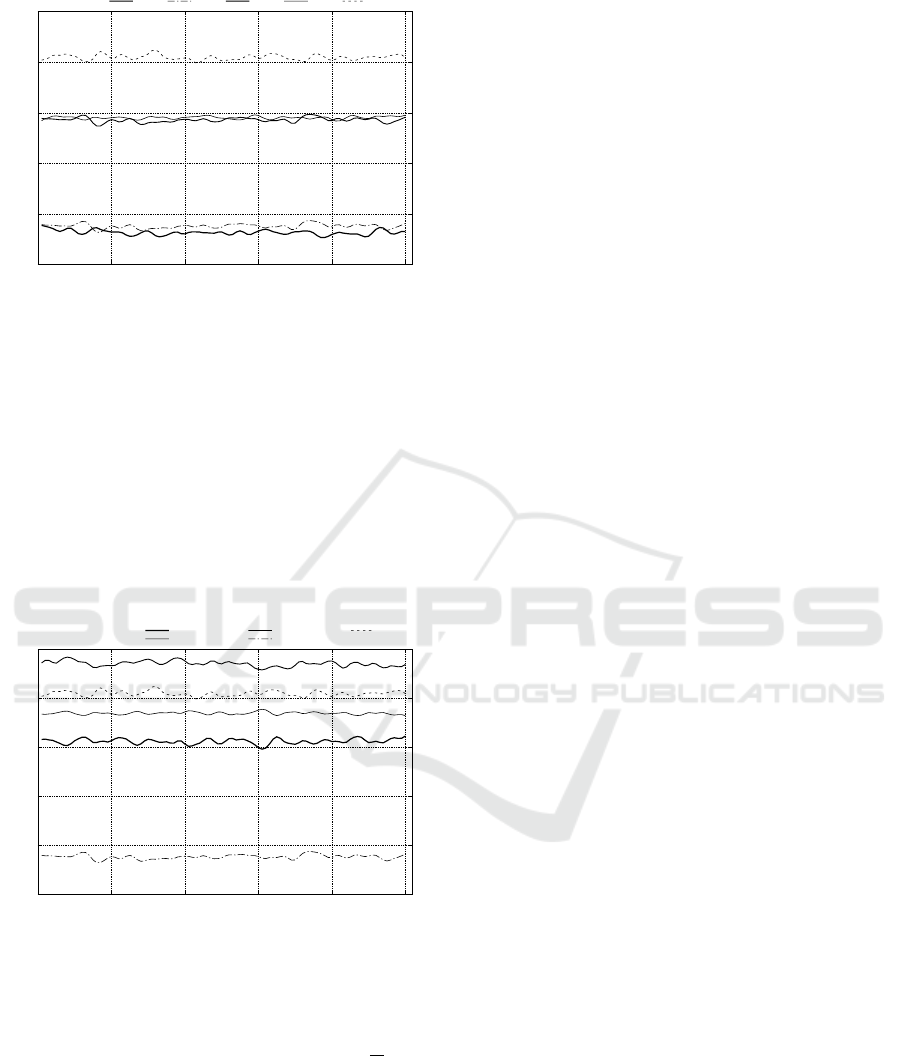
Figure 4 illustrates that over-scheduling does not
significantly increase throughput when the CPU re-
sources are under high load. When we increase the
parallelism of each component, the throughput can
only be as high as a stable configuration given the
same resources. More importantly, it is noted that sta-
bility is very significant for throughput. Even over-
scheduling does not penalize the throughput as much
as unstable configuration provision. As shown in Fig-
ure 4, topology 3-2-2 can only achieve a throughput
of 30 MT/s whereas topology 3-3-2 has a through-
put above 36 MT/s and topology 2-2-2 has throughput
CLOSER 2017 - 7th International Conference on Cloud Computing and Services Science
580
0
10
20
30
40
50
0 20 40 60 80 100
Throughput (M/s)
Run Time (m)
1-1-1
2-1-1 1-2-1 2-2-1 2-2-2
Figure 3: The throughput increases by adjusting the level of
parallelism of different components based on measurement
metrics and back-pressure monitoring. Each topology con-
figuration is referred to by the number of instances at spout
and bolts iteratively, e.g, 1-2-1 indicates topology configu-
ration of 1 spout instance, 2 instances for bolt level 1 and 1
instance of bolt level 2.
well above this level. Increasing resources for unsta-
ble configurations such as 3-3-2 only gains marginal
throughput benefits. Specifically, it is shown in Figure
4 that when we use 4 CPUs and 6 CPUs to run topol-
ogy 2-2-2 and 3-3-2 respectively, the throughputs are
42 MT/s and 48 MT/s.
0
10
20
30
40
50
0 20 40 60 80 100
Throughput (M/s)
Run Time (m)
3-2-2
3-3-2
3-3-2 (6 cpus)
2-1-1
2-2-2
Figure 4: Throughput increase with performance metrics.
After obtaining the measurement data in Table 3,
we want to scale this topology to make use of more
CPUs and different machine types as shown in Ta-
ble 2. Following the previous equation ρ =
λ
cµ
< 1,
we identify configuration 5-7-10 as a stable configura-
tion. The results have several important implications.
First, we use 19 CPUs to run 22 processes which il-
lustrates that we have over-scheduled processes over
available resources to achieve higher utilization. Sec-
ond, we monitor for back-pressure to show that the
configuration is in fact stable even for heterogeneous
environments. Third, to ensure that we have confi-
dence in the measurements, we run the topology three
times. The first two times have a higher throughput
of 70 MT/s and no back-pressure, whilst for the third
run, the throughput drastically reduces to 35 MT/s due
to back-pressure.
5 CONCLUSIONS
Back-pressure rates are essential to identify stream
processing systems that are under-performing. This
has significant implications on cost-efficiency to
users. Furthermore, once back-pressure happens, the
latency of stream processing is dominated by the time
for buffers to clear up. As such, preventing bottle-
necks in such environments is mandatory for system
performance. With our approach, stable configura-
tions provide effective throughput while minimizing
resource consumption. This offers an opportunity to
address the issues of resource provisioning and par-
allelization in performance-oriented contexts. This is
especially important to public pay-as-you-go Cloud
environments.
6 FUTURE WORK
There are several extensions to this work including
cost efficiency and application and infrastructure dy-
namism. With regard to cost efficiency, it is important
to users that the monetary cost of using Cloud-based
infrastructure is balanced with the actual system per-
formance. This includes many aspects of stream pro-
cessing applications. In future work, we shall con-
sider cost models that take into account service level
agreements and include more comprehensive models
for optimising throughput and cost. This includes the
richness of Cloud costing approaches, e.g spot prices
and VM reservation etc.
Any stream processing system expects to have
varying workloads throughout long running execu-
tions. In a normal situation, the workload may be in
some range which can be estimated based on previ-
ous experience. Changes in workload can arbitrarily
happen however and may be a result of either a tem-
porary outage or permanent increase/decrease in per-
formance. For temporary outages and especially in
short periods of time, this should not result in any sig-
nificant changes of resources other than memory for
buffering imbalances. For other cases, it may be de-
sirable that a more general approach supporting ser-
vice level agreements (SLAs) is proposed in order to
guarantee that the required QoS is actually achieved
(Lohrmann et al., 2015; Heinze et al., 2014b; Xu
Predicting the Stability of Large-scale Distributed Stream Processing Systems on the Cloud
581

et al., 2016).
REFERENCES
Abadi, D. J., Carney, D., C¸ etintemel, U., Cherniack, M.,
Convey, C., Lee, S., Stonebraker, M., Tatbul, N., and
Zdonik, S. (2003). Aurora: a new model and ar-
chitecture for data stream management. The VLDB
JournalThe International Journal on Very Large Data
Bases, 12(2):120–139.
Aniello, L., Baldoni, R., and Querzoni, L. (2013). Adaptive
online scheduling in storm. In Proceedings of the 7th
ACM international conference on Distributed event-
based systems, pages 207–218. ACM.
Cardellini, V., Grassi, V., Lo Presti, F., and Nardelli, M.
(2015). Distributed qos-aware scheduling in storm. In
Proceedings of the 9th ACM International Conference
on Distributed Event-Based Systems, pages 344–347.
ACM.
Chatzistergiou, A. and Viglas, S. D. (2014). Fast heuristics
for near-optimal task allocation in data stream pro-
cessing over clusters. In Proceedings of the 23rd ACM
International Conference on Conference on Informa-
tion and Knowledge Management, pages 1579–1588.
ACM.
Condie, T., Conway, N., Alvaro, P., Hellerstein, J. M.,
Elmeleegy, K., and Sears, R. (2010). Mapreduce on-
line. In Nsdi, volume 10, page 20.
Dean, J. and Ghemawat, S. (2008). Mapreduce: simplified
data processing on large clusters. Communications of
the ACM, 51(1):107–113.
Eidenbenz, R. and Locher, T. (2016). Task allocation
for distributed stream processing. arXiv preprint
arXiv:1601.06060.
Gedik, B., Schneider, S., Hirzel, M., and Wu, K.-L. (2014).
Elastic scaling for data stream processing. IEEE
Transactions on Parallel and Distributed Systems,
25(6):1447–1463.
Heinze, T., Aniello, L., Querzoni, L., and Jerzak, Z.
(2014a). Cloud-based data stream processing. In
Proceedings of the 8th ACM International Conference
on Distributed Event-Based Systems, pages 238–245.
ACM.
Heinze, T., Jerzak, Z., Hackenbroich, G., and Fetzer, C.
(2014b). Latency-aware elastic scaling for distributed
data stream processing systems. In Proceedings of
the 8th ACM International Conference on Distributed
Event-Based Systems, pages 13–22. ACM.
Heinze, T., Pappalardo, V., Jerzak, Z., and Fetzer, C.
(2014c). Auto-scaling techniques for elastic data
stream processing. In Data Engineering Workshops
(ICDEW), 2014 IEEE 30th International Conference
on, pages 296–302. IEEE.
Heinze, T., Roediger, L., Meister, A., Ji, Y., Jerzak, Z., and
Fetzer, C. (2015). Online parameter optimization for
elastic data stream processing. In Proceedings of the
Sixth ACM Symposium on Cloud Computing, pages
276–287. ACM.
Hu, H., Wen, Y., Chua, T.-S., and Li, X. (2014). Toward
scalable systems for big data analytics: A technology
tutorial. IEEE Access, 2:652–687.
Jamshidi, P. and Casale, G. (2016). An uncertainty-aware
approach to optimal configuration of stream process-
ing systems. In Modeling, Analysis and Simulation
of Computer and Telecommunication Systems (MAS-
COTS), 2016 IEEE 24th International Symposium on,
pages 39–48. IEEE.
Kingman, J. (1961). The single server queue in heavy traf-
fic. In Mathematical Proceedings of the Cambridge
Philosophical Society, volume 57, pages 902–904.
Cambridge Univ Press.
Kleppmann, M. and Kreps, J. (2015). Kafka, samza and
the unix philosophy of distributed data. IEEE Data
Engineering Bulletin.
Krempl, G.,
ˇ
Zliobaite, I., Brzezi
´
nski, D., H
¨
ullermeier, E.,
Last, M., Lemaire, V., Noack, T., Shaker, A., Sievi,
S., Spiliopoulou, M., et al. (2014). Open challenges
for data stream mining research. ACM SIGKDD ex-
plorations newsletter, 16(1):1–10.
Kulkarni, S., Bhagat, N., Fu, M., Kedigehalli, V., Kellogg,
C., Mittal, S., Patel, J. M., Ramasamy, K., and Taneja,
S. (2015). Twitter heron: Stream processing at scale.
In Proceedings of the 2015 ACM SIGMOD Interna-
tional Conference on Management of Data, pages
239–250. ACM.
Lohrmann, B., Janacik, P., and Kao, O. (2015). Elas-
tic stream processing with latency guarantees. In
Distributed Computing Systems (ICDCS), 2015 IEEE
35th International Conference on, pages 399–410.
IEEE.
NeCTAR (2016). The National e-Research Collaboration
Tools and Resources project. https://nectar.org.
au/.
Neumeyer, L., Robbins, B., Nair, A., and Kesari, A. (2010).
S4: Distributed stream computing platform. In 2010
IEEE International Conference on Data Mining Work-
shops, pages 170–177. IEEE.
Pietzuch, P., Ledlie, J., Shneidman, J., Roussopoulos, M.,
Welsh, M., and Seltzer, M. (2006). Network-aware
operator placement for stream-processing systems. In
22nd International Conference on Data Engineering
(ICDE’06), pages 49–49. IEEE.
Toshniwal, A., Taneja, S., Shukla, A., Ramasamy, K., Pa-
tel, J. M., Kulkarni, S., Jackson, J., Gade, K., Fu, M.,
Donham, J., et al. (2014). Storm@ twitter. In Proceed-
ings of the 2014 ACM SIGMOD international confer-
ence on Management of data, pages 147–156. ACM.
Xu, L., Peng, B., and Gupta, I. (2016). Stela: Enabling
stream processing systems to scale-in and scale-out
on-demand. In IEEE International Conference on
Cloud Engineering (IC2E).
Zaharia, M., Chowdhury, M., Franklin, M. J., Shenker, S.,
and Stoica, I. (2010). Spark: cluster computing with
working sets. HotCloud, 10:10–10.
Zikopoulos, P., Eaton, C., et al. (2011). Understanding
big data: Analytics for enterprise class hadoop and
streaming data. McGraw-Hill Osborne Media.
CLOSER 2017 - 7th International Conference on Cloud Computing and Services Science
582
