
An Example of Multitemporal Photogrammetric Documentation and
Spatial Analysis in Process Revitalisation and Urban Planning
Agnieszka Turek
1
, Adam Salach
2
, Jakub Markiewicz
2
, Alina Maciejewska
1
and Dorota Zawieska
2
1
Department of Spatial Planning and Environmental Sciences, Faculty of Geodesy and Cartography,
Warsaw University of Technology, Pl. Politechniki 1, Warsaw, Poland
2
Department of Photogrametry, Remote Sensing and Spatial Information Systems, Faculty of Geodesy and Cartography,
Warsaw University of Technology, Pl. Politechniki 1, Warsaw, Poland
Keywords: Revitalisation, Urban Planning, Multitemporal Spatial Analysis, GIS, Multisource Data, Photogrammetry.
Abstract: Urban space is undergoing permanent and dynamic transformations resulting from economic and social
changes, technological development and migrations of people from rural areas to cities. It strongly affects the
evolution of the landscape and city structures. Current photogrammetric techniques allow for the acquisition
of data for large areas within a relatively short time, and thus, allow for fast updating and verification of
existing data files. The authors of this paper have focused their research on the possibility to use multi-variant
spatial analysis in the process of revitalisation of degraded areas in cities. The industrial district of Warsaw
was selected for this study, where problems concerning the development of formally industrial areas located
in the attractive part of the city (close to the city centre) are extremely visible. As a result of urban
development, degraded areas are included within administrative boundaries of the city and have created urban
wastelands.
1 INTRODUCTION
Spatial planning and processes of revitalisation are
not sufficiently supported by geo-information
technologies and therefore are still time consuming
processes. The basic advantage in the use of
photogrammetric data in combination with their
processing in GIS systems for the needs of spatial
planning is the possibility to easily present spatial
phenomena and to visualise changes and trends which
take place within a given area. Graphical presentation
of the existing conditions, as well as proposed
transformation, simplifies and supports the decisions
made for those purposes (Ogryzek and Rząsa, 2017).
Recently, interest in the revitalisation of degraded
areas has grown. It is foreseen that this trend will
continue due to the development of legal means
which simplify such activities. The act of October 9,
2015 on revitalisation was enacted and its provisions
are the implementation of one of the basic
components of the Polish National Revitalisation
Plan, which is currently being developed. The
introduction of general frames of formal
implementation of revitalisation processes include
many changes which aim at the creation of the system
of incentives for revitalisation. This document
stresses the mutual relations of the effects of
revitalisation and changes in the system of local
spatial planning, which lead to limitations of
uncontrolled suburbanisation and direction of
investments to degraded areas in cities.
According to Art. 2.1. of the act of October 9,
2015, revitalisation "is the process which leads
degraded areas out from crisis conditions; this
process is performed in a complex way, through
integrated actions for the benefits of the local society,
space and economy, and is territorially focused and
performed by stakeholders of revitalisation, based on
the municipal programme of revitalisation” (Dz. U.
of 2017, item 1023, 1529, 1566).
On the one hand, the needs for the use of attractive
locations of degraded areas and, on the other hand,
the lack of the methodology of the revitalisation
process considering specific features of those areas,
generate the demands for development of
revitalisation procedures, integrated with the needs of
the local society, specified in strategies of
development of territorial units.
The objective of the experiments carried out in
this study was to generate multitemporal photo-
Turek, A., Salach, A., Markiewicz, J., Maciejewska, A. and Zawieska, D.
An Example of Multitemporal Photogrammetric Documentation and Spatial Analysis in Process Revitalisation and Urban Planning.
DOI: 10.5220/0006701902230230
In Proceedings of the 4th International Conference on Geographical Information Systems Theory, Applications and Management (GISTAM 2018), pages 223-230
ISBN: 978-989-758-294-3
Copyright
c
2019 by SCITEPRESS – Science and Technology Publications, Lda. All rights reserved
223

grammetric products to develop the methodology of
visualisation and the use of spatial analysis for the
spatial planning and revitalisation of the selected
degraded areas. Unfortunately, in the case of archival
photographs, several problems with processing this
kind of data exist. From the photogrammetric
perspective, archival datasets are hardly ever
provided together with information that is needed to
perform a standard approach to scanned, analogue
photograph processing using professional
photogrammetric software (such as camera
specification and approximate values of exterior
orientation parameters) (Gonçalves, 2016).
2 THE POSSIBILITES OF THE
USE OF PHOTOGRAMMETRIC
PRODUCTS IN SPATIAL
PLANNING
Nowadays, actual image processing algorithms allow
us to regenerate photogrammetric documentation to
create new opportunities to carry out historical urban
analysis. It might be noticed that they store unique
information about the past that often is useful for
many disciplines such as topographic mapping,
geology, geography, architecture, archelogy, etc.
(Nocerino et al., 2012; CMAP, 2017). Based on
archival photographs, it is possible to generate 3D
models characterized by different levels of detail
(Nocerino et al., 2012), orthoimages (Redecker,
2008) and digital terrain models (Redecker, 2008;
Zawieska et al., 2017). Modern photogrammetric
algorithms, which depend on the image-based
approach together with the photo interpretation and
3D reconstruction techniques, allow not only the
generation of 3D documentation, but also information
about the period in question to be added. A spatio-
temporal or 4D modelling approach allows
researchers to identify, describe, and subsequently
analyse changes in individual scenes and buildings as
well as across landscapes. Such data about change
through time assist researchers as they work to
reconstruct changes in buildings and try to understand
landscape transformations (Nocerino et al., 2012).
Multi-temporal image analysis is used for many
different purposes such as the investigation of land
cover dynamics (Ratcliffe and Henebry, 2004),
detection of change in historic city centres (Patias et
al., 2011), creation of 4D interactive presentations of
heritage sites (El -Hakim et al., 2008), modelling of
architectural changes (Stefani et al., 2011), 4D city
modelling (Schindler, 2010) and urban analysis
(Vizzari, 2011).
Nowadays, the photogrammetric approach for
historical image processing is based on the structure-
from-motion (SfM) and multiview-stereo (MVS)
approach, which is a combination of
photogrammetric and computer vision methods. It is
a fully automated 3D reconstruction technique, which
refers to the simultaneous estimation of camera
orientation, self-calibration and dense point cloud
generation (Moussa, 2014; Zawieska et al., 2017).
However, (in many cases) the processing of historical
images is generally done with semi-manual
procedures, such as finding corresponding tie points,
measuring ground control points, image bundle
adjustment and segmentation/classification steps
(Nocerino et al., 2012). During the analysis of
historical aerial photos, there can be several sources
of error (Redecker, 2008; Nocerino et al., 2012):
a) inaccuracy or total lack of meta -information
about inner orientation (focal length and
coordinates of fiducial marks) and additional
(i.e., distortion) parameters;
b) missing specifications about the flight
mission (especially flying height);
c) poor radiometric image quality (e.g. haze,
image darkness, non-uniform luminosity,
etc.);
d) distortions caused by roll and pitch due to
sudden movements of the plane;
e) improper transport or storage procedures of
the film (e.g. humidity, temperature, etc.)
and
f) inaccurate processing of original films or
hardcopies in field laboratories.
2.1 Location of Experiments
Analyses were performed for a selected part of the
Wola district in Warsaw, which covers an area of
1292 ha. This area is characterised by its location
close the City Centre (Śródmieście) district. It is an
attractive area in relation to location and investment
opportunities; however, due to the high level of
degradation and the presence of neglected post-
industrial and railway areas, it remains incompletely
arranged. This area also requires the presence of
activities which would contribute to its revitalisation.
2.1.1 The Coverage of Local Spatial
Development Plans
The study of the conditions and directions of the
spatial management and local plans of spatial
GISTAM 2018 - 4th International Conference on Geographical Information Systems Theory, Applications and Management
224
development are the most important planning
documents in Poland at the local level of planning.
The local plan of spatial development is the local law
right and consists of provisions concerning the area
destination and distribution of public investments and
specifies the ways and conditions of development. In
the Wola district, 15 local development plans exist
covering the total area of approximately 1,162 hecta-
res, and local plans covering the total area of approxi-
mately 156 hectares are under development. An area of
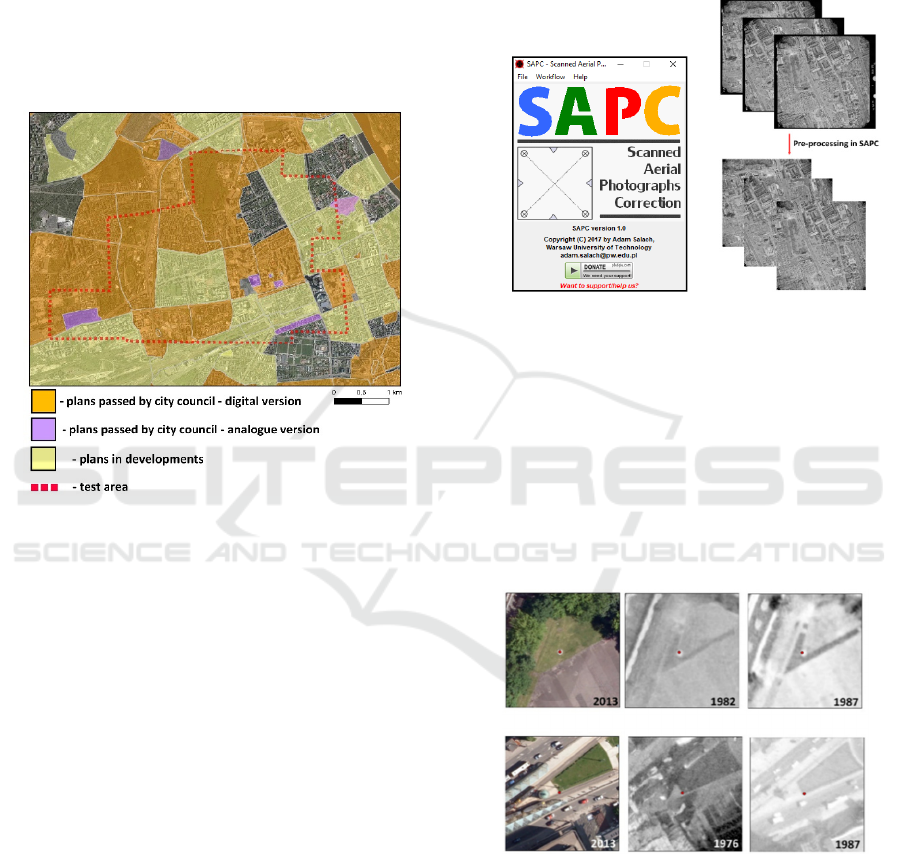
126 hectares is not covered by the local plans (Fig. 1).
Figure 1: A map presenting the coverage of existing spatial
management plans in the Wola district.
2.2 Materials and Methods of Research
Multi-source, multitemporal data were used in this
study (between 1976 and 2013). The following
datasets were used for experiments:
a) archival data:
- 8 photographs from 1976, scale 1:18500;
- 10 photographs from 1982, scale 1:20000;
- 7 photographs from 1987, scale 1:20000;
- 6 photographs from 1990 scale 1:20000.
b) current data:
- orthophotomap RGB from 2013, GSD 10 cm;
- classified point cloud from aerial laser scanning
(2013).
Salach (2017) suggests an alternative method to
processing archival photographs. In this method, in
the first step, scanned photographs are pre-processed
using the open source SAPC application (Fig. 2a).
Pre-processing consists of transforming scanned
archival photographs to a form with specificity
similar to digital images, i.e. the same principal point
position in each photograph and the same resolution
achieved through cutting out the black photographic
frame (Fig. 2b). Next, aerial triangulation of pre-
processed photographs is performed using Structure
from Motion software. This approach may be very
useful and effective, essentially in cases with a lack
of required information about the camera and exterior
orientation parameters.
a) b)
Figure 2: a) Main window of SAPC application; b)
Example of pre-processing of archival photographs in the
SAPC application.
Using the above methodology, archival photographs
of the test area were pre-processed using the SAPC
application. Aerial triangulation was then performed
using Agisoft PhotoScan software. Ground control
points used to orientate archival photographs were
acquired from current orthophotomaps (Fig. 3). Z-
coordinates were assigned to those points basing on
the LiDAR point cloud.
Figure 3: Example of GCPs used to align archival
photographs.
In the next step, archival orthophotomaps/true-
orthophotomaps and point clouds from dense image
matching were generated and processed into digital
surface models (DSM). The figure below presents a
fragment of the test site on the archival point cloud
(1990) (Fig. 4a) and on the LiDAR point cloud (Fig.
4b):
An Example of Multitemporal Photogrammetric Documentation and Spatial Analysis in Process Revitalisation and Urban Planning
225
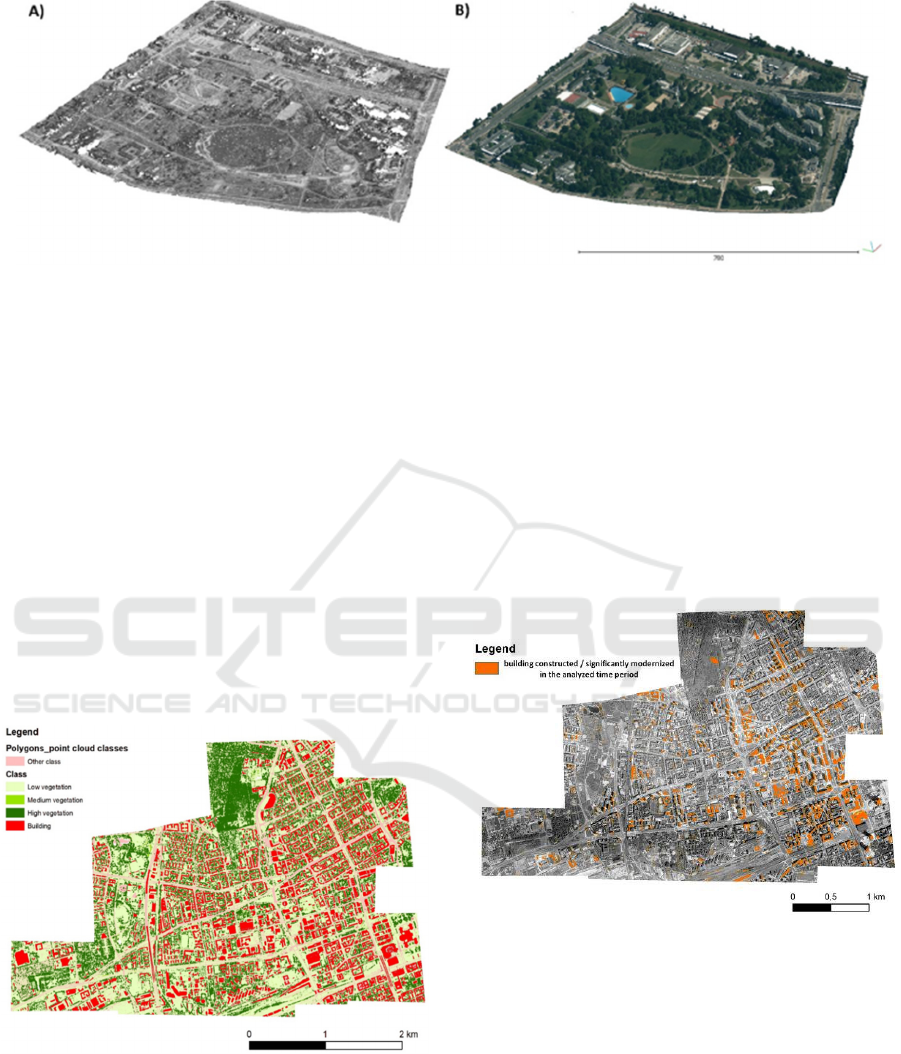
Figure 4: a) The test site on the archival point cloud (1990); b) The test site on the LiDAR point cloud.
Additionally, the DTM and DSM were generated
based on the point cloud from laser scanning.
2.3 Performed Analyses
2.3.1 Analysis of Terrain Surface Changes –
Buildings, Development and
Vegetation Cover
Using the classified LiDAR point cloud it is possible
to determine the percentage of green areas (as for
2013) divided into low, medium and high vegetation,
as well as buildings located within the test site. In the
first step, the LiDAR cloud was processed to the
raster which represented the dominating class in the
GRID of 1m resolution. Then raster was then
processed into a polygon layer (Fig. 5).
Figure 5: The test site divided into land cover classes.
After summing up the areas of polygons assigned
to particular classes, it was simple to calculate the
percentage of analysed classes in the test site: low
vegetation – 42.54 %, medium vegetation –1.30 %,
high vegetation –23.97 %, buildings –19.85 %. This
data allows us to evaluate the intensity of building
development, as well as to determine the percentage
of biologically active sites. The data indicated an
increase in development over the analysed period can
be observed.
The analysis of multitemporal data allows us to
investigate land cover changes. This influences the
determination of the current trends of development of
the analysed area and, as a result, allows us to plan
changes and eliminate negative trends. For this
purpose, the differential DSM was generated by
subtracting the archival DSM
archival
from the current
DSM
LiDAR
(2013).
Figure 6: Raster showing constructed and highly
modernised buildings within the test site in the period 1976-
2013. The orthophotomap of 1982 is shown in the
background.
After reclassification of the resulting differential
DSM, it was possible to locate buildings which have
been recently constructed within the test site (Fig. 6).
Furthermore, using the differential DSM, it is
possible to perform detailed analysis of changes in the
development of an area. The example below (Fig. 7)
shows a fragment of the test site in which several
skyscrapers (with heights of 200 m) were constructed.
GISTAM 2018 - 4th International Conference on Geographical Information Systems Theory, Applications and Management
226
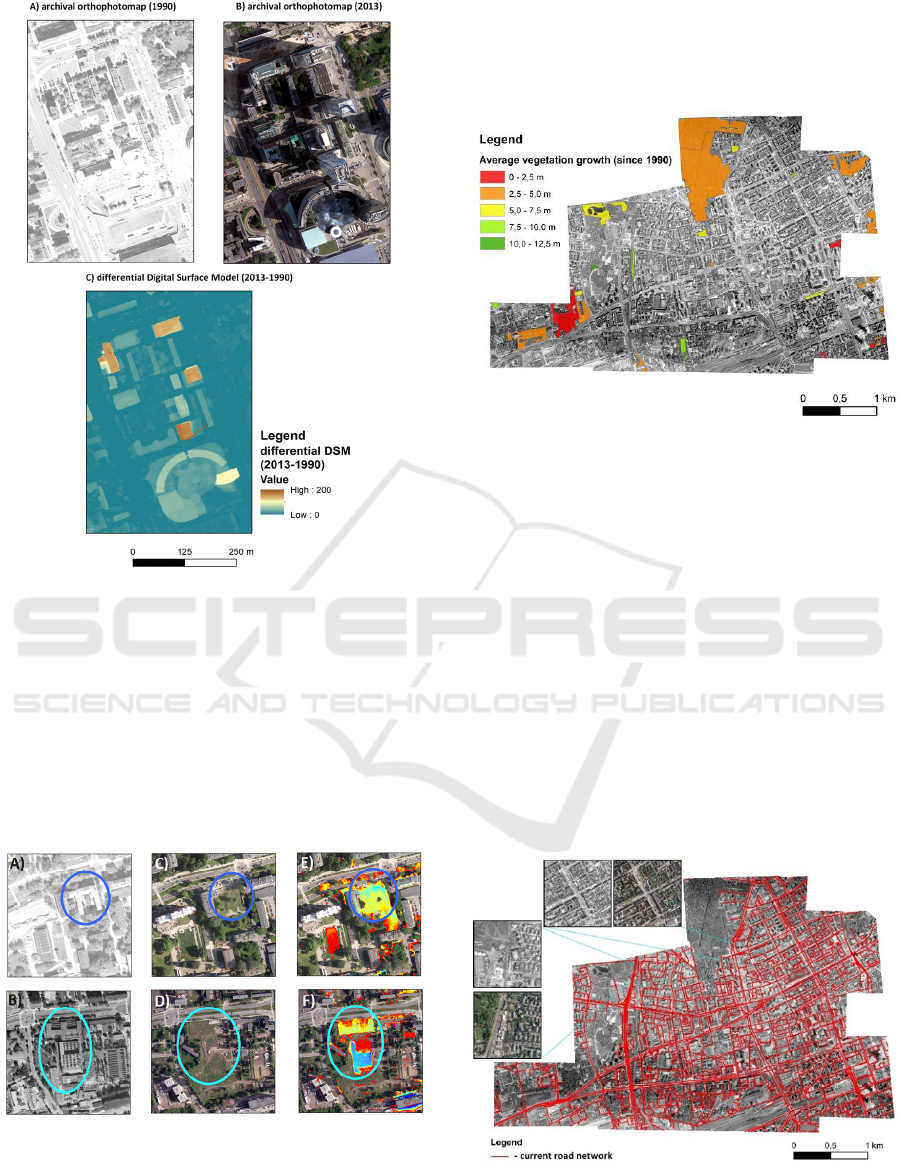
Figure 7: Fragment of the test site in which several
skyscrapers were constructed.
It could be observed that within the period of 37
years, the percentage of industrial areas decreased
and the percentage of housing areas or degraded (not
arranged) areas increased. The differential DSMs
allow us to perform specialised analyses of the city
development structure and to define possible areas
where chemical pollutions of subsoils may occur
(Fig. 8).
Figure 8: An example of changes in post-industrial areas
towards housing development - a), b) example of an
archival orthophotomap with an industrial site, c), d)
current orthophotomap showing where industrial sites
existed in the past, and e), f) differential DSM overlapping
the current orthophotomap.
In order to analyse the vegetation growth, differential
DSMs since 1990 were used (Fig. 9). The polygons
below contain forest areas from the National
Database of Topographic Objects BDOT10k).
Figure 9: Visualisation of average vegetation growth (since
1990).
The analyses indicate the growth of vegetation,
especially in the north and south-west side of the
analysed area. New plantings can also be observed.
Such analyses can assist planners in determining the
area’s biologically active surface.
2.3.2 Analysis of Changes of the Road
Network
As a result of the performed analyses of the road
network changes, the changes in the types of
roadways, road beds and geometry were noticed
within the analysed period. The location of the second
subway line influenced the improvements of the
transportation accessibility of the analysed area.
Figure 10: Roads from the land and buildings register on
the background of an archival orthophotomap.
An Example of Multitemporal Photogrammetric Documentation and Spatial Analysis in Process Revitalisation and Urban Planning
227
The road network has not been dramatically changed.
New roads were constructed only at the edges of the
area, with the majority of the remaining changes
concerning the development of traffic lanes and chan-
ges to pavements. Closer to the city centre, the road
network has not been changed, as illustrated in Fig. 9.
2.3.3 Analysis of the Possibility to Locate
New Buildings - Visibility Analysis
In the case of areas located close to the city centre, it
is particularly important to perform visibility
analysis. This type of analysis can identify the
locations of new buildings in such a way that new
objects are sufficiently illuminated and not obscured
by other buildings. According to the ordnance of the
Minister of Infrastructure of April 12, 2002 regarding
technical conditions which should be met by
buildings and their locations, “the distance between a
building with rooms dedicated for the permanent stay
of people and another object should allow for natural
illumination of those rooms” (Art.13.1.). This
condition is met if between the arms of the angle of
60 degrees, any obscuring part of the same building
or another obscuring object is located within a
distance not shorter than the height of obscuring - for
obscuring objects of a height up to 35 m and 35 m for
obscuring objects higher than 35 m.
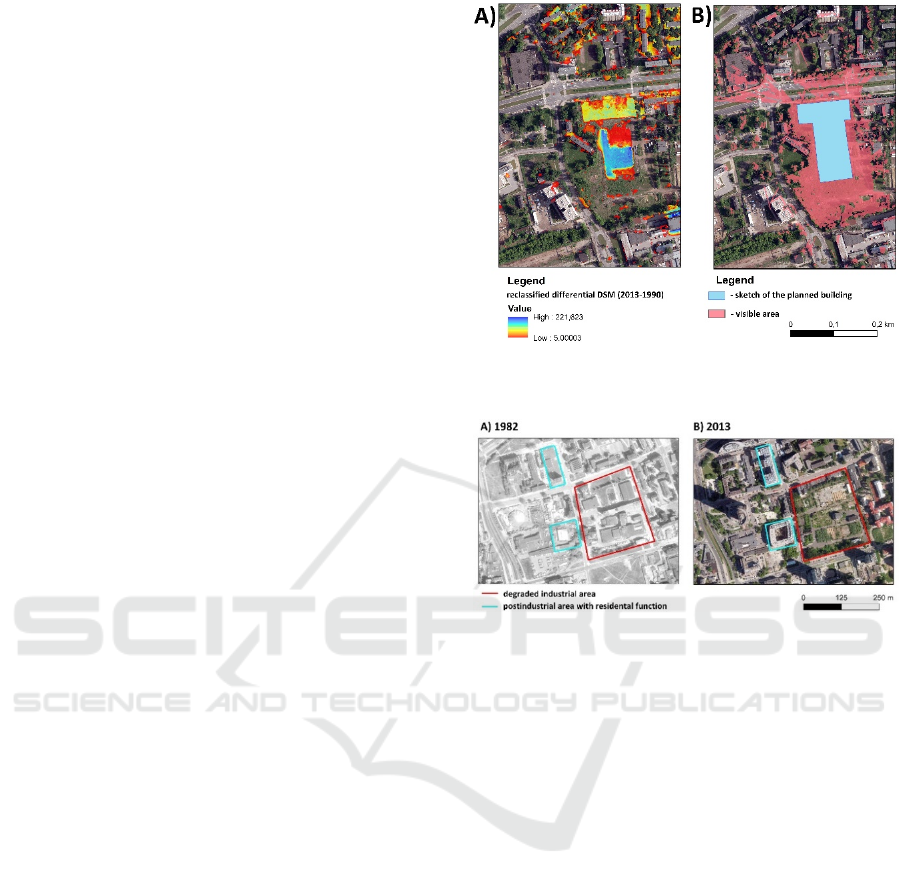
In the first stage, places where buildings were
demolished in specified areas may be detected using
multisource data. These indicated areas can be the
locations of new investments. The raster in Fig. 11a
indicates areas in which a building was demolished
during the time period 1990-2013. It was created by
reclassifying differential DSM. With regard to the
accuracy of the generated archival model, it was
assumed that only values > 5m of differential DSM
correspond to real land cover changes.
In the next step, visibility analysis may be
performed for places in which new buildings are to be
constructed based on DSM created from LiDAR point
cloud (Fig 11b).
2.3.4 Analysis of Types and Conditions of
Development
The conditions of the existing development were
analysed for the selected test site. Using multisource
data, i.e. true-orthophotomaps/orthophotomaps and
aerial laser scanning, the heights of buildings and
standards of development may be differentiated.
The analysis indicates that degraded, post-
industrial objects exist in fragments of the test site and
modern, exclusive housing districts have arisen
beside them (Fig. 12).
Figure 11: a) Reclassified differential DSM (2013-1990)
and b) Visibility map for the planned building.
Figure 12: An example of degraded, post-industrial areas
and newly constructed apartment houses. The degraded
industrial area is marked in red while the post-industrial
area with residential functions is marked in blue.
2.3.5 Identification of Soil Pollution
Polish legislation has undergone considerable
modifications due to the necessity of adapting it to EU
requirements. Among other things, these
modifications have concerned issues related to the
pollution of post-industrial areas. An important step
in this field was the publication of the Ordnance of
the Minister of the Environment of September 1, 2016
on the register of historical pollution of the Earth's
surface (Dz.U. 2016 item 1397), which, among other
things, obligates that maps of historically polluted
areas are produced.
Based on the geo-chemical atlas of Warsaw,
places of increased intensity of harmful substances in
soils were identified (the surface layer of soils, 0.0 –
0.3 m) (Fig. 13).
Soils with alkaline pH dominate within the area.
In the south-western part of the district, in previous
railway areas, close to the concentration of objects of
industrial functions, the increased concentration of
arsenic, barium, chromium, copper and mineral oils,
and in the central part of the district, the concentration
GISTAM 2018 - 4th International Conference on Geographical Information Systems Theory, Applications and Management
228
of polycyclic aromatic hydrocarbons (PAH), zinc and
mercury was identified.
Due to the lack of commonly accessible information
concerning locations of post-industrial areas and
possible, developers sometimes locate housing or
trade-and-service investments in attractive areas
where industrial plants existed in the past. Such areas
are not always analysed with respect to the intensity
of concentration of harmful substances and, as a
result, they are not the subject of re-cultivation.
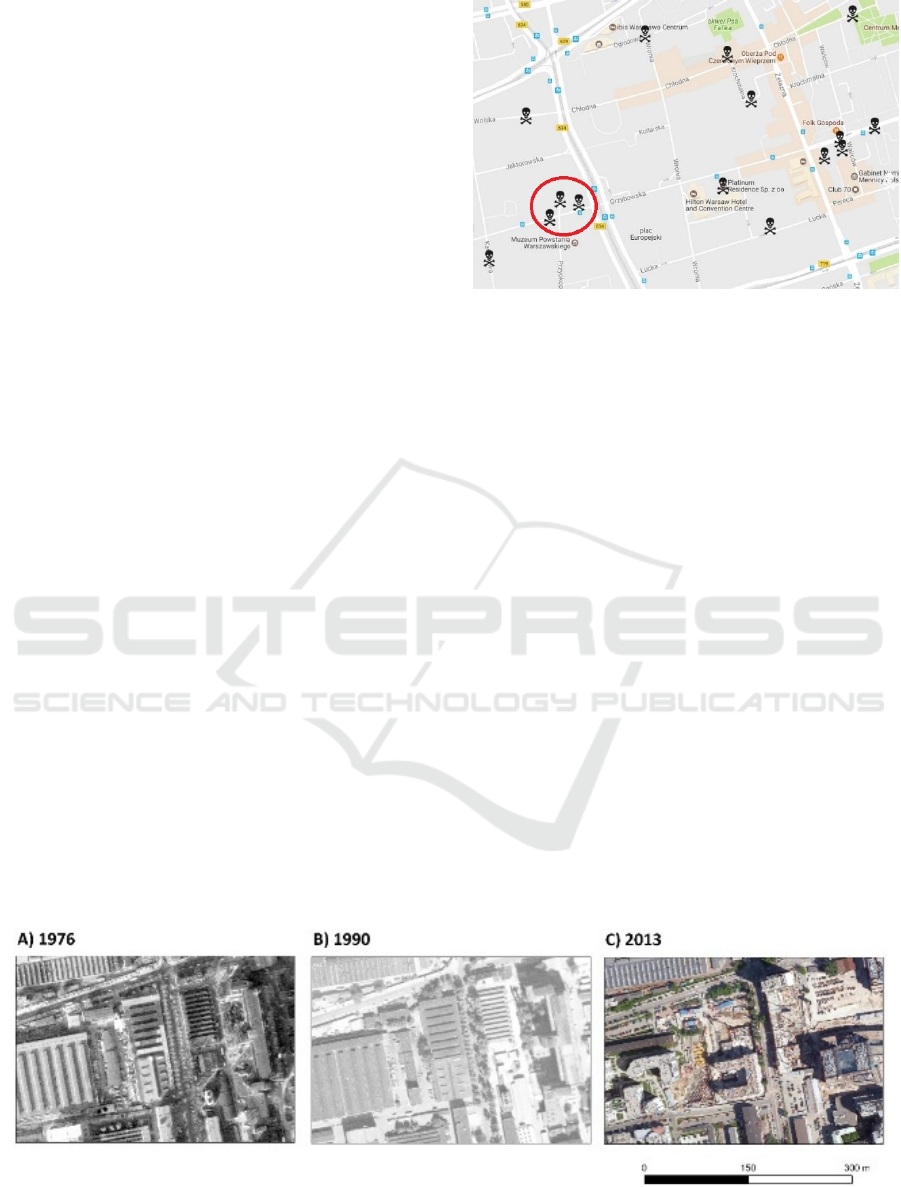
Inhabitants, afraid of their health, and willing to act
against such conditions, create maps of pollutions of
their own. Such a map was created in the Wola district
when problems concerning several investments
occurred (among others, in Skierniewicka Street and
Obozowa Street). Inhabitants of this district
developed a map of locations of where industrial
plants were located in the past. Despite the lack of
professional aid in the cartographic development of
that map, as well as serious methodological failures,
that map should be considered as a valuable example
of social activity in the field of ecological knowledge
and the analysis of hazards for human health, which
are important in the process of revitalisation.
The analysis of the changes in development
performed based on multitemporal data in the context
of the location of industrial plants may support the
development of such maps, in particular, in the field
of identification of lands polluted in the past (Fig. 14).
3 DISCUSSION AND
CONCLUSIONS
In many cases, archival photographs may be the best
source of historical information about urban areas.
A block of scanned aerial photographs can be
easily processed into geo-referenced products such as
orthomosaics, point clouds or digital surface models.
Figure 13: Map of possible areas of historical pollution of
soils. The indicated area is analysed in the next figure.
These archival products are valuable resources for
planning activities including landscape and land use
analysis or assessment of environmental impacts.
An important advantage of using
photogrammetric data in combination with GIS
processing for spatial planning purposes is the
possibility of achieving readable visualizations of
spatial phenomena and changes which occur in
specified areas. DSM indicates the height of
individual projects that can be directly used for height
analysis. Multitemporal photogrammetric
documentation allows us to comprehensively
evaluate the tested area in terms of future
development and corrections of existing spatial
development plans.
The accuracy of 3D reconstruction from archival
photogrammetric data is limited by the quality of the
scanned photographs available. Using Structure from
Motion software to processing this kind of data is
connected to the high unpredictability of the obtained
results. Therefore, the results of spatial analysis with
the use of archival geo-referenced DSM models or
ortophotomaps should be always verified by a spatial
planner.
Figure 14: An example of fragments of archival (A, B) and current (C) orthophotomaps in which industrial objects were
located and where the analysis of the increased intensity of harmful substances may be performed.
An Example of Multitemporal Photogrammetric Documentation and Spatial Analysis in Process Revitalisation and Urban Planning
229

This paper presents the possibilities of the
integration of photogrammetric data for the needs of
spatial management, in particular for the needs of
supporting revitalisation processes. Applying the
appropriate data orientation and its recording in the
database makes is possible to visualise and to perform
spatial analysis with consideration of the third
dimension. The use of high resolution photogram-
metric data and the functionality of Geographic
Information Systems (GIS) may simplify the
effective management of urban spaces. The spatial
analyses performed, based on, among others,
photogrammetric data, are undoubtedly useful tool
for forecasting and optimisation.
REFERENCES
Chicago Metropolitan Agency for Planning (CMAP),
“Northeastern Illinois Air Photo Archive and
Webmap”, 2017, http://www.cmap.illinois.gov/data/
land-use/air-photo-archive
El-Hakim, S., Lapointe, J.-F., Whiting, E., 2008: Digital
reconstruction and 4D presentation through time. Proc.
SIGGRAPH.
Goncalves, J. A., 2016. Automatic orientation and
mosaicking of archived aerial photography using
Structure from Motion. International Archives of the
Photogrammetry, Remote Sensing and Spatial
Information Sciences, Lausanne, Switzerland, Volume
XL-3/W4, the European Calibration and Orientation
Workshop, pp. 123-126.
Moussa, W., 2014: Integration of Digital Photogrammetry
and Terrestrial Laser Scanning for Cultural Heritage
Data Recording. Verlag der Bayerischen Akademie der
Wissenschaften in Kommission beim Verlag C.H.
Beck, Muchen, Germany.
Nocerino, E., Menna, F., Remondino, F., 2012: Multi-
temporal analysis of landscapes and urban areas. Int.
Archives of Photogrammetry, Remote Sensing and
Spatial Information Sciences, Vol. 39(4), pp. 85-90.
Ogryzek, M., Rząsa, K.: The Use of Multi-Criteria GIS
Analysis in the Revitalisation of Space, 2017 Baltic
Geodetic Congress (BGC Geomatics).
Patias, P., Kaimaris, D., Stylianidis, E., 2011: Change
detection in historical city centers using multi -source
data: the case of historical center of Nicosia – Cyprus.
Proc. 23 rd Int. CIPA Conference, Prague, Czech
Republic.
Ratcliffe, I. C., G. M. Henebry, 2004: Using declassified
intelligence satellite photographs with Quickbird
imagery to study urban land cover dynamics: a case
study from Kazakhstan. Annual Proceedings ASPRS,
Denver CO., paper 198: 1 -10.
Redecker, A. P., 2008: Historical aerial photographs and
digital photogrammetry for impact analyses on derelict
land sites in human settlement areas. Int. Archives of
Photogrammetry, Remote Sensing and Spatial
Information Sciences, Vol 37(B8), pp. 5- 10.
Salach, A.: SAPC – Application for Adapting Scanned
Analogue Photographs to Use Them in Structure from
Motion Technology, Int. Arch. Photogramm. Remote
Sens. Spatial Inf. Sci., XLII-1/W1, 197-204,
https://doi.org/10.5194/isprs-archives-XLII-1-W1-
197-2017, 2017.
Schindler, G., 2010: Unlocking the urban photographic
record through 4D scene modelling. PhD thesis,
Georgia Tech. Univ.
Stefani, C., Busayarat, C., Renaudin, N., De Luca, L.,
Véron, P., Florenzano, M., 2011: An image -based
approach for the architectural modeling of past states.
IAPRS&SIS, Vol 38(5/W16).
Vizzari, L., 2011: Spatio-temporal analysis using urban-
rural gradient modelling. Proc. ICCSA 2011, Murgante
et al. (Eds.), LNCS 6782, Part I, pp. 103-118.
Zawieska, D., Markiewicz, J. S., Kopiasz, J., Tazbir, J., and
Tobiasz, A.: 3D Modelling of the Lusatian Borough in
Biskupin Using Archival Data, Int. Arch. Photogramm.
Remote Sens. Spatial Inf. Sci., XLII-2/W3, 665-669,
https://doi.org/10.5194/isprs-archives-XLII-2-W3-
665-2017, 2017.
GISTAM 2018 - 4th International Conference on Geographical Information Systems Theory, Applications and Management
230
