Soft Load Shedding: An Efficient Approach to Manage Electricity
Demand in a Renewable Rich Distribution System
Tayyab Aslam and Naveed Arshad
Department of Computer Science, Lahore University of Managment Sciences, Sector U DHA, Lahore, Pakistan
Keywords:
Demand Side Management, AMI, Clustering.
Abstract:
Matching demand and supply of electricity generation is difficult in a renewable-rich system. This is partly
due to the long-term variability and short-term uncertainty of wind and solar. Utilities use several approaches
to deal with the variations of renewable generation. Some of these include having extra fossil fuel based
peaker plants, managing flexible loads using demand-side management, real-time pricing etc. In this paper,
we present another approach to manage supply variations by introducing semi-flexible loads at the demand
side. These semi-flexible loads are residential loads that cannot be shut down or be moved completely to
another hour but have the possibility to shed a small percentage of their load for a short time. This approach
called soft load shedding is challenging as residential customers have the multitude of energy usage patterns.
In this paper we compare and contrast three soft load shedding techniques and discuss their strengths and
shortcomings in matching the demand with available supply.
1 INTRODUCTION
Renewable sources are taking the center stage in the
generation of electricity. Many countries have plans
to shift to all renewable sources of electricity by 2050
(Connolly et al., 2011; Cosic et al., 2012). While re-
newable sources like solar and wind provide an en-
vironmentally friendly solution to the energy demand
and supply, they also create challenges in the electri-
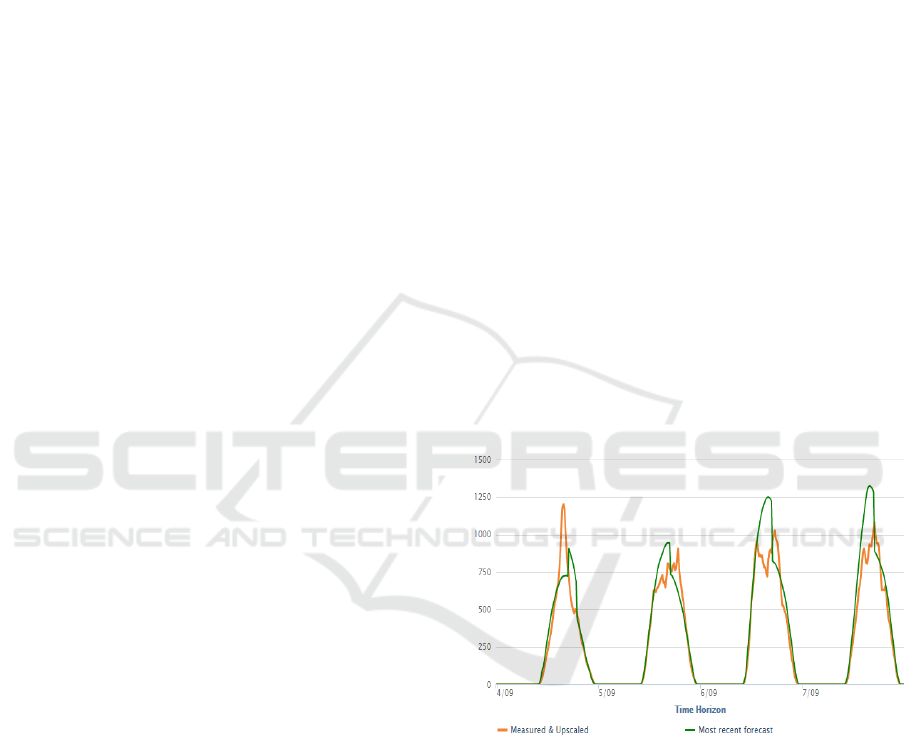
city distribution system. Figure 1 and 2 shows four
days actual generation and forecasted power genera-
tion of Solar-PV and Wind for Belgium. It is quite
noticeable that the generation is not according to the
forecast. These problems mostly stem from the vari-
ability and uncertainty of renewable sources as varia-
tions in renewable sources output causes a mismatch
between the demand-supply of electricity.
With the current penetration level of renewables,
utilities use different approaches to handle demand
and supply gap. One of the approaches is to have ex-
tra fossil fuel based standby peaker plants. But these
plants are very expensive to run and maintain. Anot-
her approach is real-time pricing where prices of elec-
tricity vary hourly and customers are charged accor-
dingly. But when prices go down real-time pricing
cause a rebound effect which results in another peak
demand. Another technique is demand side manage-
ment (DSM). Many DSM techniques are available in
Figure 1: Solar-PV Power Forcasting for Belgium.
the literature but the ones for residential customers
mostly require direct control over high powered ap-
pliances which is very difficult to implement and may
not be possible legally in some countries. Electricity
storage (Roberts and Sandberg, 2011; Mohd et al.,
2008; Vytelingum et al., 2010) at grid level can also
be used to manage this gap but present storage techno-
logy is expensive and have limits.
Another line of research uses electricity curtail-
ment for managing the variation in supply (Aalami
et al., 2010). In such programs certain financial bene-
fits are offered to the customer for reducing their on-
going consumption up to a certain minimum percen-
Aslam, T. and Arshad, N.
Soft Load Shedding: An Efficient Approach to Manage Electricity Demand in a Renewable Rich Distribution System.
DOI: 10.5220/0006774001010107
In Proceedings of the 7th International Conference on Smart Cities and Green ICT Systems (SMARTGREENS 2018), pages 101-107
ISBN: 978-989-758-292-9
Copyright
c
2019 by SCITEPRESS – Science and Technology Publications, Lda. All rights reserved
101
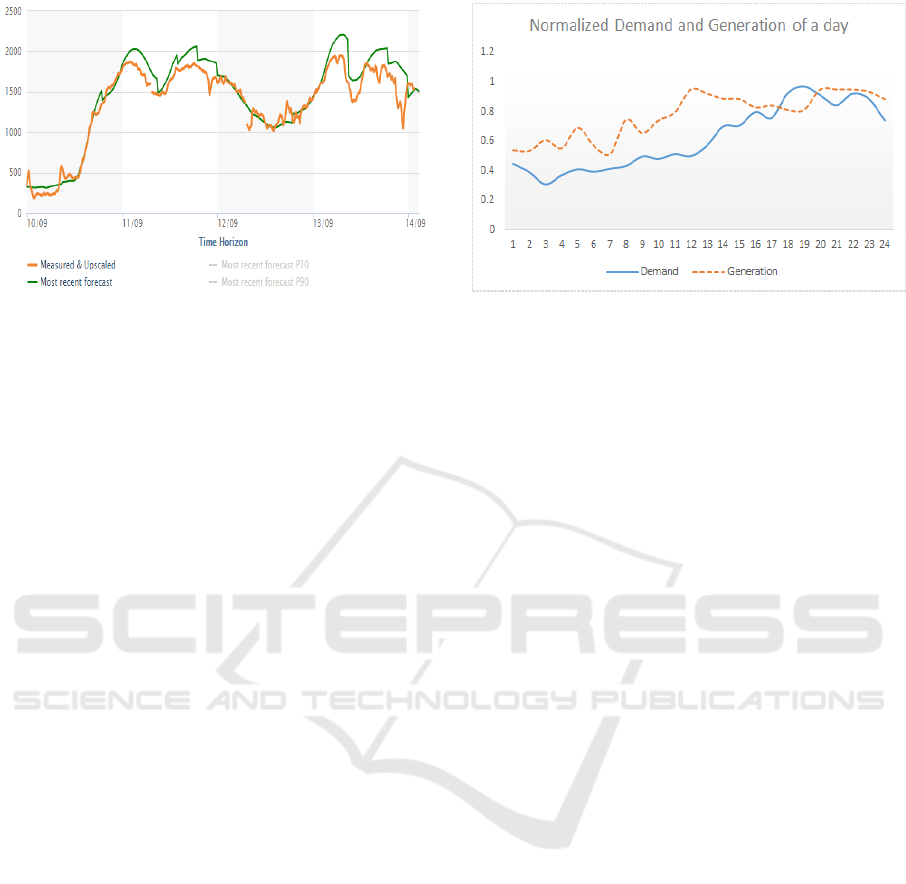
Figure 2: Wind Power Forcasting for Belgium.
tage. If participant customer fails to reduce their con-
sumption within the time limit then they get a finan-
cial plenty. These programs are considered a the last
choice as consumption reduction from the customer
is not guaranteed. Another line of research looks at
varying electricity voltage quilty along with demand-
side management (Craciun et al., 2009). This could
also be used to match supply and demand but com-
promise on electricity quality is often dangerous and
can result in failure of electrical appliances. With in-
creasing renewable penetration we need newer appro-
aches to deal with the problems of renewable integra-
tion into the overall electricity distribution system.
To this end, we are working towards developing a
Deeply Intelligent Demand Side Management System
(DIDS). DIDS integrates the generation and distri-
bution through better forecasting and planning using
various optimization mechanisms. Typically utilities
have flexible and inflexible loads. Flexible loads are
industrial, agricultural or other loads that could be ad-
justed within a time window. Inflexible loads are lo-
ads that cannot be moved in such a way. We intro-
duce semi-flexible loads that are residential loads that
could not be completely shut down or moved to anot-
her hour but may shed their load by a small percen-
tage.
One of the optimization methods that DIDS uses
is Soft Load Shedding (SLS) of semi-flexible loads.
SLS could be carried out on residential customers
using threshold metering that comes with most AMI
deployments. Of course, SLS could only be carried
out if the customers’ contracts allow for such provi-
sion. For this paper, we assume that such provision
is available in customer contracts. Furthermore, just
like peaker plants are used for only 3-5 of the time,
SLS may only be carried out at times of extraordi-
narily high electricity demand or at the time of low
renewable generation. For example, in Figure 3 a nor-
malized demand and supply situation is presented for
a 24 hours period. The demand is under the supply
Figure 3: Normalize Demand and Generation for a Rene-
wable Rich Electricity System.
throughout the day except for a short period at 18:00-
19:00 hours. This particular time requires some form
of load shifting or load shedding.
Although semi-flexible residential loads are smal-
ler loads, their myriad number adds up to a large share
in the distribution system and could be used together
to shed a certain percentage of the demand. For ex-
ample, the utility distribution company we work with
has a total of 4.1 million customers. Out of which 3.5
million customers are residential customers using up
to around 53% of the total available electricity. One of
the goals of this paper is to develop a scalable techni-
que for SLS. This is important because most of the
techniques we study in the literature are not scalable
beyond a certain number of customers. Moreover, the
SLS approach is a proactive approach like Demand
Side Management (DSM) and not a reactive approach
like Demand Response (DR).
To keep the demand under the supply, the idea be-
hind SLS is that residential customers mostly use at
least a handful of electric devices and household ap-
pliances. Shutting down a limited number of them
may not affect customers’ quality of life, but overall
this step may help to keep the demand under the avai-
lable renewable supply. The decision of which appli-
ance to shut down to reduce the energy usage is left
to the customer through only assigning an allocation
that is based on historical load profiles.
Managing the demand for large industrial and
commercial customers has been a thoroughly resear-
ched area in DSM. However, as we will see later in the
paper SLS cannot be applied to residential customers
in a straightforward manner using traditional DSM
techniques. Soft load shedding of semi-flexible lo-
ads requires an insight of customers’ electricity usage
patterns to save energy.
SMARTGREENS 2018 - 7th International Conference on Smart Cities and Green ICT Systems
102

2 APPROACH
DIDS manages the energy balance through the fore-
casts of energy demand and supply for a 24 hours pe-
riod. Hourly generation of renewable energy, in parti-
cular, wind and solar could be predicted with a mean
absolute error (MAE) of as low as 2.5% in some re-
gions for a 24-hour forecast (Miettinen and Holttinen,
2017). Similarly, the day ahead forecasts of demand
at utility-scale has considerably low MAE at around
2% as well(Ghalehkhondabi et al., 2017).
DIDS compares the forecasted demand with the
available forecasted supply. If the demand exceeds
the generation for any set of hours, DIDS employ va-
rious mechanisms to keep the demand under the sup-
ply. Some of these methods include moving flexi-
ble loads to another hour where supply is adequately
available, using backup renewable generation sour-
ces such as stored hydro, or biomass, etc. The de-
tails of these methods will be presented at another
venue. However, if all these methods fall short of
meeting the demand for a particular hour, the systems
resorts of SLS. To develop an SLS schedule, the tra-
ditional techniques of load shedding cannot be app-
lied as these techniques are mostly designed for utility
scale(Laghari et al., 2013). Moreover, an important
goal of SLS is to minimize customer inconvenience
which requires insight into the energy usage behavior
of individual customers before being able to shed any
load.
To get an insight into the energy consumption
behavior, we utilize AMI data to build profiles for
each customer using historical usage data at hourly
intervals. This historical data combined with tem-
perature forecast provides the forecasted individual
energy profile of each customer. Similar profiles
have been studied by other colleagues as well(Iyengar
et al., 2016). However, since energy usage profiles at
finer levels have variabilities across days and seasons,
in DIDS we have used the PARX method of finding
customer energy demand profiles (Ardakanian et al.,
2014). The PARX method requires up to three days of
historical data that is used in conjunction with tempe-
rature readings to forecast day ahead individual custo-
mers’ demand profiles. Weekdays and weekends are
forecasted separately in the PARX method. For the
hour(s) where the demand exceeds supply SLS provi-
des a way to assign an allocation of energy for each
customer based on their forecasted usage. In the sub-
sequent section, we discuss three ways of carrying out
SLS.
3 SLS METHODS
To discuss the SLS methods, we use data set of hourly
consumption from a city in Sweden. This dataset con-
sists of 1436 customers. We simulate a 20% shortfall
of energy supply for a single hour i.e. 18:00-19:00.
Thus the goal in the following SLS methods is to re-
duce the demand by 20% to keep it under the avai-
lable supply. To deal with any changes in forecasted
demand or generation, in a real distribution system
the amount of shedding may be slightly higher than
20%. However, for simplicity sake, we assume that
shedding of 20% is enough to keep the demand under
the supply.
Figure 5 shows the 24 hours forecasted usage pro-
files of a subset of customers on a Saturday. Some
customers have a pretty constant usage of electricity
while for some the usage vary quite a lot during the
day. To keep usage in perspective, we plot the fore-
casted usage of the SLS hour with the total forecasted
usage of the day. This analysis is depicted in Figure 6.
Except for a few outliers, this figure shows two trend
lines. The first line shows a linear behavior which
means that most customers’ total usage of energy is
proportional to their usage in a particular hour. The
second trend line is a horizontal line that shows cus-
tomers whose energy usage is concentrated mostly in
a particular hour. As the data is on a Saturday, these
could be customers who may spend their day outside
and used energy only at a certain time during the day.
3.1 Equal Allocation / Equal Reduction
The first SLS method is Equal Allocation, that is
equally distributing the available energy to the custo-
mers. Thus if the available energy during the hour is
around 2772 units each of the 1436 dwellings will get
1.93 KWH for the hour. Apparently, such allocation
seems fair, but on a deeper look, this allocation may
create the following problem. The low-end customers
whose requirement is less than the 1.93 KWH are gi-
ven more electricity as using this method 570 units
are allocated beyond the need of such customers. On
the other hand, 730 customers are the ones on which
SLS will be carried out.
Thus, for the low-end customer, if the electricity
is not utilized the utility will face a loss of earnings
and for the high-end customers, the utility will face
an opportunity loss. Thus equal allocation will not get
the true benefits of SLS as we will not get the energy
savings needed for this particular hour.
A similar method is an Equal Reduction where we
calculate the shortfall which is the difference between
demand and supply. The shortfall number is equally
Soft Load Shedding: An Efficient Approach to Manage Electricity Demand in a Renewable Rich Distribution System
103
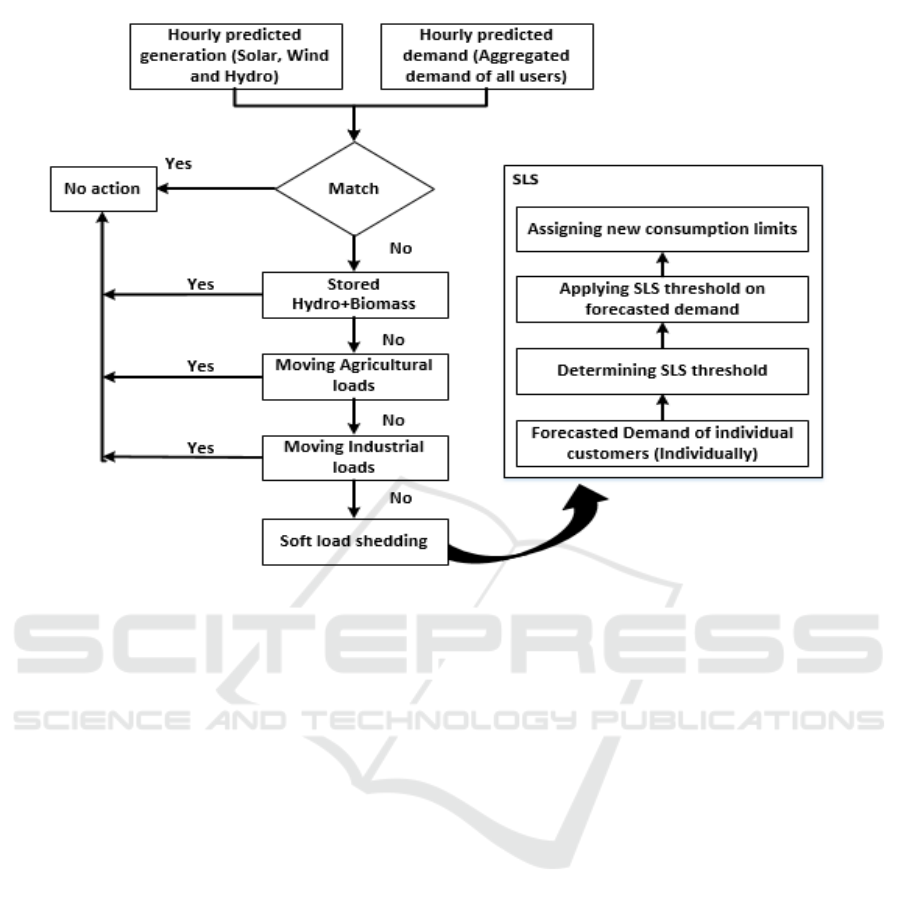
Figure 4: DIDS.
divided across the customer base. For example, if
the shortfall is 693 KWH, each member of the com-
munity will face a reduction of 0.47 KWH each to
make up the demand and supply equation. This met-
hod again seems fair, but on a deeper look it may be
a good solution for a high-end customer, but for 77
low-end customers decreasing 0.47 KWH may mean
shutting down the complete supply for the SLS hour.
Thus this method favors the high-end customers while
deals with the low-end customers unfairly.
3.2 Percentage Reduction
In this method instead of allocating/reducing load ba-
sed on KWH, a percentage of the total forecasted load
is reduced from allocation. This means that if the
shortfall is 20%, each customer will get a 20% re-
duction in their allocation of electricity based on their
forecasted demand. Again this method may seem fair
but it favors the high-end customers as 20% reduction
for a lower end customer may mean not be able to
operate a critical appliance during that hour.
3.3 Clustering Based Incremental
Reduction
The Clustering Based Incremental Reduction (CBIR)
method uses the customer profiling performed
through PARX method as described previously.
Instead of just looking at the hour where the SLS is
to be carried out it takes into account the total energy
used by a customer in the whole 24 hours forecasted
period. We group this data using K-means clustering
with a threshold of 0.2, and K=3.
We show the results of clustering in Table 1. Cu-
stomers are put in three clusters called low usage,
medium usage, and high usage. The low usage cu-
stomers are around 815 and their average demand in
1.41 KWH with a total share of 33.4%. The medium
usage customers are 489 and their average usage is
2.9 KWH with a total share of 40.9%. The high-end
usage customers are 132 and their average usage is
6.72 with a total share of 25.6%.
The total predicted demand for 1436 houses is
3465 KWH for the SLS hour i.e. 18:00-19:00. With
20% less supply we have to cap the demand at 2772
KWH.
In CBIR our first goal is not to carry out SLS
on customers whose usage is below a given thres-
hold. This exemption is to ensure fairness to custo-
mers who are already frugal in their energy usage. Ta-
ble 2 shows customers whose energy consumption is
less than 1 KWH for the SLS hours. Around 221 cu-
stomers are in the low usage cluster but a small num-
ber are in medium usage cluster as well. Other than
fairness, carrying out SLS on these customers yields
SMARTGREENS 2018 - 7th International Conference on Smart Cities and Green ICT Systems
104
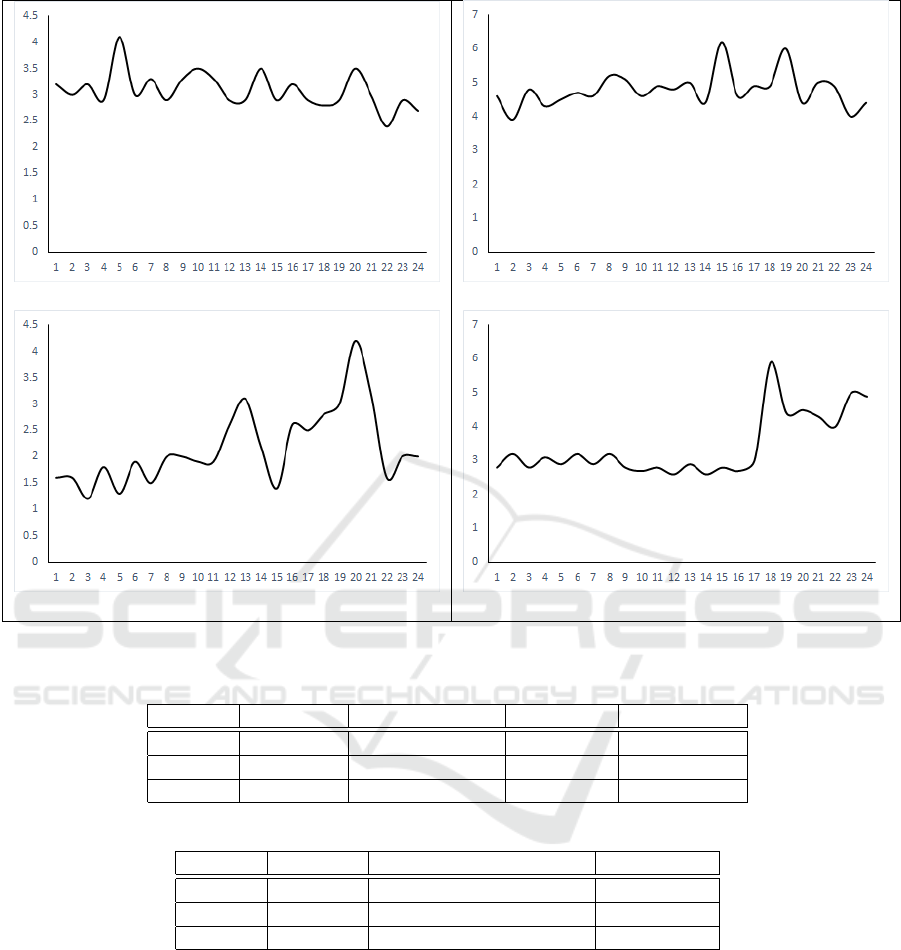
a b
c d
Figure 5: Sample predicted demand profiles of cutomers.
Table 1: Clustering Result: Demand for SLS Hour.
Cluster Customers Demand (KWH) Demand % Avg Demand
Heigh 132 889 25.6 % 6.72
Medium 489 1420 40.9 % 2.9
Low 815 1156 33.4 % 1.41
Table 2: SLS Analysis with 1 KWH Threshold.
Cluster Cutomers Customers under 1 KWH SLS (KWH)
Heigh 132 0 0
Medium 489 7 0.9
Low 815 221 24.66
only 25.56 kWh in energy savings. Thus in CBIR, we
do not carry out any reduction to these selected low
usage customers.
Beyond these customers, we apply the SLS to all
other customers in the following manner: As shown
in Table 3, the low usage customers will get 19.5%
percent reduced allocation in their expected usage for
saving around 201 units. Similarly, for the medium
usage customers, the allocation is reduced by 21% ex-
cept for the seven customers who are exempted from
SLS. This reduction saves around 297.2 KWH from
this category. Finally, the high-end customers are al-
located 22% reduction allocated saving around 195.6
KWH from this cluster.
In total, CBIR manages to reduce the energy usage
by 694.42 KWH while ensuring that the allocation is
carried out as fairly as possible.
4 DISCUSSION
The implementation of AMI with threshold metering
allows SLS on residential customers. In this paper,
Soft Load Shedding: An Efficient Approach to Manage Electricity Demand in a Renewable Rich Distribution System
105
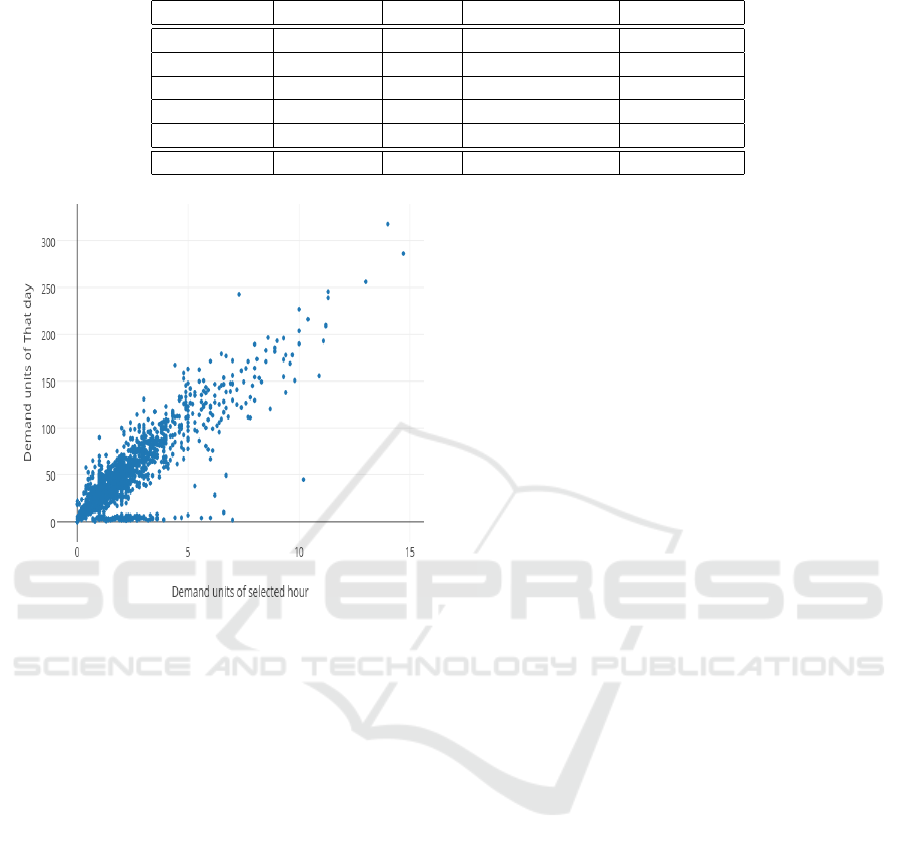
Table 3: SLS percentage for clusters.
Cluster Customers SLS % Demand (KWH) SLS (KWH)
H with SLS 132 22 % 889 195.6
M with SLS 475 21 % 1415.6 297.2
M w/o SLS 7 0 % 4.5 0
L with SLS 594 19.5 % 1032.7 201.4
L w/o SLS 221 0 % 123.3 0
Total 1436 - 3465 694.42
Figure 6: Data for forecasted demand of 1436 customers.
SLS Hour vs. 24-hrs Demand.
we have merely scratched the surface of evaluating
methods in carrying out SLS.
In CBIR we limit the number of clusters to three.
This number is only a demonstration, and in reality,
the number of clusters may vary according to the
need. Similarly, we fixed the threshold to 1 KWH
while in a real distribution system this may vary from
feeder to feeder, area to area and may also have a dy-
namic value. Stemming from this the percentage re-
duction for each cluster also requires further investi-
gation. For this paper, we choose an arbitrary percen-
tage while in reality, it will depend on the actual gap
between demand and supply and the customer con-
tracts. The actual implementation of SLS is also an
important question. How will the customers get the
information of the assigned allocation? What to do if
the customer does not follow the allocation and use
more energy? Should we shut down the customer’s
connection for a brief period which seems harsh or
we should have enough energy buffer in the system to
allow usage beyond her SLS allocation?
Finally, SLS is a technique that we will need in
future to reduce costs associated with the variability
and uncertainty of renewables. The negative energy
prices in Germany and US in recent months due to
overproduction from renewables requires us to resort
to SLS-like methods to manage the growth of renewa-
ble generation in a controlled manner.
5 RELATED WORK
Managing load shedding has been an area of interest
in the power engineering community. However, so
far this interest is mostly focused on utility-scale load
shedding at feeder levels. Recently some work has
been carried out that takes us towards large-scale SLS.
Chandan et al. described a DR control from the uti-
lity that maximizes the user convenience(?). Howe-
ver, this approach requires deep insight into the appli-
ance level usage of the customers while in our appro-
ach we only utilize the meter data from the last few
days to develop SLS schedule. While their technique
may be more beneficial for the customer convenience,
it requires a lot of data at the appliance level from
the customers which may not be possible for all cu-
stomers at utility scale. Moreover, their technique is
more of a DR technique while ours is more of a DSM
one.
Bashir et al. have proposed Direct Load Control
(DLC) system that can enforce several user-defined
low-power states. It directly controls the devices of
the house to manage the load. (Bashir et al., 2015).
While this may be a good solution, the DLC method
is only applicable when all major appliances have this
control capability. Secondly, for millions of custo-
mers, this means managing tens of millions of devi-
ces. Such control may not be possible without incur-
ring a huge extra cost. Chandan et al. provided the de-
signing for demand response event by analyzing cu-
stomers data of smart meter and weather. (Chandan
et al., 2014)
On customer profiling, Ardakanian et al. propo-
sed customer profiling using autoregression based on
data from three days, separately for weekdays and
weekends(Ardakanian et al., 2014). Srinivasan et al.
grouped data from a utility into eight consumption
patterns(Iyengar et al., 2016). Albert and Rajagopal
SMARTGREENS 2018 - 7th International Conference on Smart Cities and Green ICT Systems
106

proposed a technique to similar group customers for
forecasting their energy profiles (Albert and Rajago-
pal, 2013).
Queuing-Based energy consumption management
system for residential smart gird is proposed by Yi Liu
et al. (Liu et al., 2016). Mainly there are two types
of demands, essential and flexible demands. Flexible
demands includes delay-sensitive and delay-tolerant
loads. These loads can be controled by residential
smart grid directly and scheduled accordingly. Which
means they need extra resources for controlling these
appliances, for millions of customer it’s not a feasible
solution.
6 CONCLUSION AND FUTURE
WORK
We have introduced SLS to overcome the issues with
conventional DR and DSM techniques and to manage
the variability factor of renewable energy resources.
The main idea behind SLS is to manage the variabi-
lity factor of renewable resources while keeping fair-
ness and customer inconvenience in view. Our future
work involves finding the most suitable balance be-
tween forcing and requesting the customers to shed
their energy usage at the time of need. Moreover,
since SLS depends on the forecasting of individual
customers’ energy profiles, we will be working to im-
prove this forecasting. While consumer level forecas-
ting techniques claim to have 80% accuracy, our goal
is to use contextual information from customers to im-
prove forecasting further. Smart grid testbed (Tushar
et al., 2016) could be use to test our solution and will
help us to imporve our technique.
REFERENCES
Aalami, H., Moghaddam, M. P., and Yousefi, G. (2010).
Demand response modeling considering interrupti-
ble/curtailable loads and capacity market programs.
Applied Energy, 87(1):243–250.
Albert, A. and Rajagopal, R. (2013). Smart meter dri-
ven segmentation: What your consumption says
about you. IEEE Transactions on power systems,
28(4):4019–4030.
Ardakanian, O., Koochakzadeh, N., Singh, R. P., Golab,
L., and Keshav, S. (2014). Computing electricity con-
sumption profiles from household smart meter data. In
EDBT/ICDT Workshops, volume 14, pages 140–147.
Bashir, N., Sharani, Z., Qayyum, K., and Syed, A. A.
(2015). Delivering smart load-shedding for highly-
stressed grids. In Smart Grid Communications
(SmartGridComm), 2015 IEEE International Confe-
rence on, pages 852–858. IEEE.
Chandan, V., Ganu, T., Wijaya, T. K., Minou, M., Stamou-
lis, G., Thanos, G., and Seetharam, D. P. (2014). idr:
Consumer and grid friendly demand response system.
In Proceedings of the 5th international conference on
Future energy systems, pages 183–194. ACM.
Connolly, D., Lund, H., Mathiesen, B., and Leahy, M.
(2011). The first step towards a 100% renewable
energy-system for ireland. Applied Energy, 88(2):502
– 507. The 5th Dubrovnik Conference on Sustainable
Development of Energy, Water and Environment Sys-
tems, held in Dubrovnik September/October 2009.
Cosic, B., Krajacic, G., and Duic, N. (2012). A
100% renewable energy system in the year 2050:
The case of macedonia. Energy, 48(1):80 – 87.
6th Dubrovnik Conference on Sustainable Develop-
ment of Energy Water and Environmental Systems,
{SDEWES} 2011.
Craciun, D., Ichim, S., and Besanger, Y. (2009). A new soft
load shedding: Power system stability with contribu-
tion from consumers. PowerTech, 2009 IEEE Bucha-
rest, pages 1–6.
Ghalehkhondabi, I., Ardjmand, E., Weckman, G. R., and
Young, W. A. (2017). An overview of energy demand
forecasting methods published in 2005–2015. Energy
Systems, 8(2):411–447.
Iyengar, S., Lee, S., Irwin, D., and Shenoy, P. (2016). Ana-
lyzing energy usage on a city-scale using utility smart
meters. In Proceedings of the 3rd ACM Internatio-
nal Conference on Systems for Energy-Efficient Built
Environments, pages 51–60. ACM.
Laghari, J., Mokhlis, H., Bakar, A., and Mohamad, H.
(2013). Application of computational intelligence
techniques for load shedding in power systems: A re-
view. Energy Conversion and Management, 75:130 –
140.
Liu, Y., Yuen, C., Yu, R., Zhang, Y., and Xie, S. (2016).
Queuing-based energy consumption management for
heterogeneous residential demands in smart grid.
IEEE Transactions on Smart Grid, 7(3):1650–1659.
Miettinen, J. J. and Holttinen, H. (2017). Characteristics
of day-ahead wind power forecast errors in nordic
countries and benefits of aggregation. Wind Energy,
20(6):959–972. WE-15-0321.R2.
Mohd, A., Ortjohann, E., Schmelter, A., Hamsic, N., and
Morton, D. (2008). Challenges in integrating distribu-
ted energy storage systems into future smart grid. In
Industrial Electronics, 2008. ISIE 2008. IEEE Inter-
national Symposium on, pages 1627–1632. IEEE.
Roberts, B. P. and Sandberg, C. (2011). The role of energy
storage in development of smart grids. Proceedings of
the IEEE, 99(6):1139–1144.
Tushar, W., Yuen, C., Chai, B., Huang, S., Wood, K. L.,
Kerk, S. G., and Yang, Z. (2016). Smart grid test-
bed for demand focused energy management in end
user environments. IEEE Wireless Communications,
23(6):70–80.
Vytelingum, P., Voice, T. D., Ramchurn, S. D., Rogers,
A., and Jennings, N. R. (2010). Agent-based micro-
storage management for the smart grid. In Procee-
dings of the 9th International Conference on Auto-
nomous Agents and Multiagent Systems: Volume 1-
Volume 1, pages 39–46. International Foundation for
Autonomous Agents and Multiagent Systems.
Soft Load Shedding: An Efficient Approach to Manage Electricity Demand in a Renewable Rich Distribution System
107
