
A New Device for Hydrogen Production on Demand with Application
to Electric Assist Bike: Description, Production Characteristics and
Basic Control
Jocelyn Sabatier
1
, Fabrice Mauvy
2
, Jean-Louis Bobet
2
, Damien Mohedano
3
,
Matthieu Faessel
3
and Frédéric Bos
3
1
Bordeaux University, IMS Lab., UMR 5218 CNRS, 351 Cours de la Libération, 33405 Talence, France
2
CNRS, ICMCB Lab, UPR 5026, 87 Avenue du Dr Albert Schweitzer, 33600 Pessac, France
3
Bordeaux University, TechnoShop Coh@bit platform, Bordeaux Institute of Technology,
15 Rue Naudet, 33750 Gradignan, France
Keywords: Hydrogen, PEM Fuel Cell, Production on Demand, Water Hydrolysis, Magnesium.
Abstract: Using a magnesium-based hydrolysis reaction that spontaneously produces hydrogen with a high kinetic and
a high efficiency, this paper proposes a solution to supply a PEM fuel cell that permits production on
demand. This solution is an instrumented reactor that uses capsules with magnesium powder and that
controls the hydrolysis reaction in order to maintain a constant pressure. The hydrogen produced by the
reactor is used to feed a PEM fuel cell in which variable electric loads are applied. By solving both the
hydrogen supply and storage problems, such a system is particularly suitable for light mobility applications.
1 INTRODUCTION
Urban travel covers a significant economic reality.
The last mile represents almost 20% of the total cost
of the freight value chain. In France, it accounts for
about 20% of the traffic, occupies 30% of the road
network and is responsible for 25% of greenhouse
gas emissions (Roullé and Lorrillard, 2012). The last
mile problem of goods and persons thus raises many
essential issues - economic, environmental, societal
and urbanistic - that the authorities are trying to
solve with electric vehicle such as bicycle or
tricycle. As the recharging of these means of
transport is a lengthy process, dihydrogen (H
2
)
coupled with a fuel cell as a source of fuel is thus
often considered.
Hydrogen mobility is seen by many as a solution
for the future. Indeed, the modularity of hydrogen
(used directly or indirectly via a fuel cell), its high
combustion energy (3 times that of hydrocarbons)
and its non-polluting nature make it a very
promising fuel. However, three major problems
hinder the large-scale development of this
technology.
Environment: 95% of the hydrogen currently
produced comes from steam reforming of natural gas
which does not solve environmental problems. The
production of hydrogen without an environmental
impact therefore remains an important issue
Refueling: In a country such as France, there are
only very few points where hydrogen refueling is
possible.
Storage: Hydrogen can be stored under pressure
or in liquid form, which in both cases causes storage
safety and/or cost problems, or in solid form in
hydrides, which solves the safety question but
induces a large tank mass constraint. In any case, the
volume of the tank will be larger than a tank of
hydrocarbons.
The work described in this paper provides an
answer in the area of electric assistance for bikes or
tricycles or more generally for light mobility. In
such applications, the hydrogen must be produced
on demand, as the PEM fuel cell needs to consume it
to produce electrical energy, to avoid any storage
constraints. To reach this goal, the hydrogen is
produced by the help of water hydrolysis. In order to
control the reaction, a dedicated reactor was
designed. This reactor has been implemented in a
Sabatier, J., Mauvy, F., Bobet, J-L., Mohedano, D., Faessel, M. and Bos, F.
A New Device for Hydrogen Production on Demand with Application to Electric Assist Bike: Description, Production Characteristics and Basic Control.
DOI: 10.5220/0006846304110419
In Proceedings of the 15th International Conference on Informatics in Control, Automation and Robotics (ICINCO 2018) - Volume 1, pages 411-419
ISBN: 978-989-758-321-6
Copyright © 2018 by SCITEPRESS – Science and Technology Publications, Lda. All rights reserved
411
test bench to feed a PEM fuel cell associated to an
electric load.
2 CHEMICAL REACTIONS FOR
HYDROGEN PRODUCTION
In the present study, hydrogen gas is produced by
hydrolysis reaction. One of the main advantage is
that no additional energy is required (low
temperature operation) and delocalized and rather
pure hydrogen can be produced. Various materials
have been used to perform hydrolysis: complex
hydrides (Kojima et al, 2004), (Muir and Yao,
2011), metal (Huang et al, 2013), metal hydride
(Uesugi et al, 2011), and intermetallics (Li et al,
2013) (Huang et al., 2014).
Magnesium metal was selected in this study for
hydrogen production via hydrolysis due to its high
electrochemical activity, low density, low cost,
abundance and nontoxicity.
Magnesium reacts with water according to the
following equation:
2
2
2
HOHMgO2HMg
. (1)
However, the magnesium hydrolysis reaction is
always blocked by the formation of a passive
hydroxide layer Mg(OH)
2
at the surface of the solid
grains and cannot be carried out completely
(maximum yield of 10 to 15% only). In order to
improve the hydrolysis efficiency of Mg, different
additives and grinding processes have been
investigated. The technical solution used here is
described in details in (Awad et al, 2016) (Mauvy et
al, 2017). The resulting powder exhibits fast kinetics
and 100% yield. Considering reaction (1), 1 g of
magnesium powder (with above-mentioned
additives) with 1.5 g (or ml) of water produces
0.877 l (or 0.0789 g) of dihydrogen, leading to a
chemical energy of 9.03 kJ. In the laboratory, the
efficiency of this reaction is within 90 and 100%
(depending on the additives used) (Awad et al,
2016).
3 REACTOR
3.1 Description of the Setup
The reaction described by relation (1), is
spontaneous (if prepared as explained in (Awad et
al, 2016)) and only terminates when one of the two
reagents (magnesium or water) is lacking.
For bike electric assistance fed with a PEM fuel
cell, in order to avoid a constraining storage tank,
hydrogen must be produced on demand, as the PEM
fuel cell needs to consume it to produce electricity.
Water circulation
Hydrogen circulation
Heat exchange
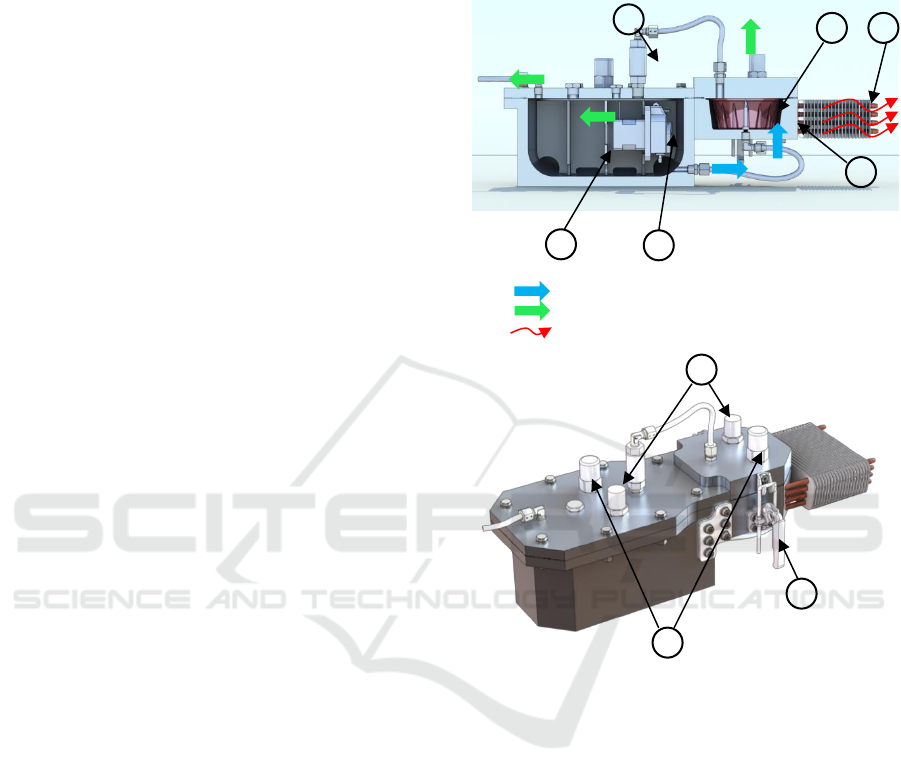
Figure 1: Reactor used to control the water hydrolysis that
produces hydrogen: sectional view (up), general view
(down).
To control the kinetic parameters, an
instrumented reactor was designed and is shown
schematically in figure 1. A peristaltic pump
immersed in the water tank is used to supply a water
flow proportional to the control voltage applied to
the motor driver. This linearity between control
voltage and water flow will facilitate the synthesis of
the control law presented in section 4. The water is
stored in the compartmented tank and the
magnesium powder is contained in the separate
capsule. According to (1), a stoichiometry ratio of
1.5 between mass of water and mass of magnesium
is required. Through the nozzle , the water
sprinkles the magnesium powder and hydrogen is
produced. The hydrogen is evacuated via a non-
return valve into the water tank. The tank thus
acts as a buffer volume and allows the produced
1
2
3
4
5
6
7
8
9
ICINCO 2018 - 15th International Conference on Informatics in Control, Automation and Robotics
412
hydrogen to cool, inducing a partial condensation of
the water vapor it contains. As reaction (1) is
exothermic, the reactor was equipped with a heat-
pipe cooling system . Two sensors measure the
pressure variations inside the tank and inside the
reaction chamber. A PT1000 probe was also
implemented to measure the temperature of the
reaction chamber. Two safety valves were also
mounted on the reactor.
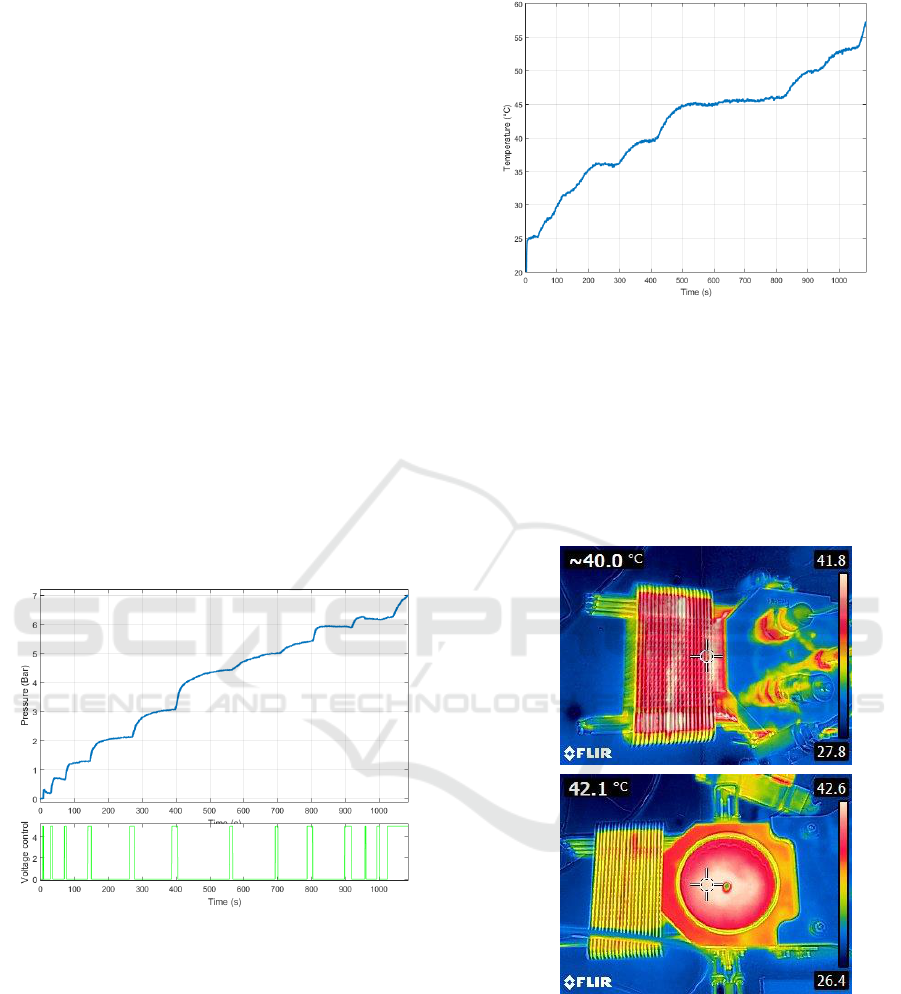
3.2 Tests without Control
The first tests of the H
2
production system were
done with a direct voltage control of the peristaltic
pump and with a capsule containing 10g of
magnesium powder. The variations in the voltage
applied to the pump and the hydrogen pressure
inside the reactor are shown in figure 2. This figure
shows that the reactor is able to control the hydrogen
production since the water injected when the pump
is controlled is completely consumed, and the
pressure no longer rises, meaning that the hydrolysis
reaction has stopped. If water is injected again, the
reaction is resumed and the pressure increases step
by step.
Figure 2: Pressure variation (top) resulting in voltage
control of the pump (bottom).
Due to :
- the proportionality between the injected water flow
and the control voltage applied to the pump
driver,
- the stoichiometry conditions imposed by reaction
(1),
it is possible to define when all the magnesium of
the capsule has been consumed and to create a fuel
gauge.
Figure 3: Temperature variation during the test.
Reactor chamber temperature variations are
shown in figure 3. This temperature analysis was
completed by thermal imaging as illustrated by
figure 4. These figures highlight the efficiency of the
heat-pipe cooling system that reaches a high
temperature during the test in comparison with the
other parts of the reactor (strong heat dissipation of
the cooling system).
(a)
(b)
Figure 4: Thermal imaging of the reactor during the test
and after the test, reaction chamber being open.
A New Device for Hydrogen Production on Demand with Application to Electric Assist Bike: Description, Production Characteristics and
Basic Control
413

(a) (b)
(c) (d)
Figure 5: Powder spray system (a), and capsule with
magnesium powder (b), capsule containing the reaction
products (c) and (d).
Figure 5 shows:
(a) the reaction chamber and the nozzle , without a
capsule;
(b) the reaction chamber with a capsule filled with
magnesium powder
(c) the capsule inside the reaction chamber at the end
of the reaction
(d) the capsule outside the reaction chamber after the
reaction.
After the reaction, the capsule content is magnesium
hydroxide which is a non-polluting and non-harmful
substance (black color due to the additives).
4 TEST BENCH
4.1 Description
The reactor was integrated into the test bench
described in figure 6, equipped with a 100W PEM
type fuel cell. On this bench, the fuel cell is
connected to a resistor (load) controlled in PWM
mode. At the output of the reactor, the hydrogen
pressure is reduced to 0.6 bar to be compatible with
the fuel cell operating specifications. The hydrogen
flow that supplies the fuel cell is also measured by a
flowmeter. The bench supervisor measures the
pressures and temperature inside the reactor, the
hydrogen flow and also several electrical quantities
at the fuel cell and the load terminals. The
supervisor generates the PWM signal applied to the
load, warns the operator when all the magnesium
inside the reactor has been consumed, and manages
Figure 6: Test bench with the reactor and the 100W PEM
fuel cell.
several safety devices. Another goal of this
supervision is to control the kinetics of the
hydrolysis reaction, by regulating the water flow
injected by the pump, through the control of the
voltage V(t) applied to the pump driver, in order to
maintain the hydrogen pressure P(t) inside the
reactor at a reference value P
ref
(t), where t is time.
This is carried out by a control loop shown in figure
7.
4.2 Dynamical Behaviour Analysis
Prior to the design of the control law in figure 7, the
dynamical system linking the pressure P(t) inside the
reactor and the control voltage V(t) applied to the
pump driver must be modeled. Figure 2 shows the
pressure variations when limited duration step input
voltages are applied to the pump driver. This figure
reveals that such a system is weakly non-linear:
similar pressure behaviors are obtained in spite of
variable step duration and whatever the operating
pressure and temperature. A linear modeling
approach was therefore adopted using a transfer
function H(s), where s denotes the Laplace variable.
Measures plotted in figure 8, extracted from the
curves in figure 3, highlight that the pressure
responses begin with a transport delay with respect
to the pump control voltage (part 1). It is followed
by a quasi-linear rise of the pressure (part 2) and
finally there is a long memory relaxation after
stopping the pump (part 3).
Pressure
reducer
Flow
meter
Reactor
Fuel
cell
Load
Fuel cell
controller
Bench
supervisor
ICINCO 2018 - 15th International Conference on Informatics in Control, Automation and Robotics
414
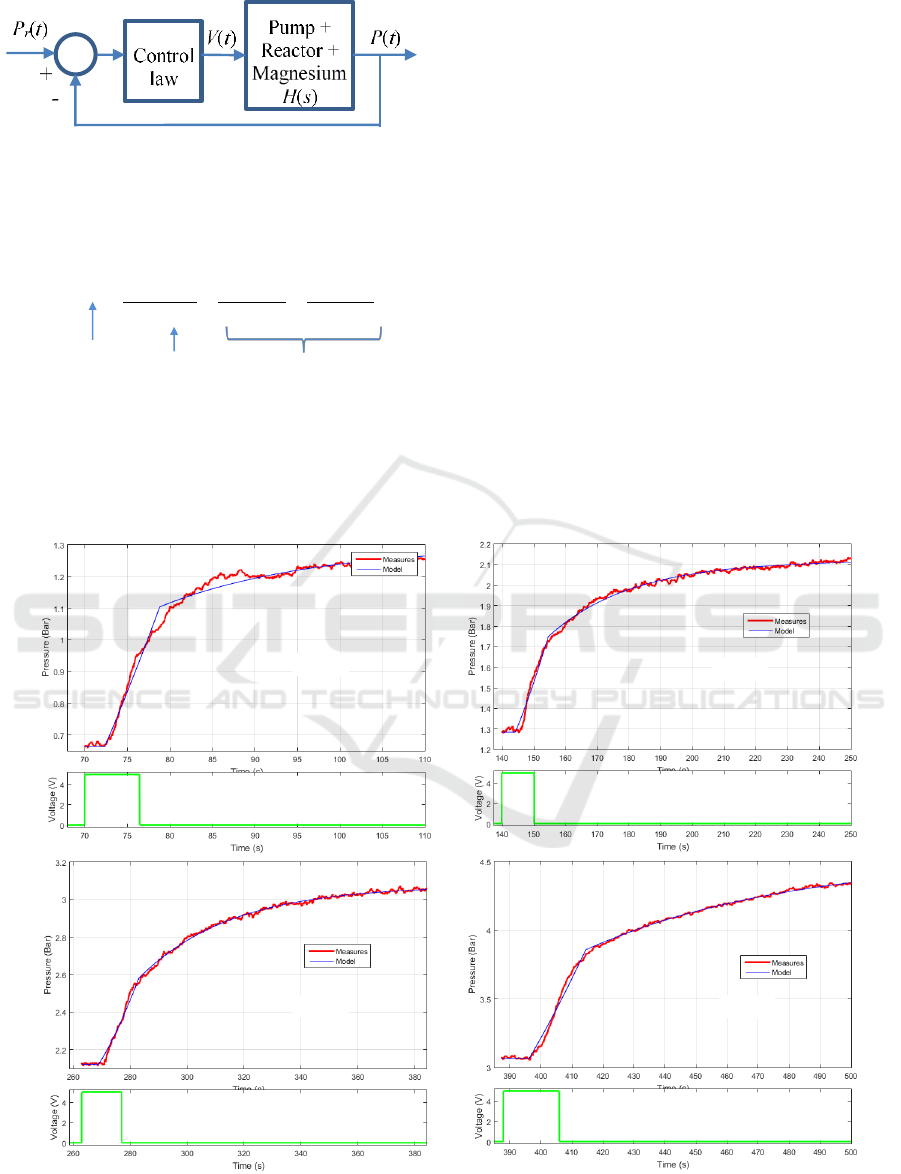
Figure 7: Solution for the pressure control inside the
reactor.
A possible transfer function H(s) is thus:
111
3
3
2
2
1
1
s
K
s
K
ss
K
esH
sT
(2)
where T (sec), is the model time delay, and where K
i
(bars/V) and
I
(sec), i[1..3] are respectively gains
and time constants.
Numerical values of the parameters in relation (2)
can be evaluated for the various operating pressures
considered as shown by figure 8. They are obtained
using a nonlinear optimization algorithm that
minimizes the difference between the recorded data
and the model output. The following inequalities
were obtained:
-2
1
-3
1.9609x103.8929x10 K
. (3)
2
2
-1
1.0061x101.1188x10 K
(4)
2
3
1
1.4938x101.1142x10 K
(5)
1
1
7.4150x104.4598
(6)
4
2
1
2.2138x101.7927x10
(7)
4
3
1
7.3709x101.7927x10
(8)
sTs 91
. (9)
Comparisons between the system and the model
responses obtained are shown in figure 8 and reveal
that the models capture the dynamical behavior of
the system well.
Figure 8: Evolution of the pressure inside the reactor versus time and model response for different working conditions: (a)
from 0.7 bar to 1.2 bar, (b) from 1.3 bar to 2.1 bar, (c) from 2.1 bar to 3 bar, (d) from 3 bar to 4.5 bar.
Part 1
Part 2
Part 3
(a)
(b)
(c)
(d)
A New Device for Hydrogen Production on Demand with Application to Electric Assist Bike: Description, Production Characteristics and
Basic Control
415
4.3 Pressure Controller
Due to the tradeoff imposed by time delays on a
control law (Middleton, 1991) a linear robust control
cannot lead to a large bandwidth feedback system
for the pressure control. Thus, to take into account
parametric variations (Utkin, 1993) highlighted in
the previous section and to ensure a fast dynamical
behavior, a switching controller was used for the
reactor pressure control, the presence of a chattering
phenomenon being the price to pay. This control law
is shown in figure 9.
The controller C(s) is designed to ensure closed loop
stability and to control the period and the magnitude
of the chattering phenomenon. This controller is
defined by the transfer function C(s) reported in
relation (10)
15/
1100
s
s
sC
. (10)
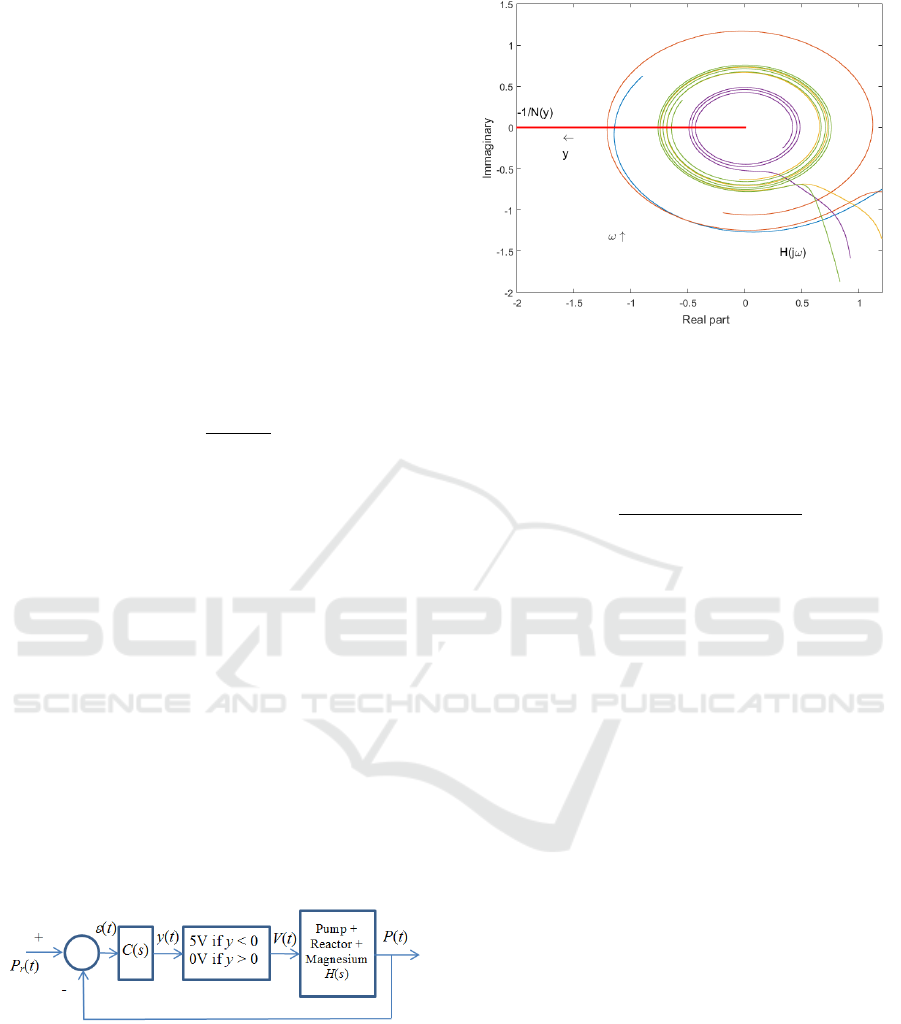
As shown in figure 10, in which the Nyquist
diagram of the transfer function C(s)H(s) and of the
describing function and of the relay nonlinearity are
plotted, such a controller ensures closed loop
stability and a limit cycle whose frequency is within
the interval [0.07- 1.2] rd/s, depending on the
parameters considered for H(s). In this frequency
band, the gain of H(j) is less than -20 dB, thus
leading to a limit cycle magnitude close to 0.2 bar.
The controller C(s), but also several other
supervision functions (temperature, magnesium
gauge, end of reaction detection, fuel cell on/off,
load control, …) are implemented with a National
Instruments MyRio board. The sampling period T
e
of the supervision main loop and thus of the pressure
control loop is chosen equal to 10 ms. The sampling
frequency is thus 628 rd/s. This is more than 1000
times the controlled system bandwidth.
Figure 9: Solution for the control of the pressure inside the
reactor.
Figure 10: Nyquist plot of the transfer function C(s)H(s)
and of the describing function of the relay nonlinearity.
The controller discretization can thus be done using
the Euler approximation s = (1-z
-1
)/T
e
. It thus defined
by
9.950248-z
-9.9502489.955223z
zC
. (11)
4.4 Results
To evaluate the efficiency of the pressure control
loop, a test with 15 g of magnesium powder was
carried out. During the test, the pressure reference is
set to 2.5 bars. The evolution of the pressure versus
time is shown in figure 11. On this figure, the pump
control voltage and the electrical power produced by
the fuel cell are also depicted. Figure 12 shows the
hydrogen flow produced by the reactor and figure 13
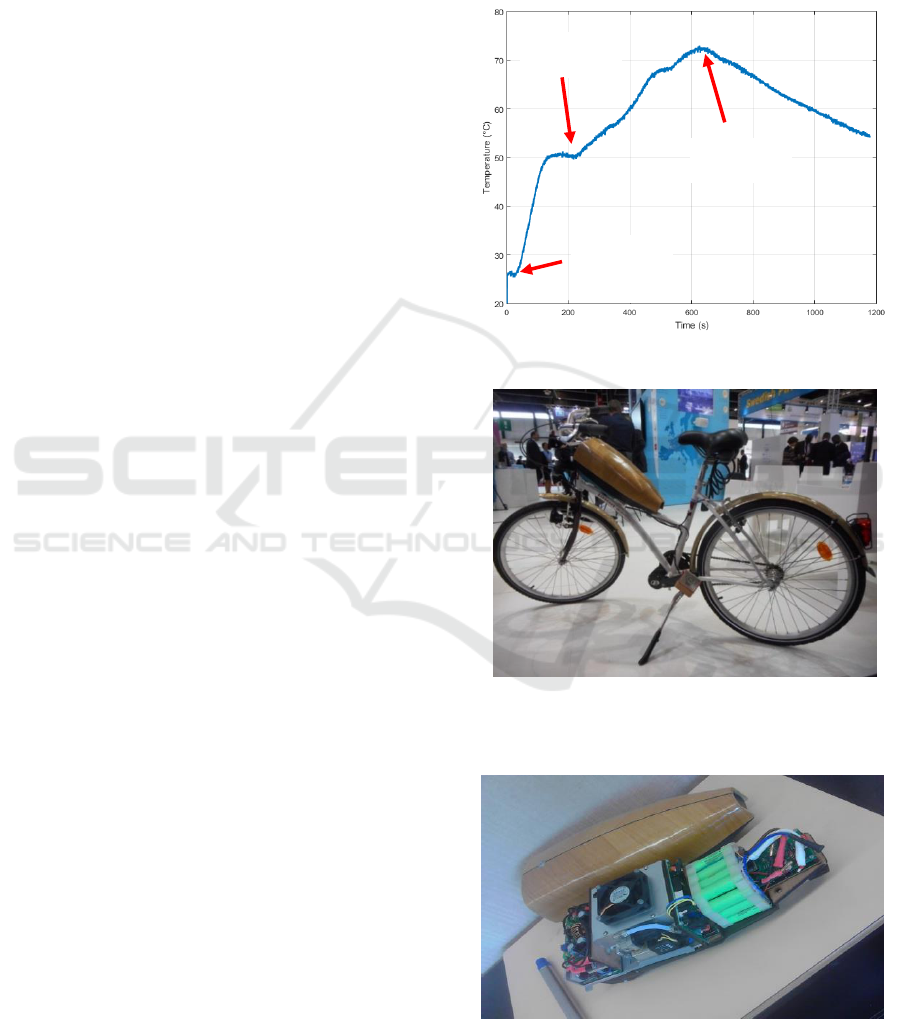
plots the reactor temperature variations.
These figures highlight that the pressure control loop
was started about 25 seconds after the beginning of
the test. The maximum voltage was then applied to
the pump leading to a fast increase of the pressure
inside the reactor (around 50 mbar/s). At time t =
100s, the reference pressure was reached and the
control voltage went back to 0. Without hydrogen
consumption, the pressure remained stable.
The fuel cell is started at time t = 190s. A strong
purge is created by the fuel cell management system
(see figure 11) leading to a pressure decrease inside
the reactor that is countered by the pressure closed
loop. For proper fuel cell operation, the system
generates purges and periodic short circuits (every 5
seconds alternately) that do not affect the pressure
control (on the time interval [200s – 280s]. On the
time interval [280s – 650s], a varying load is applied
to the fuel cell. When the load increases, hydrogen
consumption also increases (see figure 12).
ICINCO 2018 - 15th International Conference on Informatics in Control, Automation and Robotics
416
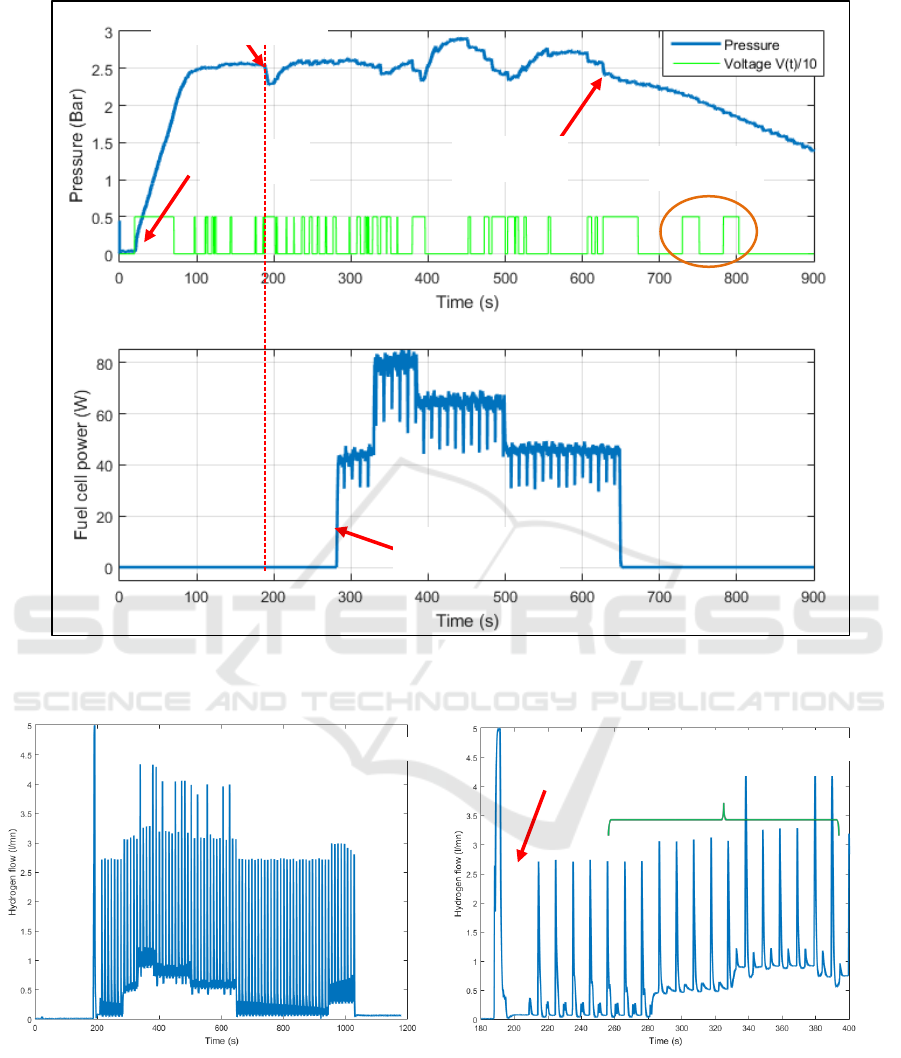
Figure 11: Pressure variation inside the reactor and control voltage applied to the pump (up), electrical power produced by
the fuel cell.
Figure 12: Hydrogen flow produced by the reactor during the test (a) and zoom on the beginning of the test (b).
However, the pressure remains stable, thus
demonstrating the efficiency of the pressure control
loop. When the load decreases (at time 380s and
500s), a kind of overshoot appears. This
phenomenon was assigned to an excess of water in
the reactor when the hydrogen demand falls sharply,
since the system and the control law do not allow
this water to be withdrawn.
At time 630s, the reactor temperature decreases
in spite of the pump control voltage being high. This
Control loop
start-up
End of the
reaction
Fuel cell start-up and
corresponding purge
Fuel cell
start-up
Periodic purges and
short circuits
Control
forcing
Load applied to the
fuel cell
(a)
(b)
A New Device for Hydrogen Production on Demand with Application to Electric Assist Bike: Description, Production Characteristics and
Basic Control
417
means that all the powder has been consumed. To
check it, the pump control voltage is forced at time
730s and 780s. As no pressure increase appears, this
confirms the end of the reaction. It should be pointed
out that the noisy power signal in figure 11 is the
result of purges and short circuits imposed on the
fuel cell. The reactor temperature evolution versus
time is shown by figure 13. The temperature remains
below 75°C and decreases when all the powder has
been consumed (this signal thus informs about the
end of the reaction).
5 REACTOR BEHAVIOUR IN
REAL OPERATION
Given the satisfactory behavior of the prototype, the
authors are currently mounting the prototype on the
electric bike shown in figure 14. This electric bike
was designed at the Bordeaux Institute of
Technology and presented at the 2015 Intelligent
Transport System ITS World Congress. It provides
an electric assistance proportional to the power
produced by the cyclist using pedals that capture the
pedaling effort. As shown by figure 15, the electric
power is provided by a kit mounted on the bike
which incorporates a 100 W fuel cell.
6 CONCLUSIONS
In this research work, a solution to produce
hydrogen on demand based on water hydrolysis
using magnesium was presented. It involves a
reactor whose internal pressure is adjusted by
controlling the hydrolysis reaction. Tests on a bench
fitted with a 100 W PEM fuel cell have
demonstrated the technological potential of this
solution for electric assistance applications in the
field of light mobility.
In this first phase of tests, the reactor was designed
to withstand a pressure of 25 bars, which makes it
rather cumbersome. The authors are thus working on
an improved, more ergonomic version, with more
sophisticated control solutions for a better pressure
control (overshoot suppression).
ACKNOWLEGMENTS
The authors acknowledge the AST society, the
Aquitaine SATT, for the funding of the prototype
presented in this paper in the form of the HELP
maturation project.
The authors also acknowledge the Bordeaux
Institute of Technology team who designed the
electric bike on which the reactor is currently
installed (Leyney and Sabatier, 2016) during a
project that was funded by Bordeaux city.
Figure 13: Temperature inside the reactor during the test.
Figure 14: Electrified Bordeaux city bike shown during
the 2015 Intelligent Transport System (ITS) World
Congress.
Figure 15: Fuel cell and control kit installed on the bike.
Fuel cell
start-up
Control
loop start-
up
End of the
reaction
ICINCO 2018 - 15th International Conference on Informatics in Control, Automation and Robotics
418

REFERENCES
Awad A. S., El-Asmar E, Tayeh T., Mauvy F., Nakhl M.,
Zakhour M., Bobet J. L. (2016), Effect of carbons (G
and CFs), TM (Ni, Fe and Al) and oxides (Nb2O5 and
V2O5) on hydrogen generation from ball milled Mg-
based hydrolysis reaction for fuel cell, Energy Vol 95,
pp 175-186.
Huang X, Gao T, Pan X, Wei D, Lv C, Qin L, et al., 2013,
A review: feasibility of hydrogen generation from the
reaction between aluminum and water for fuel cell
applications. J Power Sources, Vol 229, pp 133-40.
Huang JM, Ouyang LZ, Wen YJ, Wang H, Liu JW, Chen
ZL, et al. (2014), Improved hydrolysis properties of
Mg
3
RE hydrides alloyed with Ni. Int J Hydrogen
Energy Vol. 39, pp 6813-8.
Kojima Y, Kawai Y, Kimbara M, Nakanishi H,
Matsumoto S., 2004, Hydrogen generation by
hydrolysis reaction of lithium borohydride. Int J
Hydrogen Energy, Vol. 29, pp 1213-7.
Leyney M, Sabatier J., Conception d’un kit d’assistance
électrique pour la flotte des vélos de la ville de
Bordeaux en versions purement électrique et
hybridation à base de Pile à Hydrogène - GeSi Revue
des départements de Génie Electrique & Informatique
Industrielle n°88 (2016), p. 41-51.
http://www.gesi.asso.fr/images/revue/complet/GESI88
.pdf
Li F, Sun L, Zhao J, Xu F, Zhou H-Y, Zhang Q-M, et al.
(2013), Mechanisms of H2 generation for metal doped
Al16M (M¼Mg and Bi) clusters in water. Int J
Hydrogen Energy, Vol. 38, pp 6930-7.
Mauvy F., Bobet J. L., Sabatier J., Bos F. (2017), Matériau
à base de magnésium destiné à la production de
dihydrogène ou d'électricité, INPI Patent application
on October 6th, 2015 under the reference 1559,
published on April, 13th, 2017 ref WO2017060368 A1
Middleton R.H., Trade-offs in linear control system
design, Automatica, Vol. 27, pp 281-292, n° 2, 1991.
Muir SS, Yao X., 2011, Progress in sodium borohydride
as a hydrogen storage material: development of
hydrolysis catalysts and reaction systems. Int J
Hydrogen Energy Vol. 36, pp 5983-97.
Roullé J. M., Lorrillard J., 2012, Pour un renouveau de la
logistique urbaine, Note d'analyse 274,
http://archives.strategie.gouv.fr/cas/content/note-
danalyse-274-pour-un-renouveau-de-la-logistique-
urbaine.html.
Uesugi H, Sugiyama T, Nii H, Ito T, Nakatsugawa I.,
2011, Industrial production of MgH2 and its
application. J Alloy Compd, Vol. 509S, pp. 650-3.
Utkin V. I., 1993, Sliding Mode Control Design Principles
and Applications to Electric Drives, IEEE
Transactions on Industrial Electronics, Vol. 40, n°1,
pp 23–36.
A New Device for Hydrogen Production on Demand with Application to Electric Assist Bike: Description, Production Characteristics and
Basic Control
419
