
EFFECTS OF VARIABLE BIT RATE VOCODER ON VOIP QOS
Yael Dux-Rosenberg , Ariel J. Frank
Department of Computer Science, Bar-Ilan University, Ramat-Gan, 52900, Israel
Salomon Serfaty
R&D, Motorola Communications Israel Ltd, Tel-Aviv
Keywords: VoIP, QoS, LAN, WLAN, CRV, CVRV, vocoder
Abstract: Transmission of voice over packet switched networks, such as the Internet (VoIP), has been gradually
evolving due to the advantages it can provide to the different end-users (private user, integrated networks
service providers, business arena, etc). However, in order for VoIP to be commonly used, the Quality of
Service (QoS) offered by VoIP needs to be at least as high as the traditional Plain Old Telephone Service
(POTS).In this research, we aim to improve the QoS parameters of the developing VoIP technology by
substituting the traditional constant bit rate vocoder (CRV) with a new type of vocoder that is based on
continuously variable bit rate (CVRV). Comparative studies of these two vocoders are performed in the
following 3 independent scenarios:
1. LAN, in which the connected terminals transfer/receive voice only.
2. LAN, in which the terminals exchange mixed traffic classes of both voice and data.
3. WLAN, in which the connected terminals transfer/receive voice only.
The results of scenario 3 show a significant improvement in performance with use of CVRV in WLAN
when more than 50 terminals are involved, as exhibited in all the QoS parameters that were tested. The
results of the WLAN are especially interesting and significant as the WLAN is becoming progressively
more common nowadays.
1 INTRODUCTION
Voice has been traditionally transmitted using circuit
switched networks developed specifically for this
purpose while data has been transmitted on packet
data networks. The progress in communication
technology has brought about faster switches,
broader bandwidth and new horizons, such as the
integration of voice and data transmission on the
same digital network.
The mechanism used for transporting voice over an
IP based packet switched network is referred to as
Voice over Internet Protocol (VoIP). In order for
VoIP to be commonly used in the market, the
Quality of Service (QoS) offered by VoIP to the
users, needs to be as good as the traditional Plain
Old Telephony Service (POTS). QoS can be
measured and evaluated by the following individual
parameters: delay, jitter and packet loss.
2 GOALS
In this research, we analyse the performance of two
different vocoders that produce input traffic
(packets) at different rates. The Constant Rate
Vocoder (CRV) produces constant length packets
and the Continuously Variable Rate Vocoder
(CVRV) produces variable length ones. Since the
performance of statistical multiplexing is highly
dependent on input traffic, packets originating from
different modelled sources are expected to exhibit
individual performance results. Based on the above,
it is hypothesized that CVRV could outperform
CRV in terms of VoIP QoS parameters.
The article is organized as follows. Section 3
reviews the model requirements and the offline
simulation model is described in section 4. Section 5
gives the implementation, followed by its PME.
Lastly, conclusions and future directions are given.
93
Dux-Rosenberg Y., J. Frank A. and Serfaty S. (2004).
EFFECTS OF VARIABLE BIT RATE VOCODER ON VOIP QOS.
In Proceedings of the First International Conference on E-Business and Telecommunication Networks, pages 93-101
DOI: 10.5220/0001393300930101
Copyright
c
SciTePress

3 MODEL REQUIREMENTS
For this research, we require the following
environment characteristics for analysing CRV vs.
CVRV vocoders:
1. Connectivity – The environment needs
to support connectivity between any
number of terminals. The connection can be
between one terminal to another, one
terminal to many terminals or many
terminals to many terminals. The
communication between the connected
terminals can take place as terminals are
receiving data, transmitting or idle.
2. Data Transmission – The environment
needs to support transmission of the
different data types sent by the terminals
and/or the different accessories connected
to them. This input/output data includes
voice, data and multimedia.
3. Event Logging – In order to be able to
analyse the results, all events and processes
should be recordable so that a log file can
be generated.
4 OFFLINE SIMULATION MODEL
This research experiments were carried out on a
simulated network using NS (a Network Simulator)
and additional scripts, so as to achieve the above
requirements. The architecture used, in reference to
the 7-layer OSI model, includes the following layers
(as shown in Figure 1).
4.1 Application Layer
The Application layer supplies the different types of
information: voice and data, which are transferred
by the terminals through the network. The voice
packets are produced by the two different vocoders,
CRV and CVRV, using the same recorded
conversation.
The Continuously Variable Rate Vocoder
(CVRV) is the new vocoder type used in this
research that has the following properties:
‘Continuously’
, i.e., packets are produced at a
constant rate (every 64ms).
‘Variable Rate’
, i.e., the packet length produced
is variable with the subsequent variable rate (with
average length of 82B).
The Constant Rate Vocoder (CRV) is the
traditional vocoder:
‘Constant Rate’
, i.e., packet length is constant
and produced at constant rate. This vocoder
produces packets at a constant length of 82B every
64ms.
The data packets that the terminals transmit are
assumed to originate in an FTP application that is
used as data source for the data terminals.
Figure 1: CRV/CVRV Architecture Reference Model
ICETE 2004 - WIRELESS COMMUNICATION SYSTEMS AND NETWORKS
94
4.2 Transport Layer
The Transport layer supplies the end-to-end
connectivity by utilizing TCP for terminals
transmitting data and UDP for terminals transmitting
voice.
4.3 Network Layer
The Network layer supplies the connectivity
between hosts. IP is utilized for voice and data
terminals.
4.4 Data link layer and Physical layer
The Data Link and Physical layers are responsible
for moving data to/from the physical link. A LAN or
WLAN are used for this purpose.
4.5 Analysis Module
The purpose of the Analysis module is to produce
the VoIP QoS values, which are delay, jitter and
packet loss, for all test cases derived from the NS
log files. Another parameter that is tested is the
"application packet loss". The application packet
loss parameter measures the percentage of packets
that do not arrive at the destination in their relevant
time frame. These packets become “irrelevant” and
are dropped by the application. Results for this
parameter are calculated repeatedly, for increasing
delays in the play-out buffer.
The delay, jitter, packet loss and application
packet loss, are then used as basic measures for
assessment of the vocoder behaviour.
5 IMPLEMENTATION
The implementation is used for experimentation
with three different scenarios, in which information
(voice or voice+data) is exchanged between
terminals. Each scenario tests the effects of CVRV
on VoIP QoS by checking various network
parameters. The there scenarios include the
following environments: 1) voice traffic over LAN,
2) voice and data traffic over LAN, and 3) voice
traffic over WLAN. Each of these tests is performed
repeatedly with an increasing number of
participating terminals, in order to study the effect of
increasing load on the network.
In the aforesaid experiments, the following
characteristics are studied:
1. Performance of CVRV vs. CRV in the different
scenarios.
2. Influence of the network load on the
performance of each individual test case.
3. Significance of the results as tested by the
repeated runs.
6 PERFORMANCE
MEASUREMENTS
EVALUATION
Here we describe the three scenarios (numbered 1-3)
and their results when comparing CRV and CVRV
vocoders.
6.1 Voice Traffic over LAN
In this Scenario 1, the comparison of CRV and
CVRV is done on a LAN network (802.3 IEEE),
with voice traffic only. Isolating the traffic to voice
packets enables investigation of the behavior of the
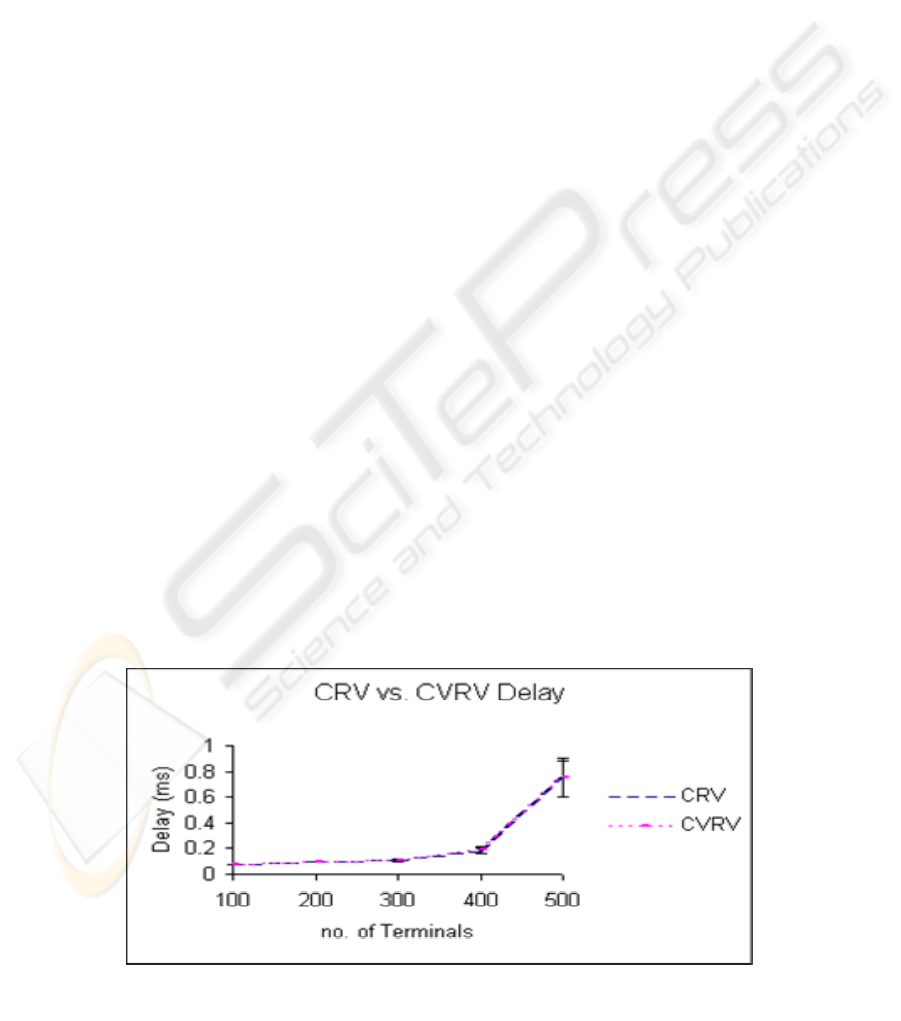
Figure 2: Delay Results
EFFECTS OF VARIABLE BIT RATE VOCODER ON VOIP QOS
95

two vocoders, while modelling the difference
between them.
The scenario is repeatedly tested with an
increasing number of participating terminals,
starting with 100 terminals and going up to 500
terminals (limited by the LAN's steady state, which
is when it's at maximum capacity).
Following we detail the results of the QoS
parameters for this test case.
6.1.1 Delay
The results shown in Figure 2 show that as the
number of terminals increase from one test case to
another, there are more terminals ready to transmit,
and the delay and jitter grow respectively.
6.1.2 Jitter
The jitter increases as the number of packets ready
to be transmitted increase, due to more terminals
participating in the test case. It should be noted that
when only 100 terminals are connected to the LAN,
the jitter is 0. This means that the network transmits
the packets as soon as they are ready to be
transmitted; there is no queue delay.
6.1.3 Packet Loss
None of the test cases in this scenario suffer from
network packet loss. All the transmitted packets
reach their destination.
6.1.4 Application Packet Loss
As seen, no significant difference was found in the
behaviour of CRV and CVRV comparing the delay,
jitter and packet loss results.
However, this isn't true for application packet
loss. Figure 3 shows the results for a test case with
300 terminals. The results of the application packet
loss parameters where at the same level for 100, 200,
400 and 500 terminals as well.
The above results show that in this studied
experiment, as the play-out buffer delay increases,
more packets arrive at the destination in their
relevant time frame, enabling them to be played out
rather than dropped.
It can also be seen in the results that in the range
of 0-50µs, CVRV loses significantly more packets in
comparison to CRV. It is a gap of 37%, 41%, 32%,
35%, 15% at 0µs for 100, 200, 300, 400, 500
terminals, respectively. In the range of 50-250µs, the
packet loss does not differ significantly between the
two vocoders.
In the experiment described in Figure 3, it is
seen that in CVRV vs. CRV test cases, more packets
are also lost when the play-out buffer adds a relative
small delay (0-50us). Furthermore, it should be
noted that the percentage of long packets lost (for
100, 200, 300, 400 and 500 terminals, respectively)
exceeds their prevalence (58%) in the overall packet
population.
6.1.5 Summary and Discussion
In this Scenario 1, it was demonstrated that there is
no substantial difference in the delay and jitter
results of the two vocoders. The behavior of delay
and jitter under these circumstances shows an
exponential trend line that is in agreement with the
literature. The low linear phase in the range of 100-
400 terminals, followed by the exponential growth
between 400 to 500 terminals, corresponds to the
upper limit or saturation of the LAN's load. 600
terminals are out of the testing range.
In this scenario, no network packet loss was
found in the vocoders.
The main difference between the two vocoders
Figure 3: Application Packet Loss Results
ICETE 2004 - WIRELESS COMMUNICATION SYSTEMS AND NETWORKS
96
in this scenario is in the results of the application
packet loss parameter.
In this scenario, CVRV shows a bigger
application packet loss than CRV in the range of
0-50µs (delay added by the play-out buffer). In this
range, test cases utilizing CVRV lose more packets
than the corresponding test cases using CRV.
It turns out that this phenomenon is due to the
length of the packets. Longer packets travel for a
longer time to the destination in comparison to
shorter ones. This network delay adds to the overall
delay of the packet. For delays longer than 50µs,
there is no difference between the two vocoders.
This is explained by the non-significant contribution
of the network delay when added up to the actual
delay, on top of the play-out buffer.
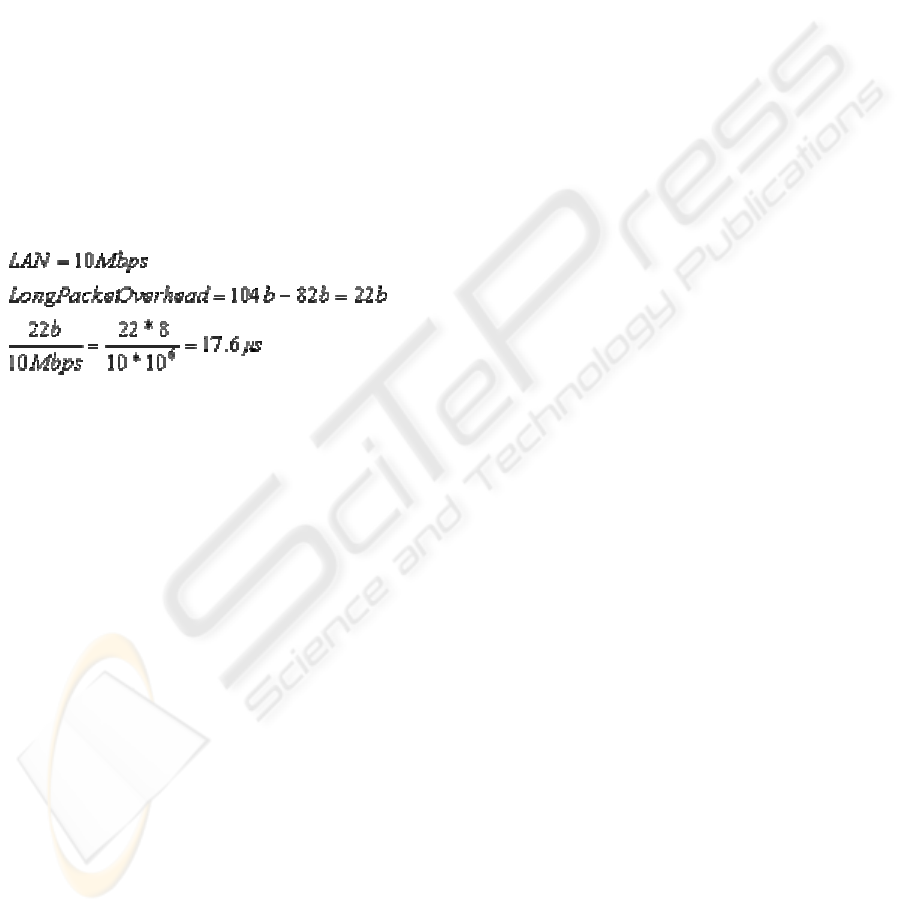
For demonstration: the length of an average
packet is 82B, the length of the longest packet is
104B, therefore the overhead in travel time for
packets longer than the average would be maximum
17.6µs, as per the following calculation:
When these 17.6µs of delay are added on top of
the 0-50µs delay of the play-out buffer, the addition
of the packet length is significant and influences the
results of the total application packet loss parameter.
The results for the application packet loss
parameter show that for the test case of 500
terminals, the difference in the performance of CRV
and CVRV is less significant compared to the other
test cases (100-400). This is explained by the fact
that the test case with 500 terminals suffered from a
much longer delay and jitter relatively to 100-400
terminals. This causes the effect of the network
delay (caused by packet length) to be less significant
(Queue Delay >> Network Delay), affecting less the
difference in packet loss.
According to the above, when the play-out
buffer for CVRV is designed for the receiver’s end,
the delay added will be according to the maximum’s
packet length, rather than the average packet length,
as in CRV. In order to achieve the same packet loss
rate in CVRV and CRV, the delay added in the play-
out buffer of CVRV will need to be longer,
increasing the total delay time of the packets.
6.2 Voice+Data Traffic over LAN
The scenario of only voice traffic is an isolated case.
The more common situation is a LAN where both
voice and data are transmitted. Scenario 2 that is
investigated here is designed to support both voice
and data traffic. The ratio of voice vs. data terminals
is 1:1. Every data terminal has a ready packet to be
transmitted. The voice terminals perform according
to the pre-designation of CRV and CVRV vocoder,
respectively. The measurements and statistical
studies are applied to the voice packets only. The
scenario is carried out repeatedly with an increasing
number of terminals.
Following we detail the results of the QoS
parameters for this test case.
6.2.1 Delay, Jitter, Packet Loss and
Application Packet Loss
The results for delay, jitter, packet loss and
application packet loss show that when both voice
and data are supplied to CRV and CVRV vocoders,
no significant difference is manifested by the two
vocoder types. These parameters: delay, jitter and
packet loss, increase correspondingly to the number
of added terminals.
6.2.2 Summary and Discussion
In this scenario, of transmission of voice and data,
we have seen no significant difference between the
two vocoders. This is explained below.
The comparison between the vocoders was
designed in such a way that the surrounding
environment and its features are as close as possible.
In this scenario that mixes voice and data, the only
difference between CRV/CVRV test cases is the
length of the voice packets. The data packets are
always ready to be transmitted and a voice packet is
ready every 64ms. Consequently, the packets are
transmitted at the exact same times in both vocoders.
According to the behaviour of the LAN, when
the medium is free, a packet is transmitted.
Collisions occur only when more than one terminal
senses the medium as free, and transmits a packet.
The packets transmitted from multiple terminals
simultaneously collide and will need to be
retransmitted. It takes the transmitting terminal a
constant period of time to notice that the packet it
has sent is corrupted due to collision (twice the
propagation time). According to the test case setup,
the packets in CRV and CVRV scenarios are sent at
the same time, and the collisions occur at the same
times, respectively. The identification, in a constant
time, of a collision eliminates the difference between
the voice packet lengths, controlling the scenario
EFFECTS OF VARIABLE BIT RATE VOCODER ON VOIP QOS
97

results and maintaining the uniformity in the two
vocoders test cases.
However, a comparison between Scenario 1 and
Scenario 2 shows a remarkable difference in the
delay and jitter value's range of the two scenarios
(0-1ms for Scenario 1 and 19-110ms for Scenario 2),
whereas the performance of the two vocoders in
delay and jitter is similar. This is explained by the
presence of the data packets in Scenario 2, while
Scenario 1 was designed for voice packets only.
There is a substantial difference between the
following two inputs:
1. Data packets are significantly
longer than the voice packets
(500B vs. 82B average).
2. Data packets are always ready
to be sent (rather than every
64ms as in voice).
These two different characteristics result in a
longer queuing of voice packets waiting for the
channel to be idle. As an outcome, the delay and
jitter in Scenario 2 are in the range of tens of ms
rather than µs, as in Scenario 1.
Comparing the application packet loss parameter
results of the two scenarios shows that this
parameter behaves in a different manner than the
delay and jitter ones. The application packet loss is
significantly higher in CVRV than in CRV in
Scenario 1, whereas in Scenario 2, the application
packet loss is similar in both vocoders. The
explanation for this finding is as follows. The values
of the play-out buffer parameter in Scenario 1 are an
outcome of the unfavorable long packets, as it takes
them a longer time to reach the destination. This
phenomenon did not show in Scenario 2, because the
queue delay was much longer than the travel time
and therefore the delay added by the play-out buffer
was in the same magnitude as the queue delay and
not in the range of the network travel time. This
eliminated all the differences between short vs. long
packets.
In summary, the results of the VoIP QoS
parameters of the two vocoders were not
significantly different in spite of the fact that such a
difference was expected based on the statistical
multiplexing analysis. According to the results of
Scenario 2, CVRV did not perform better than CRV.
This is explained by the fact that in both vocoders,
the voice packets were ready to be transmitted every
64ms. Even though CVRV produces packets in
variable lengths, this variety in the length was not
significant enough to achieve the expected improved
behavior of VBR modelled traffic for this vocoder.
6.3 Voice Traffic over WLAN
In Scenario 3, the comparison of CRV and CVRV is
done on a WLAN network (802.11 IEEE), with
voice traffic only. This scenario simulates an ad-hoc
environment, where all terminals can "hear" each
other. Limiting the traffic to voice packets enables
investigating the behavior of the vocoders, and
studying the difference between them.
In the previous scenarios, it was shown that the
results of the tested parameters depend on the
investigated medium. In this scenario, we use the
same test case but on a different medium. We look at
the behavior of the vocoders in order to evaluate the
results by the QoS parameters. The scenario is
carried out repeatedly with an increasing number of
terminals.
Following are the results of the QoS parameters
for this test case.
6.3.1 Delay, Jitter and Packet Loss
The results for 20 and 50 terminals show no
significant difference in the performance of CRV
and CVRV. However, the test case of 80 terminals
shows a significant difference in the delay, jitter and
Figure 4: Delay Results
ICETE 2004 - WIRELESS COMMUNICATION SYSTEMS AND NETWORKS
98
packet loss between the two vocoders. See Figure 4
for delay results.
6.3.2 Application Packet Loss
The test case of 20 and 50 terminals are not subject
to any application packet loss. In the case of 80
terminals, where application packet loss occurs,
there is no difference in results of the two vocoders.
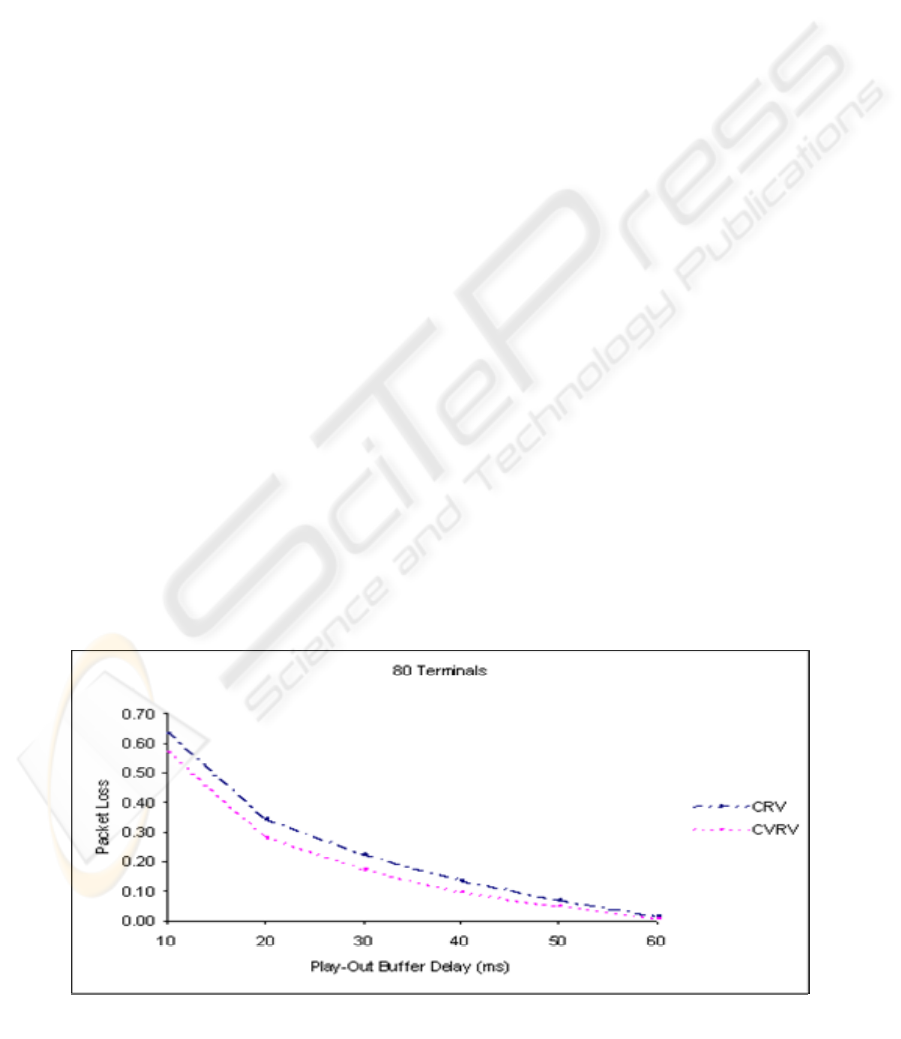
6.3.3 Results for Collided Packets
The statistical analysis of the WLAN voice only
terminals shows that there is a significant difference
in the performance of CRV vs. CVRV above the
range of 50 terminals. This subsection analyses the
behavior of packets that experienced collision and
retransmission. In this scenario, the prevalence of
collisions, in the incrementing terminal numbers,
increases. In the test case of 20 terminals, there are
no packet collisions, whereas with 50 terminals the
number of packet collisions which is about 1.8% of
the test case packets, and in the test case of 80
terminals, the results is 8.5% of the total packets.
The number of collisions in the test case of 50
terminals is low (and does not affect the results of
delay and jitter). Therefore the analysis is done only
on the test case of 80 terminals where the percentage
of collisions is high and statistically significant.
Figure 5, shows the difference in the
performance of CVRV vs. CRV where the collided
packets are isolated and packet loss is monitored.
As shown, for up to 60ms delay, the
performance of CVRV is better than that of CRV.
CRV looses 7%, 7%, 4%, 4% and 2% more packets
than CVRV for 10, 20, 30, 40 and 50 ms,
respectively.
The experiment described in Figure 6 analyses
the prevalence (in %) of the packets that were
subject to collisions and retransmission.
The packets that have collided 1-7 times are
analyzed exclusively, i.e., the packets that have
collided for 7 times are not included in the column
describing 6, 5, 4, 3, 2 and 1 collisions. The integral
collided packets would be the sum of columns
1+2+…+7 (100%).
Comparison of the number of collisions that
occur in CRV vs. CVRV shows the following:
1. Packets that collided only once are
found in higher prevalence in
CVRV than in CRV – 78.61% vs.
73.86%.
2. Packets that collided more than
once are more prevalent in CRV
than in CVRV (17.22% vs.
14.77% for 2 collisions, 6.03% vs.
4.21% for 3 collisions, 1.86% vs.
1.75% for 4 collisions, 0.70% vs.
0.61% for 5 collisions, and 0.25%
vs. 0.07% for 6 collisions).
3. Packets that collided 7 times are
only present in CRV and not found
in CVRV at all (0.12% vs. 0.00%).
The results show a distinctive superiority of
CVRV over CRV in this scenario. The root cause for
this is explained as follows. Multiple collisions
affect the two vocoders in different magnitudes. In
CVRV, more packets of a single collision are found
than in CRV, indicating that it handled better the
retransmission timing. A packet that has not reached
its destination will be retransmitted until success, up
to 7 times. The fact that there are more packets of
single transmission in CVRV, on account of
multiple retransmissions, shows a better
performance than CRV.
Also, at the other end of the scale – CVRV
performed better than CRV, as manifested by the
fact that the packet transmission is completed by a
Figure 5: Application Packet Loss Results for Collided Packets
EFFECTS OF VARIABLE BIT RATE VOCODER ON VOIP QOS
99

maximum of 6 retransmissions. CRV reached as
much as 7 retransmissions and was cut off by the
Mac sublayer that is limited to a maximum of 7
retransmissions.
It is suggested that the superior performance of
CVRV is due to the following characteristic in the
WLAN’s network access protocol. In a WLAN
operating with CSMA/CA protocol, the transmitting
terminal concludes that the packet was not received
by the destination, when the ACK packet does not
arrive within its expected time frame. This time
depends on the length of the packet. CVRV packets
are variable length, inserting more randomness into
retransmission compared to what the constant length
packets of CRV enable. This randomness in
retransmission produces the better scheduling of
retransmissions for CVRV.
The outcome of the aforesaid observation for
collided packets (i.e., that each packet in CRV has
been subject to more collisions than the individual
packet in CVRV) is that the delay and jitter of CRV
is bigger than that of CVRV. The difference is
picked up by the QoS parameters of the full scenario
of the transmission on the WLAN, providing a more
favorable service by CVRV.
6.3.4 Summary and Discussion
The results of delay, jitter and packet loss of the
vocoders in Scenario 3 show that the two vocoders
differ significantly in the case of 80 terminals. In all
the parameters, CVRV performs better than CRV,
whereas in the range of up to 50 terminals there is no
difference between the two vocoders.
The difference in the performance of the vocoders
in the higher range of terminals is attributed to the
number of packet collisions when the scenario’s load
is high. The high number of collisions is a “time
consuming” event that influences not only the delay
of the collided packet, but also the jitter, and this is
picked up by the QoS parameters of the entire test
case.
These results are expected to be more prominent
in the WLAN "real world" rather than in a simulator,
since in the simulator the only cause for
retransmissions is when multiple terminals start to
transmit simultaneously, causing the packets to
collide in the "air". In the real world of Wireless and
WLAN in particular, there are additional relevant
attributes, such as: surrounding noises that interrupt
the transmission, the signal is not strong enough, it is
interfered by other devices, etc. These real world
effects can cause the network to have much more
corrupted packets resulting in more packets that need
to be retransmitted. All these are expected to intensify
the advantage of CVRV over CRV in a WLAN.
Generalizing the behavior of CRV/CVRV over
the WLAN shows that the WLAN is not tuned to
work with CBR traffic. The synchronization of the
CBR packets reduces the WLAN effectiveness in
comparison to the VBR traffic. It turns out that the
network access control protocol of WLAN
(CSMA/CA) behaves better with VBR traffic.
7 CONCLUSIONS AND FUTURE
DIRECTIONS
Scenario 1 tested the difference in the performance
of CRV/CVRV of voice traffic only on a LAN. The
results of this scenario show a difference in the
application packet loss parameter. The difference in
the results is in the time magnitude of about 1ms,
explained by the influence of the packet length. But,
as the delay of VoIP measures up to hundreds of ms
Figure 6: Collisions
ICETE 2004 - WIRELESS COMMUNICATION SYSTEMS AND NETWORKS
100

this difference is noteworthy on theoretical grounds
only. In practice, when testing the VoIP QoS
parameters from the users' point of view, a 1ms
difference has no net effect.
Scenario 2 tested the difference in the
performance of CRV/CVRV of voice and data
traffic on a LAN. The results of this experiment
showed similar behavior in terms of VoIP QoS
parameters of the two tested vocoders, explained by
the statistical multiplexing analysis.
Scenario 3 tested the difference in the
performance of CRV/CVRV of voice traffic only on
a WLAN. The results of this experiment showed
significant difference in the delay and jitter results
for above than 50 terminals participating in the test
case, explained by the WLAN network access
protocol. Generalizing the behavior of CRV/CVRV
over WLAN, it is more effective to utilize traffic
from a VBR source than from a CBR source.
The results of WLAN are especially interesting
and significant as the WLAN is becoming
progressively more common nowadays. We
anticipate that the research results will prove to be
even more prominent in the real world than they
were in the simulated environment. We consider
here two possible future research directions.
First, as most of the vocoders currently used are
constant rate vocoders and the effect of constant
length packets on WLAN causes more collisions,
we suggest to test the WLAN with a different access
method, other than CSMA/CA, to alleviate the
effect of the constant length packet’s collisions due
to their synchronization.
Second, this research shows that the VoIP QoS
depends on the network utilized. LAN terminals
detect that collisions occurred for a transmitted
packet in a constant time whereas WLAN terminals
detect the collision after a period that depends on
the data packet's length. This difference, in the
network access protocol (CSMA/CD for LAN and
CSMA/CA for WLAN), is the root cause of the
difference between the vocoders. Therefore, for
possible further improvement of the VoIP QoS, we
suggest to look into additional networks with
different access methods, such as pure CSMA or
Aloha, which might have an additional positive
influence on the performance of CVRV.
In practice, from the point of view of the end-
user considering the QoS parameters, it was shown
that CVRV is superior to CRV in the WLAN
scenario and performs as well as CRV in the LAN
scenarios. It is thus concluded that this newly
designed vocoder, CVRV, would be the best choice
for the end-user.
REFERENCES
Cuenca P., B. Caminero and L. O. Barbosa, QoS and
Statistical Multiplexing Performance of VBR MPEG-2
Video Sources over ATM networks, School of
Information & Engineering Univ. Ottawa, IEEE, 1998.
F. Halsall, Data Communications, Computer Networks
and Open Systems, Addison-Wesley, Fourth edition,
280-285, 335-338, 1996.
U. Black, Voice over IP, Prentice-Hall, 73-74, 221, 1999.
D. Minoli and E. Minoli, Delivering Voice over IP
Networks, John Wiley & Sons, 152-154, 1998.
W. Stallings, Data and Computer Communication,
Macmillan Publishing Company, Fourth edition, 460-
462, 578-596, 1994.
A. S. Tanenbaum, Computer Networks, Prentice Hall,
Fourth edition, 2002.
NS simulator, URL: http://www.isi.edu/nsnam/ns/
A. Estepa and J. Vozmediano, Summary of Parameters
Affecting QoS in Voice over Packet Networks,
Upgrade Vol. 2, No. 3, 2001.
A. Kansal and A. Karandikar, Jitter-free Audio Playout
over Best Effort Packet Networks, ATM Interact
Symposium, ATM Forum 2001.
J. F. Kurose, K W. Ross, Computer Networking: A Top-
Down Approach Featuring the Internet, Addison-
Wesley , Third edition, 2005
EFFECTS OF VARIABLE BIT RATE VOCODER ON VOIP QOS
101
