
Automatic Classification of Spinal Deformity by using
Four Symmetrical Features on the Moire Images
Hyoungseop Kim
1
, Satoshi Nakano
1
, Joo Kooi Tan
1
, Seiji Ishikawa
1
Yoshinori Otsuka
2
, Hisashi Shimizu
3
and Takashi Shinomiya
4
1
Department of Control Engineering, Kyushu Institute of Technology
1-1, Sensui-cho, Tobata, Kitakyushu, Japan
2
National Sanatorium Chiba Higashi Hospital, Japan
3
Chiba Foundation for Health Promotion & Disease Prevention, Japan
4
Nikon Co. LTD., Japan
Abstract. Spinal deformity is a disease mainly suffered by teenagers during
their growth stage particularly from element school to middle school. There are
many different causes of abnormal spinal curves, but all of them are unknown.
The most common type is termed “idiopathic” that show 80% of the spinal de-
formity. Spinal deformity is a serious disease, mainly suffered by teenagers, es-
pecially girl’s student, during their growth stage.To find the spinal deformity in
early stage, orthopedists have traditionally performed on children a painless ex-
amination called a forward bending test in mass screening of school. But this
test is neither objective nor reproductive, and the inspection takes much time
when applied to medical examination in schools. To solve this problem, a
moire method has been proposed which takes moire topographic images of hu-
man subject backs and checks symmetry/asymmetry of the moire patterns in a
two-dimensional way. In this paper, we propose a method for automatic classi-
fication of spinal deformity from moire topographic images by extracting four
symmetrical features of the left-hand and right-hand side on the moire image.
Feature of asymmetry degrees are applied to train employing the classifier such
as Artificial Neural Network, Support Vector Machine, Self-Organization Map
and AdaBoost.
1 Introduction
Spinal deformity is one of the serious diseases, mainly suffered by teenagers. It is
tends to run in families and is more common in females than males during their
growth stage. There are many different causes of spinal deformity such as congenital,
kyphosis (curvature of the spine with the convexity pointing toward the back), but in
the vast majority of cases there is no known cause. Although the spine does curve
from front to back side it should not curve lateral. A side-to-side called scoliosis and
it may take the shape of an ‘S’ or ‘C’ character. The difficulty because of not accom-
panied by the subjective symptom such as pains the early stage detect and the early
treatment becomes a problem. When one suffers from a spinal deformity, in severe
Kim H., Nakano S., Kooi Tan J., Ishikawa S., Otsuka Y., Shimizu H. and Shinomiya T. (2007).
Automatic Classification of Spinal Deformity by using Four Symmetrical Features on the Moire Images.
In Proceedings of the 3rd International Workshop on Artificial Neural Networks and Intelligent Information Processing, pages 99-106
DOI: 10.5220/0001623100990106
Copyright
c
SciTePress

case, it is associated with pain and it requires surgical treatment. The treatment of
spinal deformity depends on the location and degree of curvature. Slight curves usu-
ally require no treatment, but as the curve progresses the treatment is required be-
cause the size of chest cavity diminish, it causes pain and decrease in lung.
To find the spinal deformity in early stage, orthopedists have traditionally per-
formed a painless examination which called the forward bending test in mass screen-
ing of school. In the forward bending test, mainly medical doctor checks 5 points
such as rib hump, lumbar hump, and asymmetric degree on the shoulder and west
line. But this test is neither objective nor reproductive, and the inspection takes much
time when applied to medical examination in school screening. To solve such various
problems, a moire method [1-2] has been proposed which takes moire topographic
images of human subject backs and checks symmetry/asymmetry of the moire pat-
terns in a two-dimensional way. The moire topographic image represented stripe
pattern as one of the three dimension information. Moire stripes appear as symmetry
the subject is classified as normal.
By using the moire image, the diagnosis efficiency of spinal deformity in the mass
screening improved. However, the burden of the doctor who diagnoses a large
amount of moire image is still remained. Then, the necessity of the image diagnosis
support by using a computer is requested from the medical site. To detect the spinal
deformity, some algorithms are proposed [3-4]. In this paper, we propose a technique
for automatic classification of spinal deformity from moire topographic images by
extracting four symmetrical features of the left-hand and right-hand side on the moire
image. In the first step, once the original moire images is fed into computer, the mid-
dle line of the subject’s back is extracted on the moire image employing the approxi-
mate symmetry analysis[5]. Regions of interest (ROIs) are automatically selected on
the moire image from its upper part to the lower part and the middle line of the sub-
ject’s back. Then the four asymmetry degrees are calculated from obtained ROIs.
Numerical representation of the degree of asymmetry, displacement of local centroids
and difference of gray value, are calculated between the right-hand side and the left-
hand side regions of the moire images with respect to the extracted middle line. Fea-
ture of four asymmetry degrees (mean value and standard deviation from the each
displacement) from the right-hand side and left-hand side rectangle areas apply to
train the Artificial Neural Network (ANN), Support Vector Machine (SVM), Self-
Organization Map (SOM) and AdaBoost.
2 Extraction of the Middle Line
Moire photography uses light projected through a grid and then photographed to
record the 3-D shape of the subject’s back. Generally, the moire stripes show sym-
metric patterns on the normal subject’s backs. But when one becomes spinal deform-
ity, an asymmetric moire pattern appears on the moire image of the subject’s back. In
the diagnostic of imaging by using the moire method, asymmetry degree are evalu-
ated on the moire images, so it is effective to make the asymmetry degree on the
moire image in the visual screening.
100

To analyze the asymmetric of moire pattern, the middle line is extracted based on
approximately symmetry analysis technique [5]. The approximate symmetric axis can
be found by superposing the original and the reflected original image (mirror image).
The best position of the superposing is determined, by evaluating the difference im-
age which is overlapped the original and the mirror image. We adjusted to the posi-
tion in which the difference of the density of a pixel values are minimized. The ap-
proximate symmetric axis is represented by the perpendicular bisector of the center of
gravity of the original and the mirror image.
We assume an original moire image is f(x,y),(x,y)∈ R, and its reflected image is
represented by f
r
(x,y) ,(x,y)
∈
R
r
. The f
r
(x,y) is superposed onto the f(x,y) by parallel
translation c=(c
x
,c
y
), T is a rotation transform and rotation
θ
to find the best match in
eq.(1). In this paper, we assume that
θ
=0 in eq.(2), because the moire images are
captured normally straight using position-supporter so that their middle lines remain
vertical.
∑
∪∈
−=
r
RRyx
T
axis
yxTfyxfD
),(
'
),(),(min
(1)
⎟
⎟
⎟
⎠
⎞
⎜
⎜
⎜
⎝
⎛
−=
100
cossin
sincos
y
x
c
c
T
θθ
θθ
(2)
3 Extraction the Four Asymmetrical Features on the ROIs
The ROIs are selected by using pre-processing technique, the asymmetrical features
are calculated by the following way.
Within the region R and at a certain position y=j, two rectangle areas are defined,
as shown in Fig.1, at symmetric locations with respect to the middle line x=m. The
width R
x
of the rectangle area is defined by,
),min( mrlmR
x
−
−
= . (3)
Here m is the middle line which is extracted above mentioned, l is minimum fre-
quency of the left-hand side r is minimum frequency of the right-hand side on the
histogram. On the other hand, height of the area is defined empirically.
Let us denote the rectangle areas of the left-hand side and right-hand side at y=i by
A
i
l
and A
i
r
, respectively. Here i=1,2,…,N. The centroids of A
i
l
and A
i
r
are denoted by
G
l
(x
l
,y
l
) and G
r
(x
r
,y
r
), respectively. The centroid G
l
(x
l
,y
l
) is reflected with respect to
the middle line x=m into the region A
i
r
and denoted by G
l
*
(x
l
*
,y
l
*
). The distance G
between G’
l
(x’
l
,y’
l
) and G
r
(x
r
,y
r
) is calculated by,
()()
22
rlrl
yyxxE −
′
+−
′
= (4)
The mean
E
μ
and standard deviation
E
σ
of the values E (i=1,2,…,N) are em-
ployed as the features representing the degree of asymmetry of the moire image in
calculation rectangle area. The expressions are shown as follows.
101
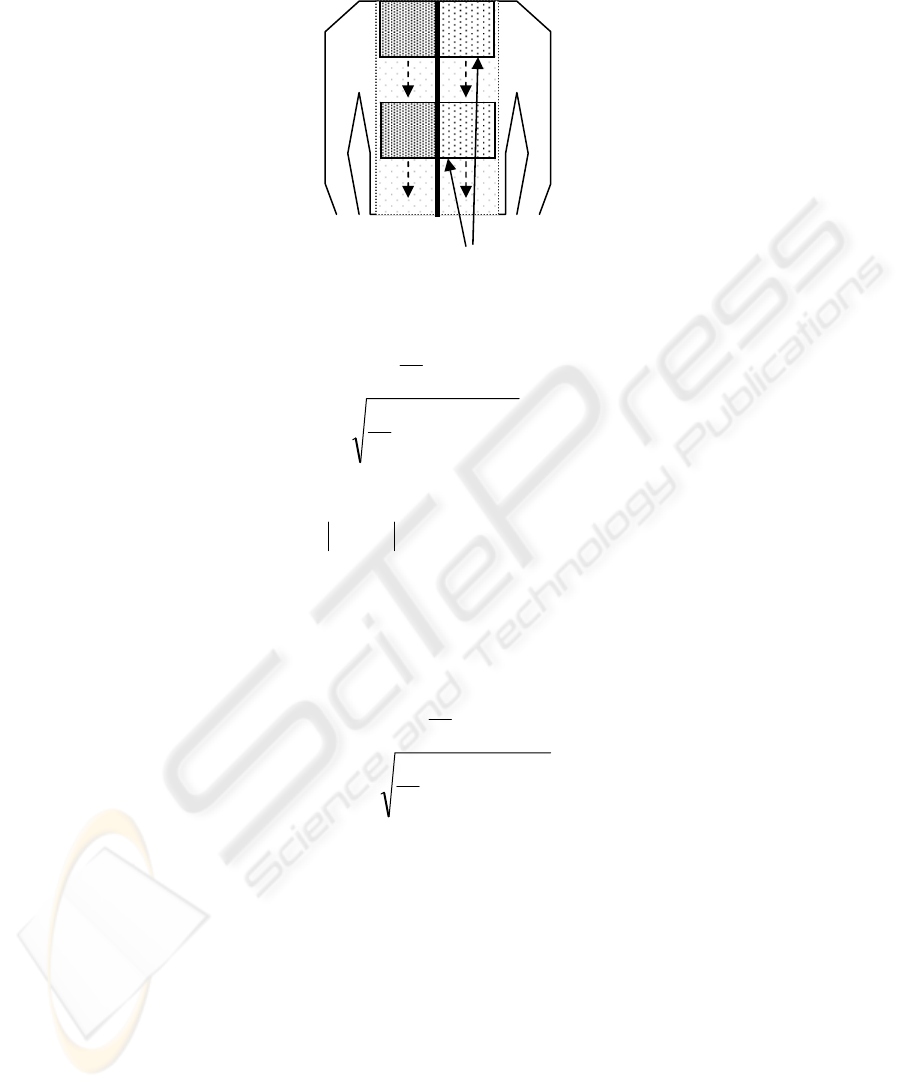
Fig. 1. Rectangle areas in the region of interest.
()
⎪
⎪
⎩
⎪
⎪
⎨
⎧
−=
=
∑
∑
=
=
N
i
EE
N
i
E
E
N
E
N
1
2
1
1
1
μσ
μ
(5)
Furthermore, in the same rectangle area, the difference of gray value D is calcu-
lated by,
dd
lrD −=
(6)
Here, r
d
and l
d
are shown the mean value of the gray value on the right-hand and left-
hand side in the ROIs, respectively. The mean
D
μ
and standard deviation
D
σ
of the
difference of gray values D (i=1,2,…,N) are employed as the features representing the
degree of asymmetry of the moire image in calculation rectangle area. The expres-
sions are shown as follows.
()
⎪
⎪
⎩
⎪
⎪
⎨
⎧
−=
=
∑
∑
=
=
N
i
DD
N
i
D
D
N
D
N
1
2
1
1
1
μσ
μ
(7)
4 Classification Methods
The mean value and the standard deviation of the difference of the center of gravity
and difference of gray value on the right-hand and left-hand side area are obtained as
the feature, respectively. To classify the unknown moire image, we have tried the
ANN, SVM, SOM and AdaBoost techniques employing four asymmetrical features.
ANN is used a useful technique for the pattern classification. This technique pro-
vided a method for the automatic spinal deformity. It is necessary for input layers,
RO
I
l
r
m
102

which extracted numerical feature. To classifying the unknown moire image, the four
features (mean values and standard deviation in eq.(5), (7)) are used for training by
using the back propagation in ANN. Our ANN is consist of three layers, which in-
clude four inputs neurons, three hidden neurons and two output neurons for training.
Finally, unknown moire images are discriminated as normal or abnormal case auto-
matically.
A SVM [6, 7] is a supervised learning technique from the field of machine learning
applicable to both classification and regression. SVM is a set of related supervised
learning methods used for classification. It is an optimization algorithm for the prob-
lem of pattern recognition. Some free software also provided methods for assessing
the generalization performance efficiently. It was worked out for linear two-class
classification with margin, which has the minimal distance from the separating hyper-
plane to the closest data points. SVM learning machine seeks for an optimal separat-
ing hyper plane, where the margin is maximal. In this method, to classify the un-
known moire images, we implement the SVM technique employing four feature vec-
tors from the left-hand side and right-hand side of rectangle areas (in eq.(5) and
eq.(7)).
SOM [8] is a data visualization technique invented by T. Kohonen which reduces
the dimensions of data through the use of self-organizing neural networks. In this
study, we applied our method to the SOM for clustering the normal and abnormal
moire image.
AdaBoost [9] is the useful technique of the Boosting technique. Boosting makes a
learning machine different as the weight of the exercise is changed one after another,
the technique which composes the learning machine that these are combined and
accuracy is high. In AdaBoost when the weight of the learning machine is updated,
weight to the training sample misclassified with the learning machine increases, and
weight to the training sample correctly classified decreases. Therefore, it might be-
come difficult to see the whole image because data with a difficult distinction is em-
phatically learned.
5 Experimental Results
Experiment was done employing 1200 real moire images which is 600 of abnormal
and normal, respectively. The employed moire images are separated into two groups
such as training and test data sets. As a training data for this study, we have selected
randomly 400 (200 normal and abnormal cases, respectively) moire images which is
called G
1
, G
2
, and G
3
. The leave-one out method is applied onto three data groups,
and the average recognition rate is calculated. The leave-one out is a method of ap-
plying the obtained criteria to the data group of the remainder for two data groups,
doing the evaluation to which data is not biased.
The employed moire topographic image size is 256X256 pixels with 256 gray lev-
els. Fig.2 illustrates experimental results. In Fig.2, (a) shows a normal moire image
and (b) shows an abnormal moire image. Table 1 shows obtained classification rates.
In the table, G
i
(i=1,2,3) shows data sets, “Normal” shows classification rates which
normal cases were classified correctly, and “Abnormal” shows classification rates
103

which abnormal cases were classified correctly. Finally, “Average” shows the average
classification rate obtained from each data group, “Ave.” shows the entire average
classification rate. That is, the paragraph of G
1
shows the identification rate when G
2
and G
3
are learned as learning data, and the result of obtaining is applied to G
1
. As a
result, on the total average, classification rate of 85.2%, 85.3%, 71.8%, and 85.6%
were achieved in the ANN, SVM, SOM, and AdaBoost, respectively.
6 Discussion and Conclusions
In this paper, we proposed a new automatic classification method for the spinal de-
formity detection by using ANN, SVM, SOM, and AdaBoost method which is ex-
tracted asymmetry degree. The middle line of the subject’s back is extracted on moire
image employing the approximate symmetry analysis, and ROIs are automatically
selected, then the asymmetry degree is calculated. Four asymmetry degrees from the
right-hand and left-hand side rectangle areas which is selected as ROIs apply to train
the ANN, SVM, SOM, and AdaBoost. The total average shows the classification rate
of 85.2%, 85.3%, 71.8%, and 85.6% in the ANN, SVM, SOM, and AdaBoost respec-
tively in the experiment employing 1200 moire image. In the experimental results, the
average classification rate of spinal deformity by ANN and AdaBoost was slightly
higher than the other classifier.
Fig.3 illustrates examples of misclassification result. In Fig.3, a normal case is
classified into abnormal in (a), whereas an abnormal case is classified into normal in
(b). In figure 3, sunburn trace appears on the waist part in (a). In Fig. 3 (b), gray val-
ues subtly differ in the vicinity of an edge particularly on the shoulder part. All of the
misclassified normal cases are found asymmetry of moiré patterns. This is because
gray values distribution in the rectangle regions unfortunately affected symmetrically
when the features were calculated. To escape from this difficulty, some other asym-
metry features such as asymmetric of shoulders line or asymmetric of angle on a waist
line might be taken into account in conjunction with it. These issues remain for fur-
ther study.
In the experimental results, the classification rates which normal cases were classi-
fied correctly are higher than the classification rates which abnormal cases were clas-
sified correctly. Generally, medical doctor checks the symmetric shape of right-hand
and left-hand side such as waist line and shoulder line of human back. In the normal
case, waist line shows almost symmetric shapes. On the other hand, in the abnormal
case, asymmetric moire patterns are appeared on the waist line. To improve the classi-
fication rate in the future, we introduce a new feature such as waist line and shoulder
line for the new features. That still remained as a future works.
Acknowledgements
This work was supported by a Grant-In-Aid for Scientific Research on Priority Areas
(18560414) from the Ministry of Education, Culture, Sports, Science and Technol-
ogy, Japan.
104
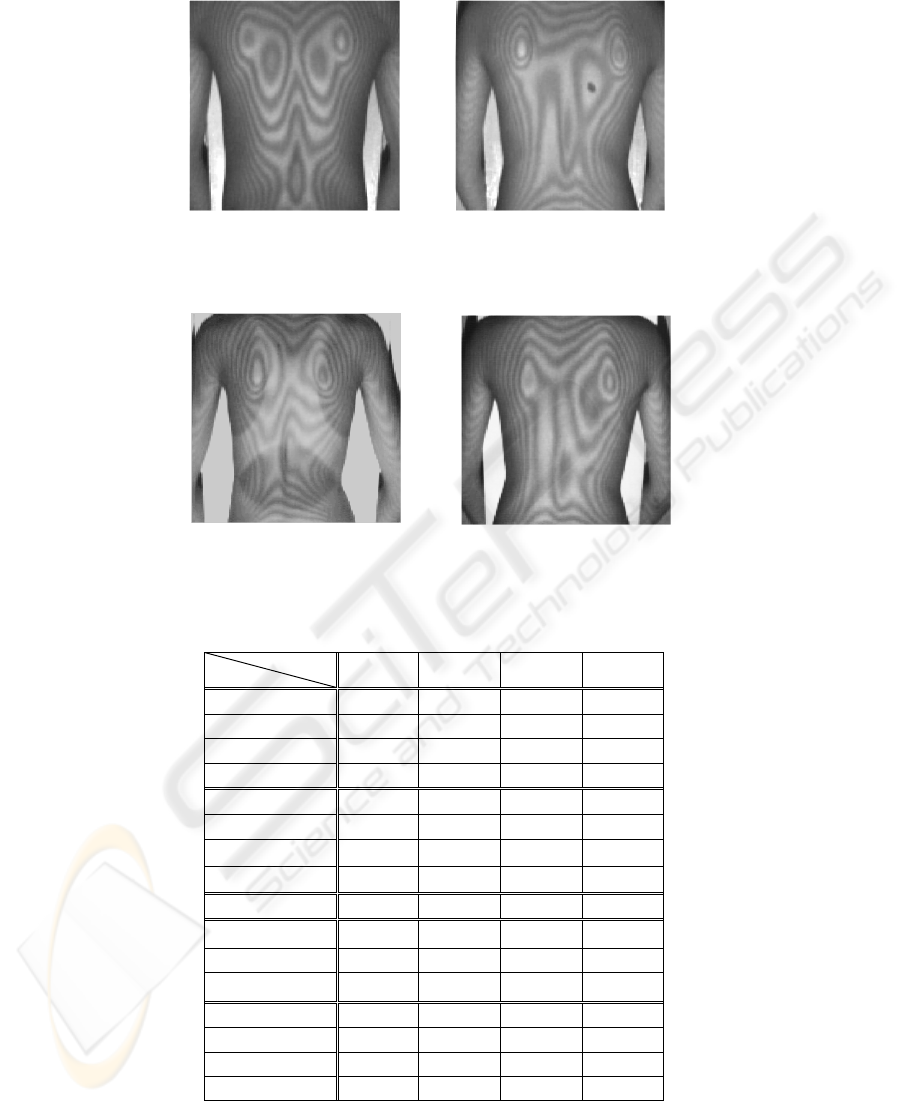
(a)normal (b)abnormal
Fig. 2. Experimental results.
(a) (b)
Fig. 3. Examples of misclassification: (a) Classified normal to abnormal; and (b) Classified
abnormal to normal.
Table 1. Classification rates [%].
G
1
G
2
G
3
Ave.
ANN
Normal 75 79.5 76 75
Abnormal 96.5 90 94 94
Average 85.8 84.8 85 85.2
SVM
Normal 76 78.5 73 75.8
Abnormal 98 91 79.5 94.8
Average 87 84.8 84.3 85.3
SOM
Normal 68 74.5 74 72.2
Abnormal 75 67.5 71.5 72.9
Average 71.5 71 72.8 71.8
AdaBoost
Normal 75.5 81 80 78.8
Abnormal 95.5 90 91.5 92.3
Average 85.5 85.5 85.8 85.6
105

References
1. Y. Ohtsuka, A. Shinoto, and S. Inoue, “Mass school screening for early detection of scolio-
sis by use of moire topography camera and low dose X-ray imageing”, Clinical Orthopae-
dic Surgery, 14, 10, pp.973-984, 1979. (in Japanese).
2. H. Takasaki, “Moire topography from its birth to practical application”, Optics and Lasers
in Engineering, 3, pp.3-14, 1982.
3. Kim, H.S., Ishikawa, S., Ohtsuka, Y., Shimizu, H., Sinomiya, T., Viergever, M.A. “Auto-
matic scoliosis detection based on local centroids evaluation on moire topographic images
of human backs”, IEEE Transaction on Medical Imaging, Vol.20, No.12, pp.1314-1320,
2001.
4. Batouche, M. “A knowledge based system for diagnosing spinal deformations Moire pat-
tern analysis and interpretation”, International Conference of Pattern Recognition, pp.591-
594, 1992.
5. Minovic, P., Ishikawa, S., Kato, K. “Symmetry identification of a 3-D object represented
by octree”, IEEE Trans. Patt. Anal. Machine Intell., PAMI-15, 5, 507-514, 1993.
6. V. Vapnic: The nature of statistical learning theory, Springer-Verlag, New York, 1995.
7. Christopher J. C. Burges “A Tutorial on Support Vector Machines for Pattern
Recognition”, Data Mining and Knowledge Discovery 2, pp.121 - 167, 1998.
8. T. Kohonen Self-organizing maps, Springer-Verlag New York, Inc., Secaucus, NJ, 1997.
9. Y. Freund, R. E. Schapire, “Experiments with a New Boosting Algorithm”, International
Conference on Machine Learning, pp.148-156, 1996.
106
