
TRAJECTORY OF SINGULAR ENERGIES FOR IMAGE
REPLICA DETECTION
Karol Wnukowicz, Wladyslaw Skarbek and Grzegorz Galinski
Institute of Radioelectronic, Warsaw University of Technology, ul. Nowowiejska 15/19, 00-665 Warsaw, Poland
Keywords: Image replica detection, SVD.
Abstract: Image replica detection system can be used by the owners of digital multimedia content to protect their
rights against unauthorised use of their material. The paper presents a new approach for content-based
image replica detection. A concept of singular energy trajectory is introduced and evaluated. It appears that
this trajectory is invariant to many image operations. Moreover, the trajectories of original images and
distorted copies are highly correlated. These properties make the proposed method a good tool for image
replica detection.
1 INTRODUCTION
Multimedia content producers and providers are
substantially interested in protecting their material
against unauthorized use and distribution. The
easiness of dissemination of such material in digital
form makes the copyright protection a big challenge.
This is especially true in the case of visual
information which can be easy copied, modified and
distributed. Designing a reliable tool for automatic
detection of replicas of digital content would
significantly help to protect the rights of copyright
owners.
The system for content-based image replica
detection should allow for a fast and reliable
identification of original and modified versions of
reference images which are subject to copyright
protection. The main concept of image replica
detection can be characterized as a simple decision
system of which the elementary function is to state
whether a given ‘suspected’ image is a copy of a
reference image or not. This system should be robust
to many popular modifications, such as
compression, image editing and enhancement
methods available in most image editing
applications.
Recently the possibility of designing a visual
identifier, which can be used for image replica
detection, was also investigated by standardization
activities of MPEG group (Bober & Kim, 2006).
In this paper the method for content-based image
replica detection using trajectory of features is
proposed. The trajectory is constructed by moving
rectangular window across the image; in each
window position, local features are extracted. Next,
the trajectory of local features is used for comparing
two images. The chosen local feature is the singular
energy of pixel values obtained by performing SVD
on image blocks formed by the moving window. As
the feature similarity function, the correlation of
singular energy coefficients of the trajectory is used.
The outline of the paper is as follows. Section 2
briefly discusses the problem of replica detection
including some recent research result. Section 3
introduces the concept of singular energy trajectory
for image replica detection. In section 4
experimental results are presented and finally
section 5 concludes the paper and proposes further
research directions.
2 IMAGE REPLICA DETECTION
Content-based image replica detection system
should allow for fast and reliable identification of
image replicas, also those which are altered by
popular image processing techniques: lossy
compression (e.g. JPEG or JPEG 2000), colour
conversion, transformations, editing (e.g. cropping).
As distinct from the techniques of image copyright
protection based on watermarking where additional
444
Wnukowicz K., Skarbek W. and Galinski G. (2007).
TRAJECTORY OF SINGULAR ENERGIES FOR IMAGE REPLICA DETECTION.
In Proceedings of the Second International Conference on Signal Processing and Multimedia Applications, pages 434-439
DOI: 10.5220/0002135904340439
Copyright
c
SciTePress

information need to be embedded into images, in
such systems image signatures are extracted directly
from the visual content of images.
The main application of content-based image
replica detection system is detection of copyright
infringements. Other possible applications would be
detection of illicit content or image forgery,
identification of multiple copies of the same image
in an image database or identification of specific
content (e.g. commercial) in TV programme.
In recent years a number of publications have
been addressing the image replica detection
problem. Some of them proposed to use the general
visual features such as colour, shape or texture to
detect image replicas. The results of using that
features in detecting replicas were rather poor. Other
methods made use of spatial decomposition of an
image and the local features were used for
comparing images in order to detect replicas. This
operation apparently improved detection rate for
some types of image modifications. Another method
was presented in (Ke et al., 2004). It uses the
concept of key or interest points which gives good
results in detecting replicas for a wide range of
image modifications, but the drawback of this
method is high computational cost and the size of
image features is relatively large.
The detection of image replicas is usually based
on similarity of the features. The decision whether
the suspected image is a replica of some reference
image can be made by applying simple threshold on
the feature’s distance function or a more complex
classifier can be applied. In (Maret et al., 2006) the
method for building classifier for replica detection
system is presented. The proposed system uses
selected visual features to build classification system
which assigns input images into two classes: replicas
and non-replicas of a given reference image. The
classification system is based on support vector
machines and a single classifier is build for each
reference image. For each reference image, a test
database containing replicas and non-replicas of that
image was used for partitioning the feature space
into two non-overlapping areas; the parameters of
the partitioning were determined during the training
stage for the classifiers. In the classification stage
the visual features are extracted from each tested
image and the images are classified according to
parameters obtained in the training stage.
Recently, the problem of image identification
was also recognized by MPEG community (Bober &
Kim, 2006). Designing a robust image identifier
would be beneficial to multimedia applications and
image databases. Core experiments were set up for
investigating possible technologies and algorithms.
Initial experiments have focused on investigating
the possibility of applying the existing descriptors of
MPEG-7 standard in replica detection applications.
These experiments showed that existing descriptors,
which were designed for image similarity retrieval,
give poor results in image replica detection tasks. A
need for a new ‘visual identifier’ descriptor, which
would be specialized for image identification and
replica detection, was suggested and new
requirements for core experiments were specified
(Bober & Kim, 2006). The idea is to extract a single
descriptor per image (image signature), then the
decision if an image is a copy of another is made
according to similarity of the descriptors. The
specification of core experiments includes the set of
tested image modifications, definition of image
dataset for proposal evaluation, the requirements on
success rate of the identification, constraints on the
extraction complexity and the descriptor size. One of
the evaluated proposals is included in (Brasnett &
Bober, 2007). This proposal is based on Trace
Transform (Kadyrov & Petrou, 2001) which is
derived from Radon Transform. The performance of
this descriptor appeared to be quite good, and the
work on further evaluation is in progress.
The evaluation method and the dataset used in
MPEG experiments on visual identifier were
adopted also in our experiments to assess the
performance of the proposed replica detection
method.
3 IMAGE DESCRIPTION BY
TRAJECTORY OF FEATURES
Our method for image replica detection uses local
features in an image which is partitioned into fixed
number of blocks. The blocks can be overlapped or
not. In each block a local feature is computed and
the successive blocks form trajectory of features.
Then, the correlation of the feature trajectories is
used to obtain the similarity of two images.
3.1 Characteristics of the Method
The preliminary assumption of the design of our
algorithm is that the possible modifications of image
copies are limited to certain class of image editing
effects. This class excludes operation such as
rotation, changing aspect ratio, and cropping. We
believe that for a broad range of images (e.g.
TRAJECTORY OF SINGULAR ENERGIES FOR IMAGE REPLICA DETECTION
445
portraits, landscapes), operations, such as rotations
or changing aspect ratio, are rarely used as they
make images look unnatural. On the other hand
image cropping is an example of other class of
modifications: sub-image editing, which is not in the
focus of this work. Nevertheless, we assume that
copies obtained by small rotations, small cropping or
small image shifting could be detected by our
method. The class of operations on original images
which should be supported by the proposed method
includes: lossy compression, resizing (preserving
aspect ratio), filter effects (blur, adding noise, etc.),
colour conversions such as conversion to
monochrome, histogram equalisation, changing
colour resolution, brightening, contrast changing,
gamma correction etc.
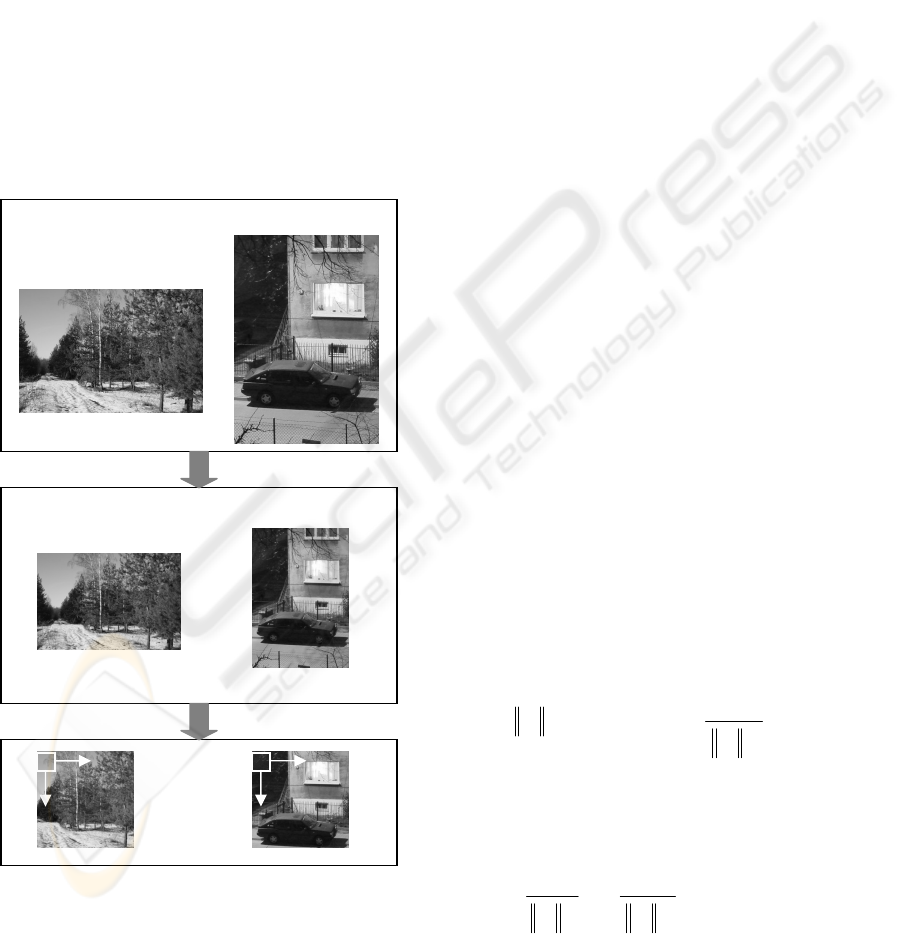
3.2 Building Trajectory of Features
Figure 1: Pre-processing steps for feature trajectory
extraction.
Building the image trajectory is preceded by pre-
processing step presented in Figure 1. First, the input
image is converted to greyscale. This operation is
performed in order to obtain invariance to various
colour conversions. Next, the greyscale image is
resized in such a way that the shorter edge of the
image consists of 128 pixels. Finally, the central part
of the image is cropped to obtain the image of size
128x128 pixels. This assures the fixed size of
images to be used for trajectory extraction.
The image obtained in pre-processing step is
used to extract the trajectory of features. The
trajectory is computed in image blocks of the size of
MxN. The window block is moved across the image
and in each window position local features are
computed. The image blocks can be ordered for
example in raster scan or along the Hilbert curve. In
this work we assumed raster scan from left to right
with step m, and from top to bottom with step n. Let
S denotes input image width and height (S = 128 in
the current approach), then the number of trajectory
anchor points equals: ((S–M)/m+1)*((S–N)/n+1).
3.3 Singular Energy of Image Blocks
In (Skarbek, 2007) a concept of image singular
energy trajectory is introduced. Image blocks can be
characterised by a local signal energy measured by
the sum of squared pixel intensities in the block. The
signal energy of a block is not invariant to most
image processing operations. However, if we
consider the fractional distribution of the energy in
singular channels, defined by singular directions of
image blocks, the situation becomes much better.
Singular energy is obtained by SVD
decomposition. Let f
1
, ... f
L
be the sequence of pixel
blocks drawn from the image f. Performing the
singular decomposition of the matrix f
i
, we consider
only r dominant singular values
σ
i
(1),…,
σ
i
(r).
It is well known that the singular energy of a
block f
i
is decomposed into the sum of all squared
singular values of f
i
:
()
()
∑∑
==
k
F
i
i
k
i
F
i
f
k
kf 1,
2
2
2
2
σ
σ
(1)
The image singular energy trajectory of rank r is
defined as the sequence of points in r dimensional
unit cube [0,1]
r
:
() ()
Li
f
r
f
F
i
i
F
i
i
,,1,,,
1
2
2
2
2
KK =
⎟
⎟
⎠
⎞
⎜
⎜
⎝
⎛
σσ
(2)
Figure 2 shows 2-D trajectories of singular
energy for images ‘lena’ and ‘baboon’ where the
horizontal axis represents the first singular energy,
converting to monochrome & resizing
original images
192x128
128x185
cropping
128x128
SIGMAP 2007 - International Conference on Signal Processing and Multimedia Applications
446

and the vertical axis represents the second singular
energy.
Figure 2: Graphical representations of singular energy
trajectories in 2D singular energy space for images: ‘lena’
and ‘baboon’.
Figure 3: Fragment of singular energy trajectory for
original image ‘lena’ (solid line) and corresponding
fragment for distorted replica (dashed line).
Figure 3 shows fragments of singular energy
trajectories for original image ‘lena’ and its distorted
version obtained by blurring. It can be seen that the
two trajectories are correlated. Because of the fact
that the singular energy trajectories of original
images and their modified copies are highly
correlated we used correlation as the similarity
function. The correlation is computed using Pearson
formula, where 1 corresponds to maximum
correlation, 0 means no correlation, and -1
corresponds to inverse correlation.
4 EXPERIMENTS AND RESULTS
To assess the performance of replica detection using
singular energy trajectories we carried out several
experiments. The image dataset and the
methodology of experiments were taken from
MPEG core experiments for visual identifier (Bober
& Kim, 2006). The correlation of 1-D trajectories of
singular energies was chosen as the similarity
function.
The performance of replica detection algorithm
can be characterised by: accuracy of the detection,
computational cost, and descriptor size. The
accuracy of the system can be measured by two
kinds of errors: the number of non-replicas
incorrectly detected as replicas, called false positive,
and the number of copies not detected as replicas,
called false negative. The relation between the false
positive and the false negative rates of a detection
system can be represented by receiver operating
characteristic (ROC) graph which shows inverse
proportionality of both variables (because higher
false positive rates correspond to lower false
negative rates).
According to definition of MPEG experiments,
the accuracy of detection is assessed in two steps. In
the first step, a large database of unrelated (non-
replica) images is used to determine operational
conditions corresponding to one per million false
positive rate (1ppm). The number of images in the
database is N=60551, and all pairs of different
images in the database is used for that purpose. The
total number of comparison is then N*(N-1)/2 =
1 833 181 525. The operational point of the
algorithm for 1 ppm false positive rate should be set
in such a way, that the number of image pairs falsely
recognized as replicas is not grater than 1833. Figure
4 depicts an example histogram of feature trajectory
correlations for non-replica images and the obtained
point of 1 ppm false positive rate, determined by the
threshold on correlation of trajectories between two
compared images.
TRAJECTORY OF SINGULAR ENERGIES FOR IMAGE REPLICA DETECTION
447

Figure 4: Trajectory correlation histogram for non-replica
images. The histogram bin size is set to 0.001.
In the next step, the success rate of the algorithm
is determined using the previously obtained
operational point for 1ppm false positive rate. For
this purpose a database of N=3944 original images
and their modified versions is used. The success rate
is determined for each modification by performing
the detection algorithm to original images and their
modified versions. If the number of successfully
detected copies is K and the number of all original
images is M, the success rate is defined as K/M. The
success rate equal 1 means, that all images were
successfully detected, 0 means no image was
detected. The modified versions of original images
were created as specified in MPEG core experiments
by applying the following processes: brightening
(+5%, +10%, +20%), colour to monochrome
conversion, JPEG compression (quality factors 95,
80, 65), colour reduction (to 16 and 8 bits per pixel),
Gaussian noise, histogram equalization, blur, scaling
(decreasing size by 50%).
We compared the success rates for different
block sizes and different number of blocks for 3
most significant singular energies. The block sizes
are 16x16 and 32x32. For block 16x16, the block
was moved in raster scan order every 8 pixels
(overlapped blocks) and every 16 pixels (non-
overlapped blocks). For block 32x32, the block was
moved every 16 pixels (overlapped blocks).
Tables 1-3 present the results on success rate for
3 most significant singular energy channels. The
trajectories for each channel were computed and
compared separately. Table 1 shows the results on
success rate for block size 16x16 with moving step 8
(horizontally and vertically, which gives 225
trajectory points). The 1ppm false positive
thresholds obtained for the singular energy trajectory
correlations are: 0.906 for the first channel, 0.852 for
the second channel, and 0.885 for the third channel.
Table 2 shows the results on success rate for block
size 16x16 and the moving step 16 (which gives 64
trajectory points). The 1ppm false positive
thresholds are: 0.930, 0.912, and 0.930 respectively.
Table 3 shows the results on success rate for block
size 32x32 and the moving step 16 (which gives 49
trajectory points). The 1ppm false positive
thresholds are: 0.968, 0.944, and 0.957 respectively.
Table 1: Success rates of replica detection corresponding
to 1ppm false positive rate for 1-D trajectories of singular
energy channels (using block size 16x16, step 8x8).
Singular energy
channel
1
(%)
2
(%)
3
(%)
scale to 50% 99.18 99.39 98.88
JPEG, q = 95 100 100 100
JPEG, q = 80 99.87 99.84 99.59
JPEG, q = 65 99.72 99.79 99.26
bright. +5% 99.9 99.92 99.77
bright. +10% 99.77 99.84 99.59
bright. +20% 99.21 99.54 99.06
blur (3) 99.8 99.8 99.59
blur (5) 99.19 99.54 98.7
noise (6) 98.88 99.59 98.85
noise (20) 98.61 99.39 98.55
noise (64) 97.54 98.94 97.46
color 8 bpp 98.05 98.83 98.3
color 16 bpp 96.72 97.21 96.83
grey 99.44 99.59 99.21
hist. equaliz. 75.89 83.54 77.31
Table 2: Success rates of replica detection corresponding
to 1ppm false positive rate for 1-D trajectories of singular
energy channels (using block size 16x16, step 16x16).
Singular energy
channel
1
(%)
2
(%)
3
(%)
scale to 50% 99.11 99.26 98.33
JPEG, q = 95 100 100 100
JPEG, q = 80 99.9 99.87 99.47
JPEG, q = 65 99.67 99.72 98.96
bright. +5% 99.87 99.85 99.62
bright. +10% 99.7 99.72 99.47
bright. +20% 98.96 99.14 98.05
blur (3) 99.65 99.62 99.09
blur (5) 98.2 99.11 94.85
noise (6) 98.68 99.31 98.38
noise (20) 98.33 99.04 98.05
noise (64) 97.03 98.38 96.55
color 8 bpp 97.87 98.53 97.52
color 16 bpp 96.55 96.86 96.12
Grey 99.29 99.34 98.76
hist. equaliz. 71.04 74.39 68.10
0.852
1ppm false positive
rate threshold
SIGMAP 2007 - International Conference on Signal Processing and Multimedia Applications
448

Table 3: Success rates of replica detection corresponding
to 1ppm false positive rate for 1-D trajectories of singular
energy channels (using block size 32x32, step 16x16).
Singular energy
channel
1
(%)
2
(%)
3
(%)
scale to 50% 98.15 98.96 98.07
JPEG, q = 95 100 100 100
JPEG, q = 80 99.9 99.94 99.77
JPEG, q = 65 99.72 99.77 99.57
bright. +5% 99.82 99.85 99.7
bright. +10% 99.32 99.59 99.29
bright. +20% 96.93 98.25 96.81
blur (3) 98.43 99.77 98.86
blur (5) 92.69 98.91 94.8
noise (6) 99.21 99.69 99.26
noise (20) 98.91 99.59 98.99
noise (64) 97.9 99.24 98.53
color 8 bpp 97.97 99.06 98.05
color 16 bpp 97.69 98.4 97.79
grey 98.17 98.91 98.45
hist. equaliz. 63.44 70.36 64.9
The best result appeared to be obtained when the
second singular energy is used, it is worth to note
that in may come from the best (lowest value)
correlation threshold obtained from 1 ppm false
positive test. The overall best result was achieved for
225-point trajectory with overlapped image blocks
of size 16x16 pixels. However, for some distortions
better results were obtained when using a smaller
number of trajectory points but with a bigger block
size 32x32. This was observed for replicas obtained
by lossy compression and adding Gaussian noise.
5 CONCLUSIONS
The paper presents the method for replica detection
using singular energy trajectory. The results for 3
different trajectory parameters and 3 singular energy
channels are presented. The achieved success rate is
quite high as it exceeds 98 - 99 % for most of the
image modifications and at the same time the false
positive rate is very low. The result is apparently
better than obtained using the features designed for
image similarity retrieval. We plan to extend our
method to detect sub-image copies by investigating
partial similarity of trajectories.
We observed that the images of which copies are
usually missed during the detection have big regions
with small pixel variance, which causes that most of
the pixel energy is concentrated in the first singular
channel. This causes that the correlation of singular
energy between original and distorted image is low
because the ratio between the signal energy of
original image and the noise introduced by
distortions becomes low. To achieve better success
rate, such cases should be detected and different
distance function should be used – possibly using
3-D trajectory of combined energy channels. We
expect to improve the detection rate of the method
by solving this problem in our future work.
ACKNOWLEDGEMENTS
The work presented was developed within VISNET
II, a European Network of Excellence
(http://www.visnet-noe.org), funded under the
European Commission IST FP6 programme.
REFERENCES
Bober, M., Kim, S.K., (eds), 2006. Description of MPEG
7 visual core experiments, ISO/IEC
JTC1/SC29/WG11 N8464.
Brasnett, P., Bober, M., 2007. Visual identifier proposal &
evaluation results, ISO/IEC JTC1/SC29/WG11
M14225.
Kadyrov, A., Petrou, M., 2001. The trace transform and its
applications. IEEE Trans. PAMI, 23(8), 811-828.
Ke, Y., Sukthankar, R., Huston, L., 2004. An efficient
parts-based near-duplicate and sub-image retrieval
system. In Proc. 12
th
ACM International Conference
on Multimedia, New York, USA, 869-876.
Maret, Y., Dufaux, F., Ebrahimi T., 2006. Adaptive image
replica detection based on support vector classifiers.
Signal Processing: Image Communication, 21(8), 688-
703.
Skarbek, W., 2007, Singular and principal subspace of
signal information system by BROM algorithm. In
Rough Sets, Fuzzy Sets, Data Mining and Granular
Computing, Springer LNAI 4482, 157-165.
TRAJECTORY OF SINGULAR ENERGIES FOR IMAGE REPLICA DETECTION
449
