
A FLEXIBLE MOBILE NETWORK MONITORING TOOL
Rodrigo M. S. Gonçalves, Bruno M. G. Miranda
Instituto Superior das Ciências do Trabalho e da Empresa, DCTI
Avenida das Forças Armadas, Edifício ISCTE – 1600 Lisboa
Francisco A. B. Cercas
Instituto de Telecomunicações, Av. Rovisco Pais 1, 1049 - 001 Lisboa
Keywords: Key-Performance Indicators, Quality of Service, Network Monitoring.
Abstract: This article presents a model to implement an information system to monitor mobile networks using Key
Performance Indicators (KPIs). The proposed model encloses not only the KPI calculations but the
translation, importing and presentation of data. It also addresses more advanced topics such as system
configuration, node dependencies and routing. A description of the system’s implementation is also
presented, from two perspectives: high-level components and technology-related issues. The paper finishes
with the presentation of a system application: monitoring a KPI using a data plot generated by the system.
1 INTRODUCTION
Designing an information system to monitor the
performance of a mobile network presents quite
interesting challenges. The inherently complex
network structure faces the implementer with issues
regarding data conversion, storage, processing and
presentation.
Network and node performance measurement is
crucial for any telecommunications network. It
allows network scanning and spotting of anomalous
situations that may contribute to a decrease in the
required Quality of Service (QoS) (Kreher, 2006).
With the help of an appropriate tool to diagnose
these errors, one can apply corrective measures that
eliminate or mitigate the problem’s causes and
effects.
Performance measures are usually achieved by
collecting statistical data at the nodes and then
processing it with appropriate mathematical
formulas to obtain the required performance issues.
This leads to the concept of Key Performance
Indicator (KPI). A KPI is a formula-based
computation executed over collected data. Usually,
the formulas that describe KPIs are simple algebraic
equations. The difficult issues that may involve
KPI’s calculation are related to the information
filtering and data selection that takes place
beforehand (Kreher, 2006).
In mobile networks the data is usually collected
and transmitted to a central repository where it is
stored. For example, in a typical Global System for
Mobile Communications (GSM) network this would
be the Operation and Support Subsystem (OSS).
It is common to find different formats to encode
and transmit the nodes collected data. This
discrepancy is due to the continuous network
evolution and expansion which leads to the
introduction of different technologies at the nodes.
The next step is to process the data and that is
where KPIs are evaluated. Their formulas are
applied on the raw statistical data and the results are
again stored on a different data repository close to
the network operator equipment. Therefore
operators, or subcontracted network managing
service providers, must carefully dimension its
database capacity and structure to implement a
Network Monitoring Information System (NMIS).
Finally the processed data must be presented to the
user in a convenient way.
In this paper we describe a NMIS model that was
completely developed and tested to fulfil an
operator’s needs.
Our goal is to develop a NMIS model that can be
easily customized and with great adaptability
capabilities. Our system must hide all the network
241
M. S. Gonçalves R., M. G. Miranda B. and A. B. Cercas F. (2007).
A FLEXIBLE MOBILE NETWORK MONITORING TOOL.
In Proceedings of the Second International Conference on Wireless Information Networks and Systems, pages 225-229
DOI: 10.5220/0002147102250229
Copyright
c
SciTePress

monitoring complexity, be robust and allow
distributed access.
The remainder of this paper is organized as
follows: section 2 briefly describes the state of the
art on these system tools, section 3 presents the
system model, as well as a description of the
model’s implementation, section 4 presents the
results, based on a network monitoring service
example and it briefly discusses the impact of this
model on the achievement of the service goal.
Finally, section 5 summarizes the model
conclusions.
2 STATE OF THE ART
Since network monitoring is not a common issue on
the software developing circles, there are not many
solutions that can serve as a de facto standard to
base a new system development. Although we were
able to find some similar solutions, these are
commercial products and therefore their
implementation specifications are not in the public
domain.
Nevertheless, Waadt et al. (Waadt et al, 2005)
presented a framework for a QoS monitoring,
alerting and SMS Center reconfiguration that we can
use as a model for the features that we have
developed. Their system is written in Java and
operates in real-time. It detects when the QoS
parameters drop below, or exceeds previously
defined thresholds, and generates an alert message
that can be used for system reconfiguration. This
system is strongly biased towards the Short Message
System (SMS) of GSM networks and thus it does
not represent a full solution for a more general
performance monitoring system.
Rigallo et al. (Rigallo et al, 2002) have also
proposed an architecture and functional
implementation of a real-time monitoring and
operation assistant system developed for Telecom
Italia Mobile (TIM). This system, named NetDoctor,
is a multi-layer OSS that allows for data collection
and storage, network status monitoring and
automatic failure detection and correction. On top of
this, there is a web interface that allows distributed
access.
Both proposals come short when the goals of
tool design encompass a broad scope solution
covering different areas of mobile networks while
maintaining a good degree of simplicity. These
solutions are based on frameworks, which, as it can
be found on (Fayad et al, 1999), impose a steep
learning curve on their users. We have deviated from
this option by developing a “service-oriented”
solution where the services can be thought of as
components, thus achieving the desired simplicity,
ease of use and also rapid-development ability as a
side effect.
3 SYSTEM MODEL AND
IMPLEMENTATION
In the following description it is useful to separate
the system into two major components: core services
and auxiliary services.
Core services deal with storage, processing and
presentation capabilities. Auxiliary services are
responsible for filling the gap between the physical
network and the data model used in the core
services. This insulating layer must accept the
different data formats used by the network nodes
and convert them to a standard system format. It
must also import data into the storage technology
used by the core services. The auxiliary services act
as an interface between the real world and the core
services.
On the other hand, core services handle the
system’s main concerns: they store the raw and
processed data in a structured way to allow great
system’s flexibility with the chosen database
technology, they supply a mechanism to compute
the KPIs from the defined formulas and they enable
data to be presented in an informative, distributed
and user-friendly way.
The following figure illustrates the system
modelling in terms of components and its relations
with the real world.
The storage service, which is part of the system’s
core services, encompasses the system data model
and the repository where those data is stored. This
repository is traditionally implemented as a
relational database system (Codd, 1970). The
system’s data model can be easily driven by
analysing the proper network hierarchy:
Figure 1: Modelling the system in layers.
WINSYS 2007 - International Conference on Wireless Information Networks and Systems
242
“A network is a set of nodes. A node belongs to
a certain type of network element. This has raw
statistical data objects and KPIs associated to it. A
node can depend on another node, and can have zero
or many nodes that depend on it. A node can be
connected to one or more nodes and this connection
is named a route.”
Using these relations we can represent the data
model structure using a Unified Modelling
Language (UML) (Booch et al, 1970) class diagram.
Figure 2 shows a simplified class diagram that might
be helpful to provide better understanding of the
system’s data model.
Figure 2: Simplified class diagram of the main system.
We present the statistical data (raw and KPIs) on
different tables, with one table per KPI/statistical
data object. We must keep record of the data objects
attributes and values and this leads us to the
concepts of “descriptor” – an entity that is
responsible to describe other entities in terms of
their attributes – and “value holder” – an entity that
keeps the value of another entity defined by a
descriptor. So we should have a table to keep
information about data items such as name, formula
and network element to which the data is associated,
and another one to hold the corresponding data
values. The first table is the “descriptor” and the
second one is the “value holder”. This distinction
makes sense from the database point of view as it
increases its efficiency and provides a clean
structure. The <<metaclass>> UML stereotype is
used to indicate that both raw data types and KPIs
will have a similar structure, but different table
names and column number and names.
Figure 3 illustrates a class diagram showing node
dependency and routing. A node can act as a parent
for other nodes, or a as child of one node. Therefore,
a parent-node can be parent of zero or more nodes,
and a child-node can have, at most, one parent. A
route can also be modelled as an association
between two nodes. The roles of a node in a route
are origin and destination.
Figure 3: Simplified class diagram showing the routes and
node dependency.
With this static structure we can implement the
storage services of the system. Processing services,
as previously mentioned, are responsible for taking
the raw statistical data, applying the appropriate
formulas and calculating the corresponding KPI
values. Although this task can be accomplished in
several ways, it will always have to follow these
stages: retrieve the formula from the KPI descriptor,
retrieve the data from the raw data value holder,
perform the calculation and store the result on the
KPI value-holder.
Presentation services are responsible for fetching
data (both raw and KPI) and organizing it in a
convenient format for a human reader. They can also
be implemented in several different ways.
Configuration services are used to manage
networks, element types and nodes, as well as to
define KPIs and raw data statistical objects.
Another type of services, called auxiliary, must
be able to translate the incoming data to a format
that is understood by the system and then store it in
the database. This translation process is divided in
two stages: parsing the input data and then
processing it to the output format. The next step is to
import the output data into the database. However,
this depends on the technology used, according to its
database management system. To implement these
tasks, one must know the formats for input data and
structure of the database tables, where parsed data
will be stored.
To validate our model, we made a complete
system’s implementation, fed it with real network
data and then we ran some tests on it. To undertake
this task we have implemented the core part of a
GSM mobile network.
The implementation was done on a Linux
machine with MySQL database system, a PHP 5
interpreter and an Apache http server. This
A FLEXIBLE MOBILE NETWORK MONITORING TOOL
243

configuration is widely known as LAMP-bundle and
was chosen due to two criteria: proven system
stability and zero cost.
We propose a model sufficiently general to
accommodate any kind of network whose nodes may
be associated with statistical measures. Another
feature present in our model is portability, allowing
it to be easily migrated to different platforms with
low production costs. That is why we chose PHP, an
interpreted language, and MySQL. PHP also has the
advantages of strong scalability capacities and a
large set of libraries that allow the programmer to
perform many complex tasks without having to
rewrite code for them. Furthermore it can run both
as a server-side application and as a command-line
interface (CLI) application which allows the
implementation of all systems services in PHP. In
fact, the data parsers, the data import-mechanism,
the calculus engine used by the processing services
and all the web content generation code were coded
using PHP. The fact of having only one
programming language in the system also benefits
code maintenance.
Parsers convert statistical data received from
nodes – via the OSS – in a convenient and
meaningful format for the system. We chose this
data format as Delimiter-Separated Values (DSV)
because it is well suited to be imported in MySQL
database systems. For convenience, these parsers
output files whose name identify the node that
produces the data, the raw data type name and the
date of collection. The parsing process is based on
regular expressions matching,
After the parsing process, the output data is
stored in the database. For this we wrote a script that
reads the processed data files and tries to match its
meta-information (file name and headers, if
applicable) with the raw data descriptors stored in
the database. When a match is found, the data is
retrieved from that file, line by line, and written on
the corresponding database table.
These parsing and import processes were
scheduled as cron jobs. Cron is a time-based
scheduler application found on Unix-like systems.
Since these might be resource-consuming activities
they were scheduled to run on an off-peak hour (3
A.M.).
After storage is completed, another cron job
executes the processing services. These were
implemented as a software engine with the ability to
perform mathematical calculus operations. For this
purpose we chose a very useful PHP function:
eval(). This function receives a string parameter
and evaluates it as if it was code. It is useful for
situations where one wants to store code on a
database and execute it later on, which is exactly the
case we are interested in. The processing service
retrieves the KPI formulas on the descriptor table of
the database and evaluates them, for the different
raw data samples, using the eval() function.
After evaluation the results are again stored on the
appropriate KPI tables on the database.
Presentation services are also considered core
services because this system is user-oriented, so the
interface between the data and the user plays a
crucial role in the system. These services were
implemented as a web-site where the user can
request information on several KPIs. A plot for a
given KPI, a set of nodes and date interval was one
of the implemented services. This service allows a
user to follow the variation of a given KPI. To
generate the plots we have used a PHP library
named ‘jpgraph’, which is also open-source. Other
services were also implemented by operator request.
Configuration services were also implemented as
services running on a web-site. Using Hypertext
Mark-up Language (HTML) forms it is possible to
obtain a clear and intuitive way of configuring all
the system’s parameters regarding its management.
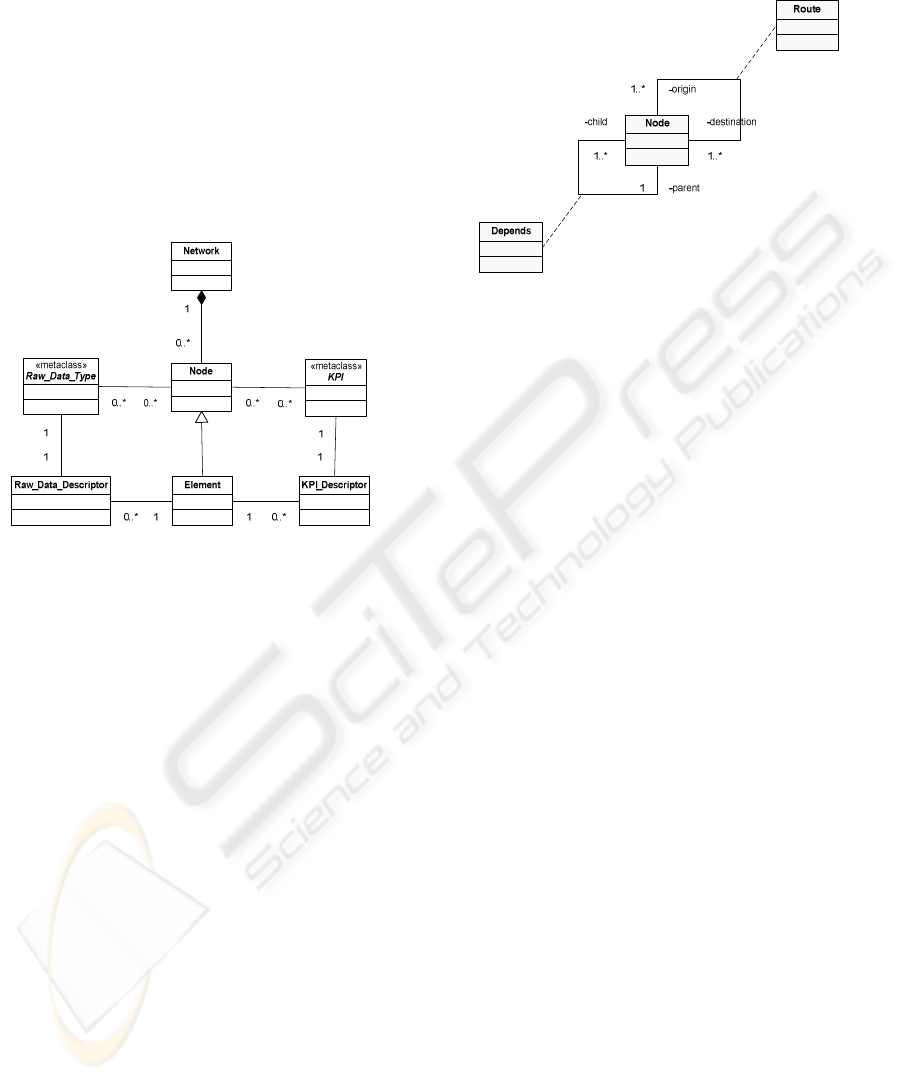
4 RESULTS AND DISCUSSION
For illustrating the results obtained with our system
we present in figures 4 and 5 the results produced by
a KPI named “CP LOAD”. This shows the CPU
load of a MSC node and it is evaluated with the
following formula:
CP_LOAD = ACCLOAD / NSCANS (1)
Where ACCLOAD is the accumulated processor
load in percentage and NSCANS is the number of
accumulations. These fields were implemented as
counters on the raw data object that comes from that
node.
In figure 4 we present the figure obtained for the
evolution of KPI “CP LOAD” on a
MSC located at
Luanda, Angola, between 15th and 28th December
2006. It is possible to see a recurring pattern every
couple of days, as well as to determine the lower and
higher mean value intervals. The x-axis represents
time and the y-axis the KPI’s percentual value.
As we can observe in Figure 4, there was no data
for 18
th
December and also between 23
rd
and 24
th
December.
Figure 5 shows a different view for the same KPI
and a given date, Christmas Day on 2006, now
concerning two different MSCs located at Luanda
and Benguela, Angola. This figure clearly shows the
traffic evolution on that day, making it easy to figure
out its busy-hour.
WINSYS 2007 - International Conference on Wireless Information Networks and Systems
244
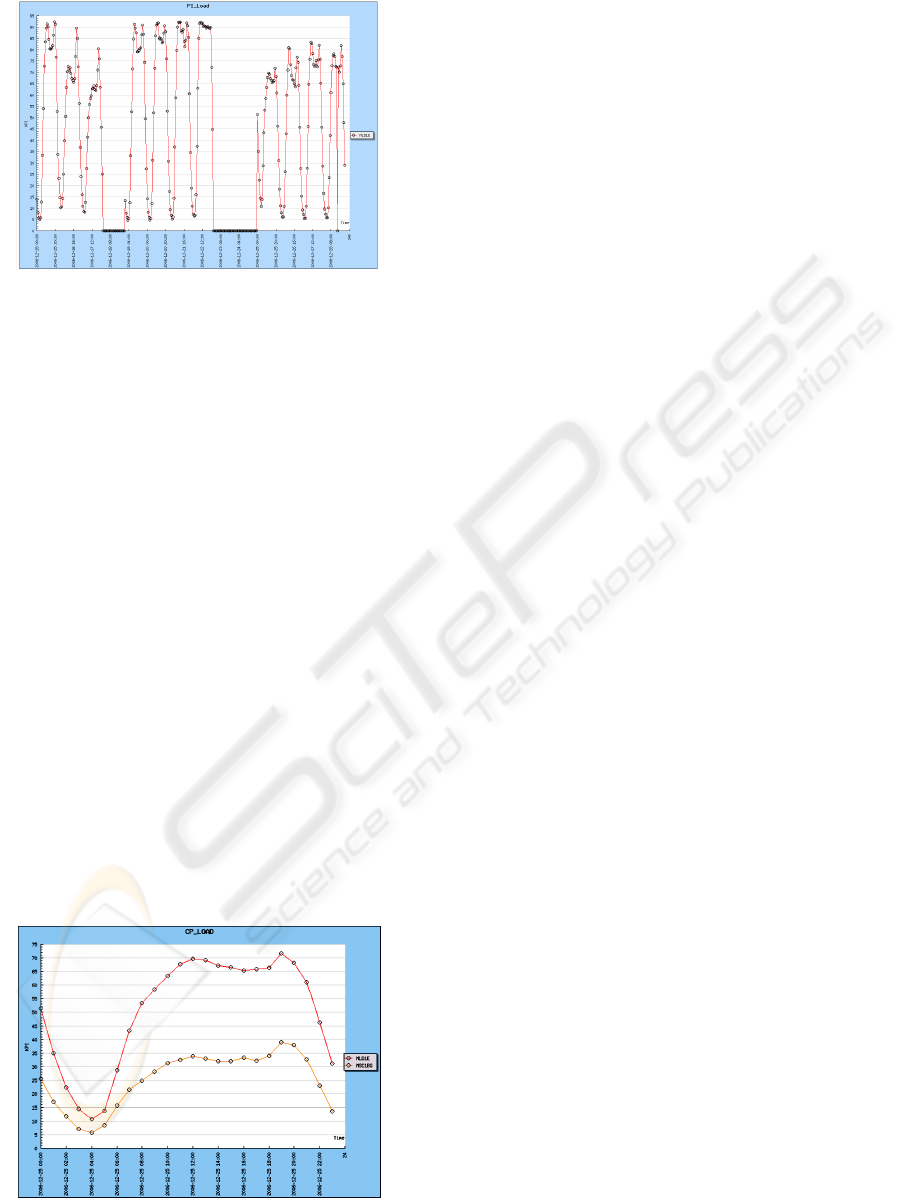
Figure 4: Evolution of “CP LOAD” between 15
th
December 2006 and 28
th
December 2006.
These results, as well as the validation of our
complete system, were only possible thanks to an
operator that has provided us the necessary data.
5 CONCLUSIONS
In this paper we have proposed a system model to
implement a network monitoring tool that can be
used to manage networks from telecommunication
operators or other systems alike. This model is
highly flexible and can be easily extended to
accommodate any particular operator’s needs. The
main characteristics of this system are its low
development costs (due to the use of open source
software), portability (since all code is written in an
interpreted language, and thus independent from the
system), reduced complexity (as opposed to the
large framework-based software referred on the
state-of-the-art), modularity (its services are
independent modules), flexibility (a consequence of
its simple structure and modularity) and easy remote
access (via a web page).
The system has been implemented, validated and
tested in a real environment of a GSM operator.
Figure 5: Evolution of “CP LOAD” on two different
MSCs on 25
th
December 2006.
REFERENCES
Kreher, R., 2006. UMTS Performance Measures: A
Practical Guide to KPIs for the UTRAN Environment,
Wiley.
Waadt, A., Bruck, G., Jung, P., Kowalzik, M., Trapp, T.,
Begall, C., 2005. QoS Monitoring for Professional
Short-Message-Services in Mobile Networks, Wireless
Communication Systems 2005. 2nd International
Symposium on Wireless Communication Systems,
pp228- 232, 5-7 Sept.
Rigallo, A., Stringa, A., Verroca, F. , 2002. Real-Time
Monitoring and Operational Assistant System for
Mobile Networks, IEEE Network Operations and
Management Symposium, pp 899-901, 15-19 April.
Fayad, M., Schmidt, D., Johnson, R., 1999. Building
Application Frameworks – Object-Oriented
Foundations of Framework Design,pp 11, Wiley.
Codd, E., 1970. A Relational Model of Data for Large
Shared Data Banks, Communications of the ACM,
Vol. 13, No. 6, pp. 377-387.
Booch, G., Rumbaugh, J., Jacobson, I., 1998. The Unified
Modelling Language User Guide, Addison-Wesley
Professional.
A FLEXIBLE MOBILE NETWORK MONITORING TOOL
245
