
ASSESSING THE USER ATTITUDE TOWARD PERSONALIZED
SERVICES
Seppo Pahnila
Department of Information Processing Science, University of Oulu, 90014, Oulu, Finland
Keywords: Personalization, personalized services.
Abstract: The fast growth of the Web has caused an excess of information to become available. Personalized systems
try to predict individuals’ behavior based on user information, in order to deliver more accurate and targeted
content by filtering out unimportant and irrelevant information. Prior personalization research has mostly
focused on e-business issues, personalization techniques and processes or privacy concerns. In this research,
we have studied users’ attitudes toward personalization and their desire to control personalized services. The
results are based on a field study consisting of 196 relevant responses from the users of a personalized
medical portal. We also analyzed respondents’ changes in attitude toward personalization by comparing
responses from two field studies. The results show that the respondents appreciate personalized information
which is closely related to their occupation. The respondents accept personalized services but they do not
consider automatic content personalization to be important, nor do they appreciate automatic appearance
personalization; they want to intervene in the transmitted information.
1 INTRODUCTION
The massive growth of available information on the
Internet has forced system owners to pay more
attention to easy access to the relevant information
at the right time. Users can get lost when navigating
in information space, or they might not find what
they are looking for (Brusilovsky 1996b).
Personalization tries to help individuals by reducing
the workload required to get relevant information at
the right time (Smyth and Cotter 2000).
Personalization has been implemented on the
Internet largely in two ways: by allowing the user to
customize personalized pages, or by allowing the
system to make the modifications. Customization
occurs when the user can to some extent manipulate
the interface, user profile or content manually
(Manber, Patel et al. 2000). In personalization, the
user has less control; essentially the system takes
care of content selection and presentation in a fully
automatic way, based on information from the user
model (Brusilovsky 1996b; Nielsen 1998; Kobsa,
Koenemann et al. 2001b). Individuals need for
control is guided their tendency to gain information
from the environment (Baronas and Louis 1988).
Individuals want to master their own acts and to
know the causes and consequences of their own and
others’ acts (Baronas and Louis 1988). Basically,
individuals are not willing to accept that they do not
have control. Nielsen (1998) doubts a personalized
system’s ability to predict user behavior. He
emphasizes that the user is the only one who knows
her/his needs. Nielsen places emphasis on user
control and the user’s right to make their own
choices. Conversely, Mulvenna (2000) suggests that
check box personalization, where users can select
pages they are interested in, is limited because users
cannot know the content of the IS in advance.
Brusilovsky (1996b) emphasizes that the question of
who will adapt the information is not merely a user
or system issue, it is dependent on the application
area.
Earlier personalization research has been mostly
focused on three areas: (e-)business issues (Riecken
2000; Schonberg, Cofino et al. 2000; Karat, Brodie
et al. 2003; Murthi and Sarkar 2003), personalization
techniques and processes (Resnick and Varian 1997;
Kramer, Noronha et al. 2000; Mobasher, Cooley et
al. 2000; Spiliopoulou 2000; Pierrakos, Paliouras et
al. 2003; Tam and Ho 2005) or privacy concerns
(Hoffman, Novak et al. 1999b; Volokh 2000; Kobsa
2002; Chellappa and Sin 2005). All these areas are
198
Pahnila S. (2007).
ASSESSING THE USER ATTITUDE TOWARD PERSONALIZED SERVICES.
In Proceedings of the Ninth International Conference on Enterprise Information Systems - HCI, pages 198-206
DOI: 10.5220/0002351101980206
Copyright
c
SciTePress

linked with the service provider’s viewpoint to
personalization.
There are few studies which emphasize a “user-
centered” view of personalization. The objective of
this research is to focus on personalization as it
appears to the end users. Many features of
personalized Web information systems differ from
those of “traditional” information systems, and we
believe that this research can be expected to be of
interest to researchers, designers and companies that
employ personalized systems. In this research, we
have studied users’ attitudes toward personalization.
In particular, we address issues relating to users’
personalization expectations, experiences and their
willingness to control the personalized information
on offer. The users of the given information system
– a personalized medical information system – are
mostly doctors and medical personnel to whom it is
important to receive relevant, accurate and timely
information, for example, related to drugs, diseases
or methods of treatment. The main objective of the
IS is to provide access to special field information
and to facilitate the flow of information.
Personalization in a medical IS is designed for
certain particular groups with varying duties and
preferences by applying segmented personalization.
Segmentation is based on the speciality e.g. news
concerning anaesthesia is delivered to anesthetists.
Empirical data for the study was collected from
the users who are registered in the Finnish medical
network, and are users of the medical IS. Potential
users of the IS are geographically spread all over
Finland. We conducted a field study based on the
Web questionnaire with a result of 209 responses.
The total sum of reliable responses was 197.
Our findings suggest that people appreciate
personalized work-related information which is
closely related to their occupation. Moreover,
respondents accept personalization but they have a
desire to modify content themselves. Respondents
do not consider automatic content adaptation or
automatic appearance adaptation important.
The paper is organized as follows. In the
following section we will discuss, based on prior
literature, issues which may have an influence on
users’ attitudes toward personalized services. In
section 3 we describe the research methodology,
data collection procedures and the results of the
study. In the last section we draw conclusions from
the results of the study.
2 THEORETICAL
BACKGROUND
Eirinaki et al. (2003) define personalization as “the
process of customizing the content and structure of a
website to the specific and individual needs of each
user, taking advantage of the user’s navigational
behavior.” Many researchers emphasize business
values, loyalty and active interaction – for example,
Zemke and Connellan (2001) suggest that
personalization adds to the value of a site and may
lead to better customer retention and loyalty. Mittal
and Lassard (1996) emphasize the social side of
personalization, defining personalization as “the
social content of interaction between service
employees and their customers.” This definition of
personalization includes the quality of interaction or
closeness between the service employee and
customers. The feeling of closeness is an important
issue in the real world, and also in the virtual world.
The interaction can range from cold and impersonal,
to very warm and personal (Mittal and Lassar 1996).
These definitions reflect the fact that there is a
principled disharmony between the assumed needs
of the user, the true needs of the user and the website
designer’s view on what is relevant (Mulvenna,
Anand et al. 2000).
Nielsen (1998) emphasizes the usability of the
personalized system. The system should allow the
user to decide what information (s)he needs by
offering several understandable options to choose
between, so that the user’s choice is easy. Nielsen
stresses that the system should offer sufficient
information to the user so that the user knows the
consequences of their choices. Nielsen does admit
that personalization can work in cases when the
environment is stable and can be easily described in
the system. Nunes and Kambil’s (2001) findings are
consistent with the previous suggestions. In their
survey, they allowed customers to use services
which were both customized and personalized. Their
results indicate that customers clearly prefer
customized services. Nunes and Kambil concluded
that the best strategy might be to combine the two
techniques by allowing customers a certain degree of
control over an automatic personalized system.
3 RESEARCH METHODOLOGY
We performed a field study in which data was
collected using a web questionnaire, which was
designed and developed in cooperation with experts
ASSESSING THE USER ATTITUDE TOWARD PERSONALIZED SERVICES
199

in the IT field and the target company. The scale
used was mainly the seven-point Likert scale, with 1
being the negative end and 7 the positive end
ranging from fully disagree to fully agree.
3.1 Demographic Profiles
Our target group was all the doctors and medical
students who are registered in the Finnish medical
network, and who are users of the medical IS.
Potential users of the IS are geographically spread
all over Finland. A field study with 209 responses
was conducted. The total sum of reliable responses
was 197. The potential number of IS users in total
was about 9500 including specialists, doctors,
medical students and the group “others”. Table 1
presents descriptive statistics of the sample.
Table 1: Profile of the respondents.
Measure Items Frequency Percent
Male 100 50.8
Gender
Female 97 49.2
≤ 31
51 25.9
32 - 41 53 26.9
42 - 51 46 23.4
Age
≥ 52
47 23.9
Specialist 112 56.9
Doctor 54 27.4
Occupational
title Medical
student/Other
31 15.7
Very/fairly
weak
13 6.6
Average 102
Fairly good 66 33.5
Computer
expertise
Very good 16 8.1
< 0.5h 64 32.5
less than 1h 81 41.1
1-5h 50 25.4
IS usage time
per week
5-10h 2 1.0
3.2 Usage of Different Services
We asked respondents to evaluate their usage of nine
most used services of the given system. The selected
services refer to different areas of interest: topics
related to expertise and work, and topics related to
study and leisure time. Table 2 shows responses that
indicate frequent use (often and very often used) of
the given services. We asked respondents to estimate
their activity using a five-point scale of
measurement ranging for never to very often. The
name of each service refers to a link, which is visible
on the portal’s page. The distribution of results
indicates that search services and special field news
are the most frequently used services. It is obvious
that respondents regularly follow the development,
e.g. research and science, of their profession.
Similarly, special field articles are considered
important.
Table 2: Usage of medical portal services.
Portal service Frequency Percent
Search services
55 28.2
Special field news
52 26.4
Leisure time services
(weather, news, etc.)
40 20.3
Special field articles
38 19.4
Special links
30 15.5
Drugs
23 11.8
Congresses
19 9.9
Forms
8 4.1
Ordering medical products
7 3.6
More leisure-related services, as weather and news
were also popular among regular users. “Forms”
includes, among others, different precompleted
forms, which the respondent need concerning their
work.
3.3 Respondents’ Behavior toward
Personalization Expectations
Personalization expectations were studied by setting
three questions which started with “Would you
like…”, and using a three-point scale, with the
options “No”, “I don’t know” and “Yes”. First we
asked the question “Would you like the medical
portal to adapt automatically according to the
services you have used?” Primary goal of these
questions was to assess users’ expectations towards
services. Figure 1 shows that, in general, the
responses were quite uniformly distributed between
“No” and “Yes”. The number of “Don’t know”
responses was also quite high. As Figure 1 shows
there was a slight difference between males and
females. The majority (39 %; N=39) of the male
respondents answered “Yes”, and 34 % (N=34)
answered “No”. Similarly 35.1 % (N=34) of females
answered “No” and 34.5 % (N=32) answered,
“Yes”. In age group there was a slight difference
between the groups that are under 41 and those 42
and over. According to cross tabulation followed by
a Pearson Chi-Square test, there was an association
between the variables expertise and automatic
ICEIS 2007 - International Conference on Enterprise Information Systems
200
adaptation; hence automatic adaptation is dependent
on expertise. (χ
2
-value = 20.567, p-value = 0.002).
This conclusion was not necessarily reliable because
33.3 % of expected frequencies were less than five
(allowed maximum 20 %) and the expected
minimum was 3.83 (maximum more than 1).
Therefore, the difference was also tested using
Fisher’s Exact test (Fisher’s Exact test value =
21.438; p-value = 0.001). The tests indicate that
respondents’ attitude towards automatic
personalization is statistically significant and
dependent on expertise. Surprisingly, respondents
with fairly good or very good expertise would like
automatic personalization more than respondents
with weak or average expertise. Even though the
differences between these expertise groups are quite
minor, one would think that people with good
expertise would like to adapt and control the system
themselves more than respondents with weak
expertise. According to our analysis, there were no
differences between the groups in other
combinations.
Overall, considering the whole data, statistical
distribution show that 34.5 % (N=68) of the
respondents responded “No” to this question, 29.4 %
(N=58) answered “Don’t know” and 36 % (N=71) of
the respondents answered “Yes”. Thus, “No” and
“Yes” responses toward automatic adaptation were
quite equally distributed; respondents’ opinions
about the question was quite neutral.
70 9
26 12 28
32 38 32
382
13 6 12
19 13 22
36 39 37
17 18 12
18 15 13
16 13 24
17 12 22
34 31 32
34 27 39
0 20 40 60 80 100 120
Male
Female
<=31
32-41
42-51
>=52
Specialist
Doctor
Medic/other
Very/fairly weak
Average
Fairly good
Very good
No
Don't know
Yes
Figure 1: Respondents’ expectations regarding automatic
personalization.
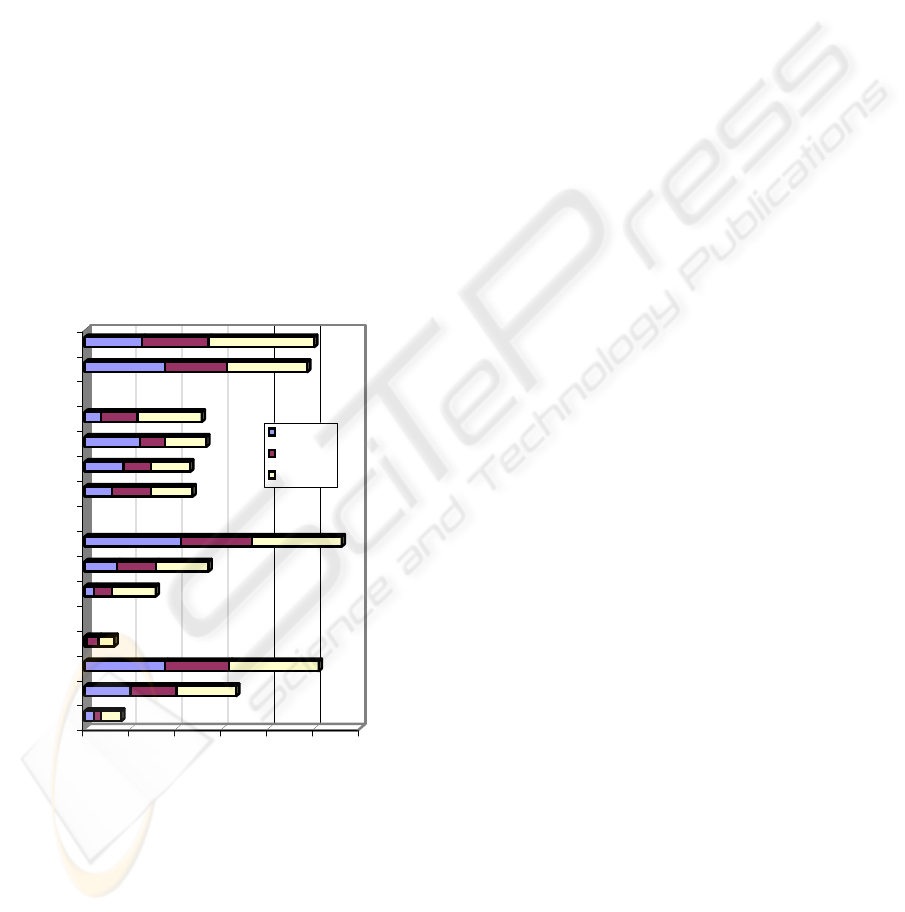
Secondly, we asked the respondents the question
“Would you like the most regularly-used services
concerning your special field to be displayed?”
Figure 2 shows that the majority of respondents
agree that the most regularly-used services related to
their special field should be on view. Moreover,
most of the respondents, who answered “Yes” were
specialists and they assessed their computer skills as
average. This may indicate that willingness to
receive information increases if the respondent feels
that the information on offer is related to their work
and tailored to their work requirements. On the other
hand this may indicate that respondents rely on
collaborative recommendations; they use the same
services as their colleagues have used. According to
cross tabulation followed by a Pearson Chi-Square
test there was no association between the variables
gender, age, occupation, expertise and displaying the
most regularly-used services concerned to own
special field.
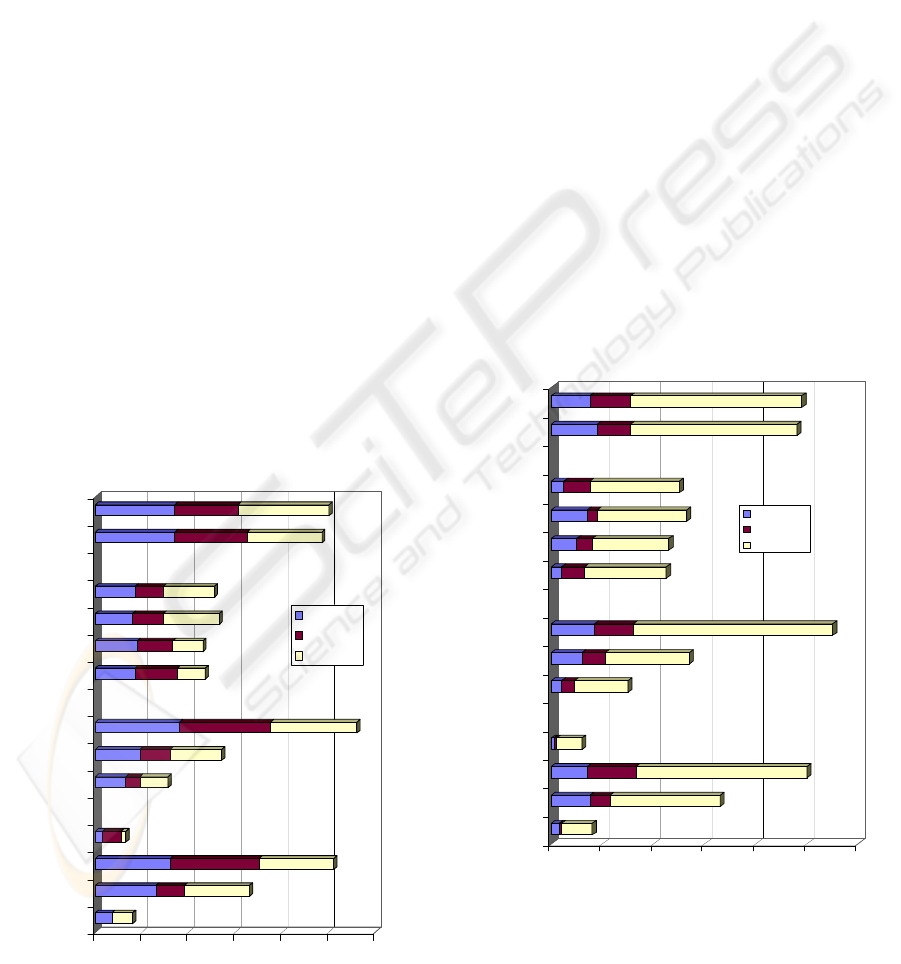
Thirdly, we asked the respondents: “Would you like
the most regularly-used services of all special fields
to be displayed?” Figure 3 shows that some
respondents in different classes would appreciate the
most regularly-used services of all special fields
being displayed.
31 12
15 8 43
14 19 67
1110
45 21
12 9 33
17 15 78
49 32
10 6 30
14 4 35
510 35
18 13 65
15 16 67
0 20 40 60 80 100 120
Male
Female
<=31
32-41
42-51
>=52
Special
Doctor
Medic/other
Very/fairly weak
Average
Fairly good
Very good
No
Don't know
Yes
Figure 2: Respondents’ expectations concerning the most
regularly-used services relating to their special field.
However, the degree of interest is clearly lower
than in the previous case (Figure 2). It is interesting
that in some classes the results were negative. For
ASSESSING THE USER ATTITUDE TOWARD PERSONALIZED SERVICES
201
example, in the age group 32-41 most of the
respondents (N=24) would not like these services to
be displayed. Similarly, most of the specialists
(N=42) would not like the most used services to be
displayed. The results below confirm the finding that
respondents are more interested in tailored services
which are related to their job and familiar to them.
Cross tabulation analysis followed by a Pearson
Chi-Square test indicated that there was association
between the age group and the displaying the most
regularly-used services of all special field (Pearson
χ
2
-value = 15.160, p = 0.019). There was also
relationship between the group occupation and
question posed (Pearson χ
2
-value = 9.775, p = 0.044)
and the expected frequencies were 0%, expected
minimum 8.81. According to our analysis there was
no relationship between other combinations.
Considering the figures, Figure 2 and Figure 3,
respondents hope for easy and quick access to
personalized work-related information, and clearly
appreciate depth of information (their own special
field) more than breadth of information (all special
fields).
43 9
20 20 26
35 28 39
15 7
48 19
14 17 23
42 31 39
12 17 18
17 12 17
24 11 18
716 28
35 27 35
25 29 46
0 20 40 60 80 100 120
Male
Female
<=31
32-41
42-51
>=52
Specialist
Doctor
Medic/other
Very/fairly weak
Average
Fairly weak
Very weak
No
Don't know
Yes
Figure 3: Respondents’ expectations concerning the most
regularly-used services relating to all special fields.
3.4 Respondents’ Attitude toward
Personalization
The analysis described in this section is twofold.
First we analyze the differences between the selected
groups toward the presented hypotheses by using T-
tests and analysis of variance. Secondly, we assess
responses to the presented hypothesis, from all of the
data.
Respondents’ attitude towards personalization
were studied by setting four hypotheses starting with
“In my opinion…”, using Likert seven-point scales
where 1 was “fully disagree”, and 7 “fully agree”.
The hypotheses below were aimed at examining the
users’ willingness to be involved in the
personalization process; that is, whether they want to
personalize the system themselves, or have
automatic personalization carried out by the system.
We were also interested in respondents’ attitude
towards personalization objects: whether the
respondents like to personalize layout and/or content
or not. For example, respondents’ attitude towards
carrying out layout adaptation themselves was
examined by setting the hypothesis “In my opinion,
it is important that I can make the site more personal
by editing the appearance (layout) of the service,
such as the color of the display”.
The selected variables we were interested in
included gender, age, expertise and occupation. In
the case of gender, we analyzed the responses by
using a T-test. By using Levene’s T-test, we
confirmed that the variances were equally
distributed. The results in Table 3 show that there is
not a significant difference in attitude toward
personalization between the appearance of the
service, content and gender The significance of the
variables age, occupation and expertise were tested
using one-way analysis of variance (One-Way
ANOVA). According to analysis there are no
significant statistical differences between in the
attitude toward personal adaptation of site layout and
the age, occupation and expertise groups. However,
in the expertise group F(3.193)=2.266, p=.082, it
seems that respondents with better computer
expertise are more willing to adapt the layout
themselves than respondents with weak expertise.
This may indicate that users with higher expertise
may have stronger beliefs concerning their abilities
and skills needed to execute the tasks ahead than
users with weaker expertise. Overall, considering the
whole data statistical distribution show that, 45.7 %
(N = 90) of the respondents have a negative (fully
disagree, disagree, disagree to some extent) attitude
regarding user adaptation of layout, 15.2 % (N = 30)
answered “Don’t know” and 39.1 % (N = 77) have a
positive (agree to some extent, agree, fully agree)
attitude toward the hypothesis. Total N = 197, mean
3.80 and standard deviation 1.521. Thus, most of the
respondents do not consider the option to adapt the
appearance of the site themselves to be important.
ICEIS 2007 - International Conference on Enterprise Information Systems
202

Table 3: Gender distribution regarding adaptation of layout and content.
Attitude toward personalization Gender N Mean Std. Dev t value Sig
In my opinion, it is important that I
can make the site more personal by
editing the appearance (layout) of
the service, such as the color of the
page.
Male
Female
100
97
Total
197
3.99
3.61
1.617
1.396
1.771
1.775
.078
In my opinion, it is important that I
can make the site more personal by
adapting the content of the service,
such as by selecting and deleting
content according to my own
preferences.
Male
Female
100
96
Total
196
4.46
4.23
1.540
1.395
1.098
1.100
.273
In my opinion, it is important for
the site to become more
personalized automatically
according to my usage, by adapting
the appearance (layout) of the
service, such as the color of the
page.
Male
Female
99
95
Total
194
3.75
3.39
1.561
1.339
1.711
1.717
.089
In my opinion, it is important for
the site to become more
personalized automatically
according to my usage, by adapting
the content of the service, such as
by selecting and deleting content
according to my own preferences.
Male
Female
100
97
Total
197
3.78
3.73
1.541
1.425
.227
.227
.821
3.5 Attitude toward Personalization:
Comparison between Two Field
Studies
The objective of this section is to compare
respondents’ responses from two field studies. Time
period between the studies was about one and a half
year. Respondents of the field studies were the users
of same personalized IS. In both studies the data was
collected using a Web questionnaire. The questions
that we are interested in were identical in both field
studies, and related to the desire for automatic
personalization and the level of available
personalized information. We carried out the
comparison by studying the differences between the
“Yes” and “No” responses, taking into consideration
male responses, female responses and total
responses.
A two-sample Z-test of proportion was used on
the study1 and study2, to reveal differences in
respondents’attitude toward personalization. The
statistical formula used in the two-sample Z-test for
proportion to compute the Z-test statistic (Vasama
and Vartia 1973; Zou, Fielding et al. 2003) can be
presented:
p
c
= (x
1
+ x
2
)/n
1
+n
2
, and the test statistic Z can be
presented:
Z =
)
11
)(1(
21
21
nn
pp
pp
cc
+−
−
,
where the observed numbers of successes are p
1
=
x
1
/n
1
(relating to the study1) and p
2
= x
2
/n
2
(relating
to the study2). x
1
(the study1) and x
2
(the study2) are
the numbers of successes and n
1
(the study1) and n
2
(the 2 study2) are the sample sizes.
When the test statistic Z is normally distributed,
the interpretation of statistical significance is based
on the location of the p- value within the normal
distribution table (Herva, Vartia et al. 1983) of Z.
Null hypothesis assume that there is no difference
between the group gender and in attitude toward
adaptation compared with the study1 and study2.
The null hypothesis is rejected at the significance
level p<0.05 if the test statistic Z exceeds the critical
values below –1.96 or above +1.96.
In study1, the number of relevant responses was
144. The number of male respondents was 87 and
female respondents 57, ranging from 22 to 67 years
of age. The majority of the respondents (56.3 %)
belonged to the age group 30-50 years of age. Most
ASSESSING THE USER ATTITUDE TOWARD PERSONALIZED SERVICES
203

of the respondents (64 %) were medical students,
followed by the groups “specialist” (10%), “other”
(24%) and “researcher” (2%). The results of the two-
sample Z-test of proportion are presented in Table 4.
With regard to the first question, Table 4 shows that
there is a significant difference (p
≤ 0.01), when
comparing all the responses, between the study1 and
the study2. There is no difference in the attitude of
the male respondents, whereas there is a significant
(p
≤ 0.01) difference in the “No” responses of the
female respondents between the study1 and study2.
As Table 4 shows, there are changes in female and
total groups in terms of the “Yes” and “No”
answers. In study1, respondents’ opinions about
automatic adaptation were more positive than in
study2. When the field study was conducted in
study1, the degree of personalization of the system
was not so sophisticated, therefore it could be that
respondents did not have a precise mental
impression of what adaptation or personalization
really means. Another explanation is, as shown
earlier, respondents with good expertise emphasized
automatic personalization less than respondents with
lower expertise. Thus in study2, respondents were
more familiar and skilful with the system, and they
were more able to interact with the system.
With regard to the second question, there are no
significant differences between responses in the
study1 and study2. Generally, changes in behavior
over a one and a half year period are minimal. On
the other hand, when considering the third question,
there are significant statistical differences in the
male group both in “Yes” responses (p
≤
0.05) and
in “No” responses (p
≤
0.05), when comparing the
study1 and study2. There are also statistically
significant differences in female responses, both
“Yes” (p
≤
0.05) and “No” (p
≤
0.05). The most
important difference is in total responses; both
“Yes” (p
≤
0.001) and “No” (p ≤ 0.001) are
statistically very significant. The direction of the
change is consistent with the first question. In
study1, respondents’ attitude toward the most-used
services of all special fields was more positive than
in study2. Considering the two preceding questions,
these findings support the hypothesis that there exist
some changes in respondents’ attitude towards more
tailored and focused information services. It could
be that the as the flow of information is increasing
all the time, people are willing to think what kind of
information they are willing to receive.
Table 4: Two-sample Z-test of proportion.
Question Gender
Resp
onse
x
1
n
1
p
1
x
2
n
2
p
2
Z
Male Yes 41 81 .506 39 100 .390 1.565
Female Yes 27 56 .482 32 97 .330
1.864*
Total Yes 68 137 .496 71 197 .360
2.479*
Male No 20 81 .247 34 100 .340 -1.361
Female No 8 56 .143 34 97 .351
-2.773**
Would you like the
medical portal to adapt
automatically according
to the services you have
used?
Total No 28 137 .204 68 197 .345
-2.797**
Male Yes 56 82 .683 67 98 .684 -.011
Female Yes 39 56 .696 65 96 .677 .248
Total Yes 95 138 .688 132 194 .680 .154
Male No 9 82 .110 15 98 .153 -.851
Female No 6 56 .107 18 96 .188 -1.311
Would you like the most
regularly-used services
concerning your special
field to be displayed?
Total No 15 138 .109 33 194 .170 -1.568
Male Yes 50 82 .610 46 100 .460
2.013*
Female Yes 34 56 .607 35 97 .361
2.950**
Total Yes 84 138 .609 81 197 .411
3.559***
Male No 12 82 .146 25 100 .250
-1.729
Female No 8 56 .143 35 97 .361
-2.889**
Would you like the most
regularly-used services of
all special fields to be
displayed?
Total No 20 138 .145 60 197 .305
3.373***
*p
≤
0.05, **p ≤ 0.01, ***p
≤
0.001
ICEIS 2007 - International Conference on Enterprise Information Systems
204

4 CONCLUSION
In this research we focused on users’ attitudes
toward personalization and their willingness to
intervene in personalized services. Results show that
respondents with fairly good or very good expertise
would like automatic personalization more than
respondents with weak or average expertise. It could
be that respondents with good expertise would like
to control the system more than respondents who do
not have such advanced computer skills. Secondly,
our results show that respondents are willing to
receive information that is related to their work and
tailored to their work requirements. When
examining users’ willingness to control
personalization we formulate a hypothesis; would
users prefer to intervene in personalization or to
allow the system to take of care personalization?
Most of the respondents do not consider adapting
the appearance themselves to be important. When
analyzing the respondents’ willingness in terms of
content adaptation, the results indicated that most of
the respondents considered it important that they
could adapt the content themselves. Considering the
whole data, the results revealed that the respondents
have a negative attitude towards automatic
adaptation of site appearance. When analyzing
respondents’ attitude towards automatic content
adaptation, no differences were found between the
groups. When comparing the field studies study1
and study2, the findings revealed that respondents’
attitudes had changed. One significant change was
toward more tailored and focused information
services. Thus, users are looking primarily to use
services which are closely adapted to their
occupation.
The results of the study suggest that users do not
consider automatic content adaptation and automatic
layout adaptation to be important. Nor do they
consider it important to be able to adapt the layout
themselves. It was surprising that the users did not
set great store by the visual impact of the IS. This
shows that users appreciate content above visual
impact. This result gives support to the findings of
Kramer and Noronha (2000). Overall, the
respondents accept personalization but they want to
adapt and personalize the content themselves. It
could be proposed that designers and/or managers
should construct the user interface with an “opt-in”
function, determining whether the users would like
the system to provide personalized services or not. If
users want personalized services, there should also
be an opt-in concerning whether they would like
automatic personalization or to select interesting
topics themselves.
REFERENCES
Baronas, A. and M. Louis (1988). "Restoring a Sense of
Control During Implementation: How User
Involvement Leads to System Acceptance." MIS
Quarterly 12(1): 111-124.
Brusilovsky, P. (1996b). Methods and techniques of
adaptive hypermedia. User Modeling and user
Adapted Interaction. 6: 87-129.
Chellappa, R. K. and R. G. Sin (2005). "Personalization
versus Privacy: An Empirical Examination of the
Online Consumer's Dilemma." Information
Technology and Management 6: 181-202.
Eirinaki, M. and M. Vazirgiannis (2003). "Web Mining
for Web Personalization." ACM Transactions on
Internet Technology 3(1): 1-27.
Herva, A., Y. Vartia, et al. (1983). Tilastollisia taulukoita.
Helsinki, Oy Gaudeamus Ab.
Hoffman, D. L., T. P. Novak, et al. (1999b). "Building
Consumer Trust Online. How merchants can win back
lost consumer trust in the interests of e-commerce
sales." Communication of ACM 42(4): 80-85.
Karat, C. M., C. Brodie, et al. (2003). "Personalizing the
user experience on ibm.com." IBM Systems Journal
42(4): 686-701.
Kobsa, A. (2002). "Personalized Hypermedia and
International Privacy." Communication of ACM
45(5): 64-67.
Kobsa, A., J. Koenemann, et al. (2001b). "Personalized
hypermedia presentation techniques for improving
online customer relationships." The Knowledge
Engineering Review. 16(2): 111-155.
Kramer, J., S. Noronha, et al. (2000). "A User-Centered
Approach to Personalization." Communication of
ACM 43(8): 45-48.
Manber, U., A. Patel, et al. (2000). "Experience with
personalization on Yahoo!" Communication of ACM
43(8): 35-39.
Mittal, B. and W. M. Lassar (1996). "The Role of
Personalization in Service Encounters." Journal of
Retailing 72(1): 95-109.
Mobasher, B., R. Cooley, et al. (2000). "Automatic
personalization based on Web usage mining."
Communication of ACM 43(8): 142-151.
Mulvenna, D. M., S. S. Anand, et al. (2000).
"Personalization on the net using Web mining."
Communications of ACM 43(8 ): 123-125.
Murthi, B. P. S. and S. Sarkar (2003). "The Role of the
Management Sciences in Research on
Personalization." Management Science 49(10): 1344-
1362.
Nielsen, J. (1998). "Personalization is over-rated."
Retrieved 01.02.2001, from
http://www.useit.com/alertbox/981004.html.
ASSESSING THE USER ATTITUDE TOWARD PERSONALIZED SERVICES
205

Nunes, P. F. and A. Kambil (2001). "Personalization? No
Thanks." Harvard Business Review 79(4): 32-34.
Pierrakos, D., G. Paliouras, et al. (2003). "Web Usage
Mining as a Tool for Personalization: A Survey." User
Modeling and User-Adapted Interaction 13: 311-372.
Resnick, P. and H. R. Varian (1997). "Recommender
Systems." Communication of ACM 40(3): 56-58.
Riecken, D. (2000). "Personalized views of
personalization." Communications of ACM 43(8
(August 2000)): 27-28.
Schonberg, E., T. Cofino, et al. (2000). "Measuring
success." Communication of ACM 43(8): 53-57.
Smyth, B. and P. Cotter (2000). "A personalized television
listings service." Communication of ACM 43(8): 107-
111.
Spiliopoulou, M. (2000). "Web Usage Mining for Web
Site Evaluation. Making a site better fit its users."
Communication of ACM 43(8): 127-134.
Tam, K. Y. and S. Y. Ho (2005). "Web Personalization as
a Persuasion Strategy: An Elaboration Likelihood
Model Perspective." Information Systems Research
16(3): 271-291.
Vasama, P.-M. and Y. Vartia (1973). Johdatus
tilastotieteeseen osa II, Oy Gaudeamus Ab.
Volokh, E. (2000). "Personalization and privacy."
Communication of ACM 43(8): 84-88.
Zemke, R. and T. Connellan (2001). E-service. New York,
AMACOM, American Management Association.
Zou, K. H., J. R. Fielding, et al. (2003). "Hypothesis
Testing I: Proportions." Radiology 226(3): 609-613.
ICEIS 2007 - International Conference on Enterprise Information Systems
206
