
DEVELOPING EXECUTABLE MODELS OF BUSINESS
SYSTEMS
Joseph Barjis
Georgia Southern University, P.O. Box 8150, Statesboro, GA 30460, USA
Keywords: Model checking, business process simulation, modeling method, Petri net application.
Abstract: Traditionally, business processes models are based on graphical artifacts that do not lend to model checking
or simulation, e.g., any Flow Chart like representation or UML diagrams. To check whether business
process models are syntactically correct, the models are either translated to other diagrams with formal
semantics or the validation is carried out manually. This approach poses two issues: first, models not lending
to execution (simulation) will hardly allow thorough insight into the dynamic behavior of the system under
consideration; second, when manual checking for small models may not be too difficult, it is almost
impossible for complex models. In this paper we investigate two research questions that resulted in a
method allowing to build executable business process models based on formal semantics of Petri net. The
proposed method is theoretically based on the Transaction Concept. The two questions further studied in
this paper concern graphical extension of Petri nets for business process modeling, and developing a
framework (guidelines) applying the proposed method.
1 INTRODUCTION
As organizations evolve and so do business drivers,
analysts use modeling as a multi-purpose tool from
understanding the operations of an existing
organization, to redesigning business processes,
studying impacts of planned changes, and IT-
Business alignment. An aspect that recently attracted
attention of many researchers is how to build models
that can be verified, validated, and checked using
computer tools. In practice, mostly these are
accomplished via simulation. But, in order to
conduct computer simulation, one needs to build
executable models based on well supported
formalism and semantics. In this paper, we further
explore the works resulted from the LAP (Language
Action Perspective) by Dietz (1994, 2006).
As evidenced from the literature, the business
process simulation area has attracted a huge interest
among researchers from diverse perspectives (to
name a few: Gladwin & Tumay, 1994; Hlupic &
Robinson, 1998; Harrison, 2002; Paul & Serrano,
2003; Vreede et al., 2003; Seila, 2005).
For a thorough analysis and study of business
processes, both modeling and simulation should play
in concert. Only modeling may not reveal sufficient
information about the processes. For significant
benefits and results with certain accuracy, business
process modeling should be complemented with
simulation. On the other hand, despite the abundance
of powerful simulation tools, simulation alone may
provide little help without profound conceptual
modeling preceding it. It would be like “expedition
without a map”. A valuable lesson extracted from
the practice of modeling and simulation suggests,
like expedition without a map, simulation without a
profound concept (conceptual model) is possible, but
it would be very hard, if not impossible, to achieve
accurate and precise results.
1.1 Business Systems as Social Systems
A distinctive and important feature of business
processes is their social nature – systems
encompassing human actors interacting and
collaborating to carry out tasks and fulfill the
mission of an organization. As such, business
processes are not merely a sequence of tasks, or flow
of physical materials, but a complex, collaborative,
and interactive phenomena, involving actors
communicating, negotiating, coordinating, and
agreeing upon certain tasks. The social nature of
business processes entails a fundamentally different
5
Barjis J. (2007).
DEVELOPING EXECUTABLE MODELS OF BUSINESS SYSTEMS.
In Proceedings of the Ninth International Conference on Enterprise Information Systems - ISAS, pages 5-13
DOI: 10.5220/0002369200050013
Copyright
c
SciTePress

perspective to perceive the reality of an organization
and the role (responsibility and authority) of its
members rather than the approaches used by
conventional methods. One such new perspective
was introduced in a framework referred to as the
Language Action Perspective (Winograd & Flores,
1986). The LAP perspective and its philosophical
stance inspired emergence of a number of modeling
methodologies and techniques such as SAMPO
(Lehtinen & Lyytinen, 1986; Auramäki et al., 1988),
Action Workflow model (Medina-Mora et al., 1992),
DEMO (Dietz, 1994), BAT (Goldkuhl, 1996), and
others. Since the main focus in these methodologies
is put on capturing communication acts and building
business process models, their underlying modeling
techniques do not result in models ready for
simulation (Rittgen, 2005). In order to simulate
these models, either an additional mapping schema
is developed or the models are translated into other
state-transition like diagrams, e.g., Petri net. In order
to develop simulation ready business process
models, this paper introduces a method and
discusses the business transaction concept as a
suitable framework for constructing business process
models of an organization. We have adopted Petri
net’s formal semantics and graphical notations from
the very beginning to avoid further translation that
had place in (Dietz & Barjis 1999; Dietz & Barjis
2000).
1.2 Contributions
In summary, our research and findings of this paper
provide the following contributions:
1) Executable models of business processes
based on the transaction concept derived from the
Language Action Perspective by Dietz. These
original works are mostly focused on producing well
defined and more detailed business process models,
so called, atoms, molecules and matter of
organizations. Our contribution is to make the
resulting models executable to help analysts with
model checking, validation, and studying impacts of
changes by testing different scenarios.
2) Compact models of complex processes using
the business transaction concept. Often in business
process modeling, analysts are either not interested
in all details, the process under study is too large to
be depicted at a detailed level, or the analysts may
spotlight part of the process and leaving other parts
concealed. In these situations, compact modeling
where certain activities are compressed into one well
defined component would be of highest interest.
3) The knowledge, generated as a result,
contributes to business process modeling,
simulation, modeling methodology, application of
modeling and simulation, and advancing the
discipline of modeling and simulation in an
organizational context.
2 EVALUATION OF THE
PROPOSED METHOD
Hevner et al. (2004) and Seila (2005) suggest that
graphical representation should be very simple,
intuitive and easily understandable, at the same time,
the accuracy and adequacy of such a representation
should not be compromised. Furthermore, Hevner et
al. (2004) suggest that methods deploying artefacts
should be evaluated using observational (e.g., cases
study) and experimental (e.g., simulation) methods.
In light of these recommendations, the proposed
method has been tested on both observational and
experimental bases. A dozen case studies have been
conducted using the proposed method. Some of
them purposefully were conducted with the
involvement of undergraduate students to not only
evaluate the method, but also its complexity and
mastering by only lightly trained analysts and
system designers. Then, each of the models was
simulated to check the correctness of the models.
One such case study is presented in this paper. To
complete the proposed method evaluation and its
capability to produce executable models for system
development, a simulation experiment will be
discussed towards the end of this paper.
As for the comparison of the proposed method
and its performance against widely accepted
conventional methods such as UML, EPC and other
Flowchart methods, the main distinction that should
be made is the fact that this method takes into
account social actors involved in the business
process – interaction of these actors through
communication and exchange of utterances
(conversation). It is a fully business process oriented
modeling method incorporating the social character
of organizations. Furthermore, in practice, most of
the business process models are checked via
translation to some sort of executable models. For
instance, UML activity diagrams are often translated
to Petri nets for checking (e.g., see Eichner et al.,
2005; Eshuis, 2006). Also a number of tools are
developed to translate UML diagrams to Petri net for
further simulation (e.g., P-UMLaut tool converts
UML 2 Activity and Sequence diagrams into high-
ICEIS 2007 - International Conference on Enterprise Information Systems
6
level Petri nets for further simulation and 3-D
animation). In this regard, the superior advantage of
the proposed method is its direct adaptation of Petri
net notations as a modeling technique. Thus analysts
do not need any translation and translation schema
that may, in turn, compromise the accuracy and
adequacy of modeling, or cause further
sophistication through the development of certain
procedures.
As for the modeling notations that compete with
Petri net, e.g. BPMN, EPCs, Role-Activity-
Diagrams, IDEF, UML, RIVA etc., the reason for
selecting Petri net is not only in its well-defined
semantics, logics and formalism, but also its
widespread use among researchers, practitioners and
academic disciplines. In addition, Petri net is
supported by a large number of tools for its analysis
and is extended for solving a variety of problems
(one such tool is used in this paper). As mentioned,
many of the models developed using the other
methods and techniques are eventually translated
into Petri nets for model checking or validation and
verification purposes.
3 BUSINESS TRANSACTIONS
In the proposed method, the core concept is of the
business transaction concept introduced within the
DEMO methodology (Dietz, 1994) and further
developed and discussed in (Dietz, 2006). What
follows is an illustrative introduction to the
transaction concept using artifacts and constructs
adapted by the authors. Readers, interested in more
in-depth study about the transaction concept, are
referred to the above cited original works by Dietz.
We have adapted the Petri net notations and
extended them as modeling constructs. Assuming
that readers are familiar with the basic concepts of
Petri nets that are widely used in systems analysis
and design, we skip their introduction. Interested in
Petri nets readers are referred to (e.g., Peterson,
1981; Reisig, 1985; Murata, 1989).
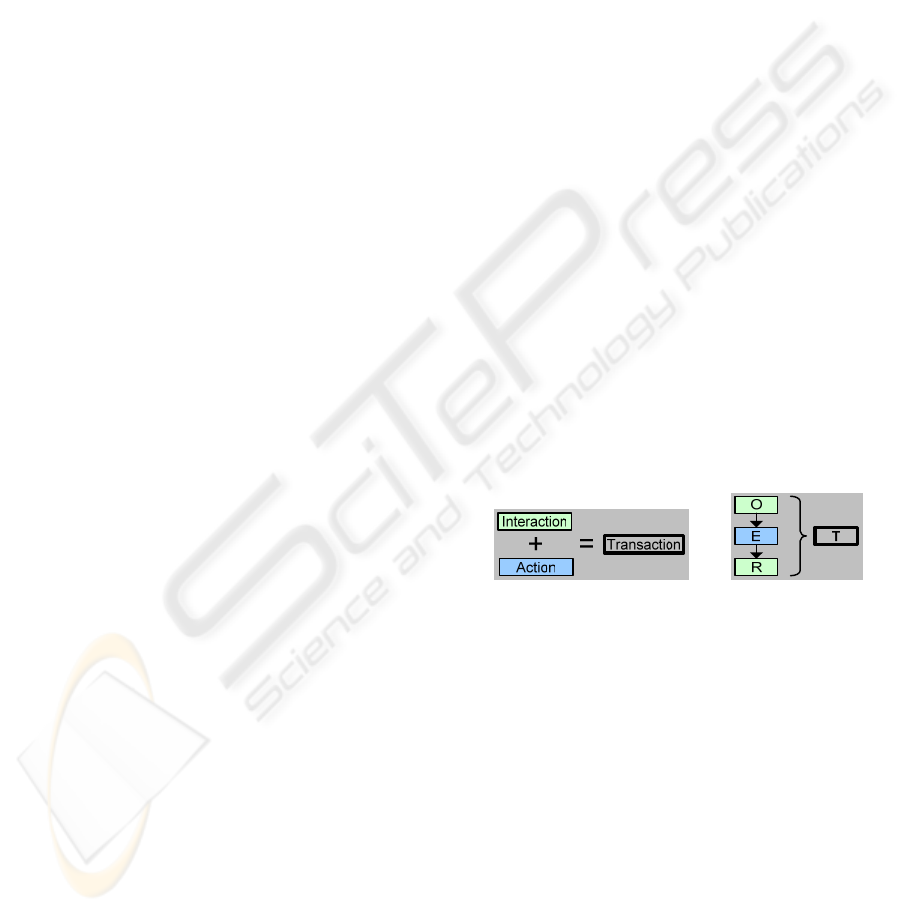
Transactions are patterns of interactions and
actions, as illustrated in Figure 1a. In the figure,
“action” and “interaction” are distinguished by
different colors. An action is the core of a business
transaction and represents an activity that brings
about a new result, changing the state of the world.
An interaction is a communicative act involving two
actors (actor roles) to coordinate or negotiate. An
example of an interaction could be “requesting a
new insurance policy”, clicking “apply” or “submit”
buttons in an electronic form, inserting a debit card
into an ATM to withdraw cash, or pushing an
elevator’s summon button. While replying to the
interacting actor or fulfilling their requests is an
action, e.g., “issuing a new policy” or “moving an
elevator to the corresponding floor.”
Each business transaction is carried out in three
distinct phases, the Order phase, the Execution
phase, and the Result phase. These phases are
abbreviated as O, E and R correspondingly (see
Figure 1b), and constitute the OER paradigm (Dietz,
1994). The figure illustrates a business transaction in
detailed OER form and compact transaction form
(T). Note that the order (O) and result (R) phases are
interactions and the execution (E) phase is an action,
therefore they are illustrated using different colors
(the Execution phase is represented by a rectangle
colored in blue (or gray in grayscale printout)).
These three phases are a distinct feature that entails
the discussed method as a business process
modeling technique versus just a process modeling.
Also, these three phases not only allow for the
boundary of an actor (or business unit) to be clearly
defined, but also to depict interaction and action as a
generic pattern involving (social) actors. Compared
to UML, Flowchart, EPC and other conventional
approaches, the transaction pattern clearly identifies
the actors involved as it is discussed below. In other
words, in all other conventional methods, a
transaction would be reduced to only one execution
phase omitting information about the relevant actors
and their role (authority and responsibility).
a) b)
Figure 1: Transaction: a) pattern of action and interaction;
b) sequence of three phases (detailed and compact).
Now, we try to introduce the further notions of
the transaction concept along with the Petri net
notations we adapted. In general, as depicted in
Figure 2, Petri net structure consists of places
(graphically illustrated by circles and representing
outcome of an activity or process), transitions
(graphically illustrated by rectangles and
representing an activity or process), and directed
arcs (graphically illustrated by arrows and
representing flow sequence).
Another notion of the transaction concept is the
role of actors involved in a transaction. Each
business transaction is carried out by exactly two
actors (or actor roles), see Figure 2a. The actor that
DEVELOPING EXECUTABLE MODELS OF BUSINESS SYSTEMS
7
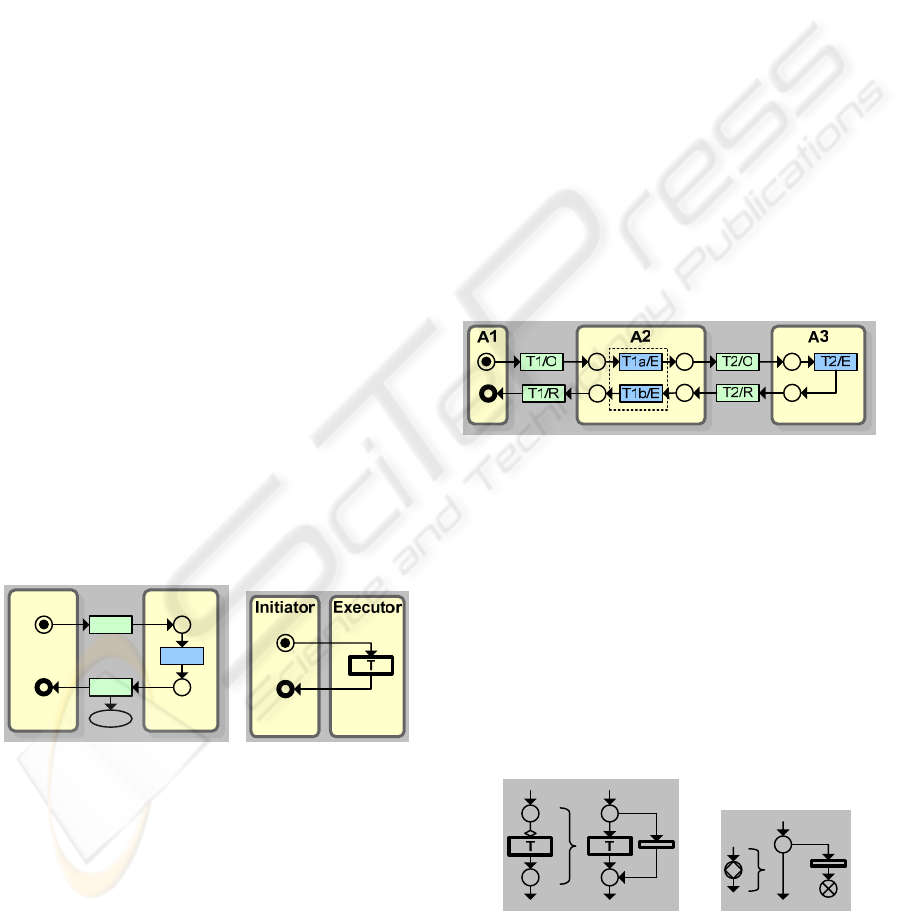
initiates the transaction is called the initiator of the
transaction, while the actor that executes the
transaction is called the executor of the transaction.
Since the Order (O) and Result (R) phases are
interactions between the two actors, their
corresponding transitions are positioned between the
two actors. The Execution (E) phase is an activity
solely carried out by the executor and, therefore, its
corresponding transition is positioned within the
confines (boundaries) of the executor. In case of
multiple actors, they will be conveniently denoted
by the letter A and numbered (A1, A2, A#).
In the figure, interactions between the two actors
are illustrated at a high level. In effect, each of the
two phases (O and R) may involve a series of back
and forth interactions (request, offer, counter offer,
negotiation, decline, etc.). A complete state-
transition schema for the “conversation for action”
can be found in (Winograd & Flores, 1986, p. 65)
and a “business transaction” in (Dietz, 2006, Chapter
10).
A transaction diagram should also represent how
the created result (outcome) is recorded. Since each
transaction brings about a new result, the Result
phase of a transaction is linked to an oval-shaped
element representing the new result created. For
simplicity sake, the depiction of the oval
representing a transaction result maybe omitted in
the models studied later. If a business transaction is
a simple one (not nesting further transactions), it is
better to compress its three phases into a compact
notation, see Figure 2b. In this case, the transaction
is placed within the boundary of the executing actor,
while the initiation and ending points are placed
within the boundary of the initiating actor.
a)
ExecutorInitiator
O
E
R
R
b)
Figure 2: A transaction diagram: a) detailed; b) compact.
A distinction is made between simple and
composite transactions. A complex collaboration
typically consists of numerous transactions that are
chained together and nested into each other. Simple
transactions do not involve, i.e. trigger or cause,
other transactions during their execution (like the
above figure). In composite transactions, on the
other hand, one or more phases will trigger further,
nested, transactions. For instance, think if actor A1
contacts actor A2 to reserve a hotel room (we denote
this request as Transaction 1, or T1). Actor A2
receives the request and checks the room
availability, but in order to complete the request, it
has to request for a payment guarantee (we denote
this second request as Transaction 2, or T2). For
actor A2 to complete the reservation task, first the
payment transaction should be completed. This
process is represented in Figure 3a in the form of a
nested transaction. Notice that the Execution phase
of T1 now has several sub-phases or interactions,
where each of the sub-phases is distinguished with a
letter of the alphabet attached to the transaction
number (e.g., T1a/E denotes “first sub-phase of the
Execution phase of Transaction T1”). The process
illustrated in the figure starts with the receiving of a
reservation request and checking the room
availability, then it waits for the payment transaction
to get completed, only then the Execution phase gets
completed, let say, by conveying a confirmation
number to the first actor. The process involves three
actors (or actor roles): A1 (customer or guest), A2
(hotel receptionist) and A3 (credit card company).
Figure 3: Nested transactions.
Another notion is of probability of some
activities – optional transactions. For indication of
optional transaction, a small decision symbol
(diamond shape) is attached to its initiation
(connection) point as illustrated in Figure 4a. In
order to transform this optional transaction construct
into standard Petri net, a traditional XOR-split that
could be modeled by one place that leads to two
transitions is used. It requires addition of a skip (or
dummy) transition as demonstrated in the figure
(tiny rectangle with no labels). A dummy transition
is meant that it has zero duration and no resources.
a)
b)
Figure 4: Standard Petri net representation of: a) an
optional transaction; b) a decision state.
ICEIS 2007 - International Conference on Enterprise Information Systems
8

Finally, there are situations that a process may
halt and result in a termination. For example, if there
is no room available, then the payment transaction is
not initiated at all. This situation is modeled through
a place identified as “decision state” graphically
represented via a circle with decision symbol
(diamond shape) within it, see Figure 4b. As it is
seen, for the transformation of a decision state into
standard Petri net semantics, a traditional XOR-split
that could be modeled by one place that leads to
proceed or stop is used. Depending on the value of
the state, the process either proceeds or terminates as
indicated by a place filled with a cross.
Through these few simplified constructs and
mini-models, we aimed to introduce how the
proposed method can capture typical situations in
business processes, provide sound concept based on
communication, and ultimately contribute towards
more accurate Business Process Modeling and
consequently more adequate IS Design, since the
models can be executed a number of times before it
is finalized.
Now that the basic ideas and constructs are
introduced, we discuss the underlying framework
(guidelines) deploying the proposed method, and
then we illustrate how this method can be applied to
a real world business system.
4 APPLICATION GUIDELINE
Based on practice and application experiments, the
following framework (guidelines) was developed.
This framework is diagrammatically illustrated in
Figure 5, in which both the process flow (block
arrows) and feedback loop (circled block arrow)
between the phases are depicted. As seen, this is an
iterative process where after each simulation and
output analysis, the model is refined, some
parameters are modified and the experiment is
repeated. It may be also required to return to earlier
phases (phase I or phase II) for missing pieces of
information, if the analysis reveals any flaws or
doubts. This is especially important when changes
occur for the system under consideration,
modifications must be made to the model, and the
change impact has to be studied. The entire process
consists of the following major phases.
Phase I – Big Picture: during this phase, an
organizational chart, profile and major business
processes are identified. Identification of the major
business processes virtually forms the “big picture”
of an organization. Also during this phase, scope
estimation is conducted – a major business process
(or processes) is selected where the main focus will
be directed. The perspective taken in this phase
considers an organization as a network of business
processes (BP). Methods used in this phase are
mainly the review of the corporate documents and
interview with the business manager if such
documentation is missing or they are presented in a
vague manner.
Phase II – Detailed Picture: During this phase,
each major business process of interest is described
to fill in the details of the “big picture” identified in
phase one and draw boundaries of organizational
units and rules. As a result, an analyst may describe
a series of interrelated business processes (BP1,
BP2, etc.). Methods used in this phase are mainly
based on interviews, observations and review of the
documented procedures.
Phase III – Modeling: For each specific major
business process of interest:
Step 1: Identification of business transactions.
For the elicitation of potential business transaction,
in this step, the Transaction Concept is used.
Step 2: Description of business transactions
(actors and results). For the description of business
transactions, in this step, the Transaction Concept is
used
Step 3: Construction of a model using artifacts
(graphical notations). In this part the proposed
notations are used to construct models of business
processes under study.
Phase IV – Simulation (Validation): Using the
business manager’s feedback and input combined
with (animated) simulation the model(s) is validated.
Once the model is validated, its behavior is studied
through the simulation runs. In this phase,
simulation tools are used to execute the models
constructed, and the results as well as the animated
models are validated with the business owners.
Figure 5: An application framework (guidelines).
Phase V – Analysis & Improvement: Based on
the results of simulation, the model is analyzed in
DEVELOPING EXECUTABLE MODELS OF BUSINESS SYSTEMS
9

respect to alternative scenarios (statistical analysis).
At this stage analysts may suggest improvements in
the form of redesigning business processes. In this
phase, using the statistical analysis methods, the
simulation outcomes are analyzed and compared
with alternative scenarios.
In the following section, we follow this
framework to report on a case study.
5 CASE STUDY: PHARMACY
The case study reported here is not intended to be
exhaustive, it is a simplified version. It is aimed to
demonstrate how the proposed method is capable of
capturing the dynamic behavior of business
processes and serve as an input for simulation. This
case study was conducted at a time when a
Pharmacy was planning to acquire and implement a
new system and extend its business with e-
commerce. This case study was assumed to provide
an insight and help to understand the Pharmacy’s
operations and requirements for a new system.
5.1 Prescription Filling Process
Upon arrival at the Pharmacy a patient proceeds to
the pharmacy counter and requests prescription
refilling by submitting their prescription to the
pharmacists or technician. The technician asks if the
patient is an existing customer to access their profile
information which should be already in the
QuickScrip’s database. If it is a new patient, the
technician asks the patient to fill out a short
information sheet (name, address, insurance or
medicine coverage). After selecting the correct
medicine, the software automatically checks the
current medicine for interactions with prescriptions
the patient is currently taking. The user is alerted if
any interactions are found and the patient or the
patient’s doctor can be informed. The user is then
asked by the software if they would like to transmit
a claim to the patient’s insurance company, if one
has been provided to the database. If a patient has no
insurance coverage, a cash price is assigned to the
prescription. Once a claim has been transmitted to
the patient’s insurance company via the internet, a
price is assigned to the prescription based upon the
company’s response. The computer generates a label
and sends the information to the ‘robot’ for
automatic filling. The medicine is dispensed into a
pre-selected bottle and counted using a laser and
gear system which places the medicine into the
bottle. A conveyer belt sends the prescription out for
a final check by a pharmacist. Once verified, the
prescription is bagged and then sent out to the
cashier for pick-up by the patient. The entire process
normally takes no more than 10-15 minutes. At the
pick-up counter, the patient signs for their
prescription and pays the cashier or charges the cost
of the medicine to a personal charge account which
is part of QuickScrip’s billing function. The end of
this process is related to inventory control that must
be accurately maintained because QuickScrip uses
an automated ordering system. We skip the details of
this process due to space restrictions.
5.2 Identification of Business
Transactions
The process of “Prescription Filling” starts when a
patient presents a prescription to be filled. Thus, the
first transaction (T1) is “prescription filling”.
Actually, this is a super transaction that nests many
other transactions. This transaction is initiated by a
“patient” and executed by the “pharmacist”. The
result of this transaction is a filled prescription. In
this manner we identify all other transactions:
T1:
Initiator:
Executor:
Result:
prescription filling
patient
pharmacist
prescription is filled
T2:
Initiator:
Executor:
Result:
creating profile
pharmacist
patient
profile is created
T3:
Initiator:
Executor:
Result:
checking medicine interaction
pharmacists (software agent)
QuickScrip
interaction is checked
T4:
Initiator:
Executor:
Result:
claim processing
pharmacist
insurance company
claim is processed
T5:
Initiator:
Executor:
Result:
automatic dispensing
pharmacist
robot
medicine is dispensed into bottle
T6:
Initiator:
Executor:
Result:
paying for the medicine
pharmacist
patient
medicine is paid
Now, we build a detailed model as shown in
Figure 6. By disclosing Transaction T1 (splitting its
three phases), all other nested transactions are
revealed. It also shows that once medicine is issued
(T1/R), the inventory control process is activated. As
ICEIS 2007 - International Conference on Enterprise Information Systems
10
the inventory control process is out of the scope,
which itself is a network of transactions, we just
illustrate it as a composite transaction (T#).
Within the scope of our model, only Transaction
T1 is a composite transaction and, therefore, we
decompose it. All other transactions (T2, T3, T4, T5
and T6) are simple transactions and, therefore, they
are shown in a compact form.
Figure 6: Pharmacy model (constructed with MS Visio).
In the above figure, the Pharmacy is considered
as a composite actor delegating the role of a few
other actors such as “pharmacist”, “technician”,
“robot” and “software agent” for checking medicine
interaction. In order to better understand the above
figure, it should be read from left to right and from
the top to down, just as the arrows indicate. It would
be easier if the reader has a list of the transactions,
previously identified, ready when reading the model:
The patient requests prescription filling (T1/O) and
with this request the execution by a pharmacist or
technician starts (T1a/E). If it is a new patient, the
technician requests them to fill in a form to create a
new profile (T2). This is an optional transaction
indicated with a small diamond-shape at the
connection point. Then, within the pharmacy system
(QuickScrip), a request is made to check the current
medicine for any interaction (T3) (if an interaction is
detected, the process terminates here). Through an
online application, the claim for this medicine is
transmitted to the patient’s insurance company to
define the price of the medicine (T4), if the patient is
covered by an insurance plan. Then the robot is
instructed to fill in the prescription (T5). At this
point the patient is requested to make their portion of
the payment or arrange for later billing (T6), and
only then the medicine is issued to the patient and
the process is completed (T1/R). Notice, the
completion of this process triggers a transaction in
the inventory control process (T#) making sure the
issued medicine is subtracted from the inventory and
checks if this medicine should be ordered for
restocking.
5.3 Simulating the Pharmacy Model
The model presented in the previous section was
based on MS Visio software using a designed
stencil. In order to execute this model, a vast
majority of Petri net tools can be used, but, none of
the tools, we have access, allows the import of MS
Visio diagrams. Therefore, one needs to reproduce
the model using the graphical editor of the tool used.
We do this for two reasons: to check the model
(detect deadlocks), and visualize its execution
through token game animation.
We used HPSim tool (http://www.winpesim.de/,
checked on November 25, 2006) that provides its
own graphical editor to construct a model. A
screenshot of the pharmacy model is shown in
Figure 7. The diagram is identical to the one
constructed with MS Visio except for three
elements: T2 is an optional transaction that should
be represented in a standard place-transition format
using the equivalent we discussed and illustrated
earlier; T3 is followed by a decision state which
requires a place-transition equivalent, similar to the
optional transaction schema; T4 is also an optional
transaction which is substituted by its place-
transition equivalent.
Figure 7: Screenshot of simulation modeling.
The screenshot is taken after a simulation
experiment is conducted. The model generated 100
tokens each representing a patient (100 simulation
runs) to check the model, to study if all the states are
reached and all the transitions are executed, and if
there is any deadlock. There are only three terminal
DEVELOPING EXECUTABLE MODELS OF BUSINESS SYSTEMS
11

places (when a medicine is issued, when the
inventory is updated, and when a drug interaction is
detected). The numbers in these three places show
how many times each of the corresponding events
has occurred. Actually these events together should
make up the total number of generated entry tokens.
Since the inventory is updated every time a medicine
is issued, their corresponding places duplicate the
same number of occurrences.
Our purpose in this paper was simply to
demonstrate how executable models of an enterprise
can be developed. It is just a starting point for many
possible research directions and applications. For
more complex investigations, analysts can use other
Petri net tools such as CPN Tool widely used within
the Petri net community. For more business or non-
technical friendly representation, the Arena™
animated simulation tool can be used.
6 CONCLUSION
In this paper we have studied how business process
models can be designed in a fashion easily lending
to execution (simulation). By executing models,
analysts can better conduct model validation and get
insight into the dynamic behavior of systems. In
addition, the paper outlined a framework that serves
as a guideline to apply the proposed method as a
step by step analysis, covering most of the phases
involved in system study. It starts from a description
of business process in a natural language, leads to
the identification of business transactions and actors
involved, and ends with executable models. This
approach provides a tool for the optimization of
processes via comparison of different scenarios.
However, when the method and the resulting
models were discussed with users, it was established
that Petri net based models seem challenging to
understand. We found that this issue can be
surmounted by using more animation. Even a token
game (when in a Petri net model movement of token
from input places to output places are animated) can
ease understanding of the models and make them
more attractive. But, using more advanced
simulation tools that provide cartoons to illustrate
entities would make the models more realistic for
any group of users.
Finally, only complex real life systems study can
prove how vigorous a method is. Thus, one of the
objectives of our ongoing future research is to apply
the method to more complex business systems with
emphasis on inter-organizational interactions.
REFERENCES
Auramäki E, Lehtinen, E., Lyytinen, K. (1988). A Speech
Act Based Office Modeling Approach. ACM
Transactions on Office Information Systems, Vol. 6,
No 2, pp. 126-152
Dietz J L G (1994). Business Modeling for Business
Redesign. Proceedings of the 27th Hawaii
International Conference on System Sciences, IEEE
Computer Society Press.
Dietz J.L.G., & Barjis J. (1999). Supporting the DEMO
Methodology with a Business Oriented Petri Net. In
the proceedings of the International Workshop
EMMSAD’99, Heidelberg, Germany, June 14-15,
1999
Dietz J.L.G., & Barjis J. (2000). Petri Net expressions of
DEMO process models as a rigid foundation for
Requirements Engineering. In the proceedings of the
2nd International Conference on Enterprise
Information Systems (ICEIS'00), Stafford, UK, 4-7
July 2000, pp. 269-274
Dietz, J.L.G. (2006). Enterprise Ontology –Theory and
Methodology. Springer, ISBN: 3-540-29169-5
Eichner, C., Fleischhack, H., Meyer, R., Schrimpf, U.,
Stehno, C. (2005). Compositional Semantics for UML
2.0 Sequence Diagrams Using Petri Nets. SDL Forum
2005: 133-148.
Eshuis, R. (January 2006). Symbolic Model Checking of
UML Activity Diagram. ACM Transactions on
Software Engineering and Methodology, v. 15, No. 1
Gladwin, B., & Tumay, K. (1994). Modeling Business
Processes with Simulation Tools. In the Proceedings
of the 1994 Winter Simulation Conference, Lake
Buena Vista, FL, Dec. 11-14.
Goldkuhl, G. (1996). Generic business frameworks and
action modeling. In the Proceedings of Conference
Language/Action Perspective ’96, Springer Verlag.
Harrison, J.R. (2002). Organisational Processes.
Simulation Modeling Practice and Theory, 10: 249-
251
Hevner, A.R., March, S.T., Park, J., & Ram, A. (March,
2004). Design Science in Information Systems
Research. MIS Quarterly, vol. 28 No. 1, pp. 75-105.
Hlupic, V., & Robinson, S. (1998). Business Process
Modeling and Analysis Using Discrete-Event
Simulation. In the Proceedings of the 1998 Winter
Simulation Conference.
Lehtinen, E., Lyytinen, K. (1986). Action Based Model of
Information System. Information Systems, v. 11, No. 4
Medina-Mora R., Winograd T., Flores R., & Flores F.
(1992). The Action Workflow Approach to Workflow
Management Technology. In the Proceedings of the
Conference on Computer-Supported Cooperative
Work, ACM Press
Murata,T. (1989). Petri Nets: Properties, Analysis and
Applications. Proceedings of the IEEE, v. 77, No 4.
Paul, R.J., & Seranno, A. (2003). Simulation for Business
Processes and Information Systems Design.
Proceedings of the 2003 Winter Simulation
Conference. New Orleans
ICEIS 2007 - International Conference on Enterprise Information Systems
12

Peterson, J. L. (1981) Petri net theory and the modeling of
systems. Prentice-Hall, Inc., Englewood Cliffs, NJ.
Reisig,W. (1985). Petri Nets, An Introduction. EATCS,
Monographs on Theoretical Computer Science,
W.Brauer, G. Rozenberg, A. Salomaa (Eds.), Springer
Verlag, Berlin.
Rittgen, P. (2005). Language Action-Based Simulation of
Business Processes. The 10th Anniversary
International Working Conference on the Language-
Action Perspective on Communication Modeling.
Kiruna, Sweden, June 19 – 20.
Seila, A.F. (2005). The case for a standard model
description for process simulation. International
Journal of Simulation and Process Modeling, 2005 -
Vol. 1, No.1/2 pp. 26 – 34
Vreede, G.J. de; Verbraeck, A.; Eijck. D.T.T. van (2003)
"An Arena Simulation Library for Business Process
Modeling". Simulation, Vol 79, No. 1, pp. 35-42.
Winograd, T.; Flores, F. (1986). Understanding
Computers and Cognition: A New Foundation for
Design. Ablex, Norwood.
DEVELOPING EXECUTABLE MODELS OF BUSINESS SYSTEMS
13
