
RELATIONSHIP BETWEEN THERMAL PERCEPTION AND
MECHANICAL CHARACTERISTICS ON A PALM
Aiming at Developing a Communication Support Device for the Deaf-Blind
Chikamune Wada, Kuranosuke Sako and Hiroshi Horio
Graduate School of Life Science and Systems Engineering, Kyushu Institute of Technology, Hibikino 2-4
Wakamatsu, Kitakyushu, Japan
Keywords: Deaf-blind, tactile display, mechanical characteristics, thermal perception.
Abstract: Our final goal is to develop a portable display which will enable the deaf-blind to character on the palm
through the use of tactile sensations. We propose the use of thermal stimulation as the tactile sensation,
because in this way small-sized and lightweight devices can be developed. However, it might still be
impossible to capture continuous movement, which is necessary to recreate characters on the palm. In past
research, we found that thermal perception is dependent on the palm position. Therefore, in this study, we
investigated the cause of this position dependence by comparing the skin’s thermal perception and its
mechanical characteristics.
1 INTRODUCTION
Since the deaf-blind suffer from both visual and
auditory impairment, it is easy to understand the
communication difficulties that arise due to this
affliction.
In this research, we tried to create a device that
can facilitate effective communication among the
deaf-blind and the non-disabled.
Since schools throughout Japan teach both the
deaf and the blind to write phonetic symbols known
as “kana,” most Japanese deaf-blind are familiar
with this standard Japanese writing system. Then,
some deaf-blind use a communication method which
is writing characters on the palm of their hand using
a finger. Therefore, we thought this could provide
the basis for a communication device that can be
used among deaf-blind.
Generally speaking, a person's finger moves
continuously when a kana is written on the palm.
Needless to say, it will be easy to transmit a shape of
kana by using a kind of pin tactile display for the
blind (Itoh, Sakai and Sakajiri, 2003). However, we
think the stroke order of writing kana is important to
let the deaf-blind know kana. Then, our goal is to
develop a portable display which enables a person to
write kana on the palm through the use of tactile
sensations (Wada and Wada, 2003.). Although this
finger movement can be reproduced by using a XY-
stage, it is not possible to carry such a stage because
of its size and weight. To resolve this drawback, we
surmised that a portable display can be realized by
making use of a Peltier element, which is both small
and light. However, even if the elements were
arranged, it might still be impossible to recreate
continuous movement of tactile stimulation on the
palm. Instead, we supposed that continuous
movement can be realized using the apparent motion
phenomenon.
In previous research (Horio and Wada, 2005), we
investigated the optimal condition under which
thermal stimulation of a Peltier element causes
apparent motion. However, some subjects could not
perceive the apparent motion. We hypothesized that
this was due to the individual differences in the
characteristics of thermal stimulation reception.
Incidentally, it was difficult to measure the thermal
stimulation reception while it was easy to measure
mechanical characteristics of skin. Therefore, we
would like to make a model by which thermal
stimulation perception will be able to be estimated
by mechanical characteristics.
In this study, we chose response time to cold
sensation and mechanical impedance as a parameter
of thermal stimulation perception and mechanical
characteristics, respectively. Then, we investigated a
relationship between the response time and
mechanical impedance.
307
Wada C., Sako K. and Horio H. (2008).
RELATIONSHIP BETWEEN THERMAL PERCEPTION AND MECHANICAL CHARACTERISTICS ON A PALM - Aiming at Developing a Communication
Support Device for the Deaf-Blind.
In Proceedings of the First International Conference on Bio-inspired Systems and Signal Processing, pages 307-310
DOI: 10.5220/0001070103070310
Copyright
c
SciTePress
2 MEASUREMENT OF
RESPONSE TIME
2.1 Experimental Setup
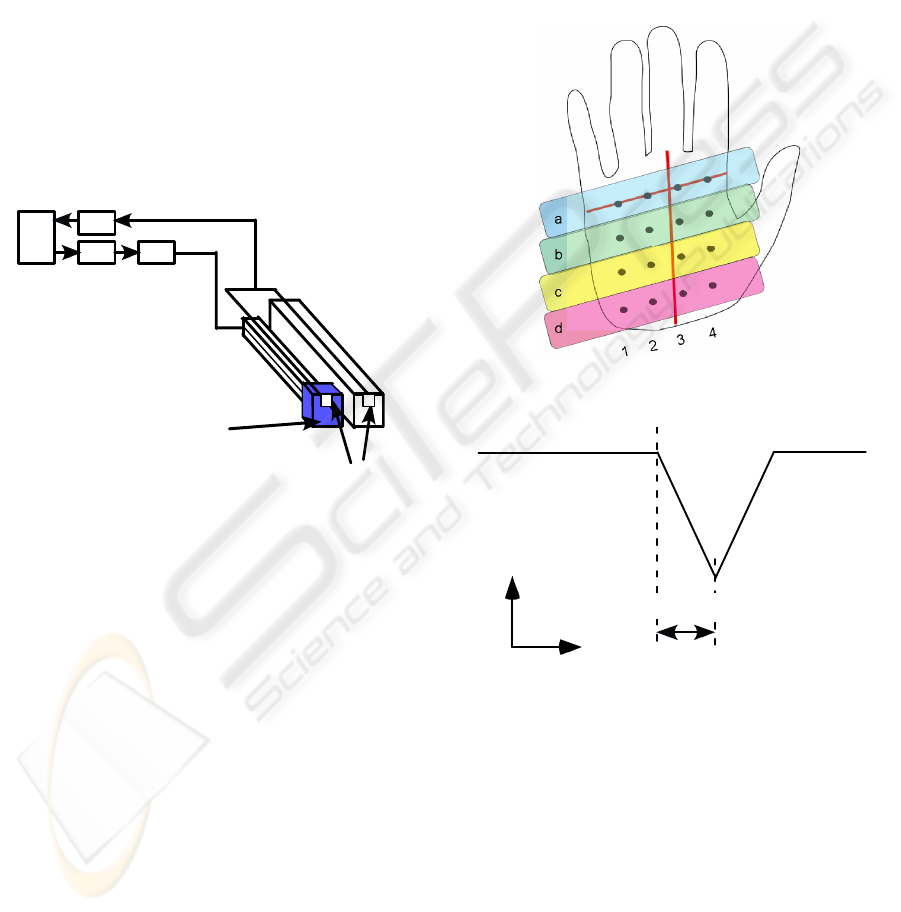
Figure 1 illustrates the outline of our experimental
setup. Peltier elements (8.3 mm*8.3 mm*2.4 mm)
were used to induce thermal stimulation. These
elements were connected to a computer through a
D/A converter and an amplifier. The thermal
stimulation was controlled by the computer. Two
thermocouples were used to measure the
temperature: one was attached to the Peltier element
to measure its temperature, while the other was
attached to the palm to measure the skin surface
temperature. The thermal data from the
thermocouples was directly inputted into the
computer through an A/D converter.
2.2 Experimental Procedure
The right palm was thermally stimulated. The palm
length and hand breadth were measured, and the
palm was divided into 16 parts (Fig. 2). The
assigned number and alphabet indicates the place
where thermal stimulation was induced. Figure 3
shows the thermal stimulation pattern. The vertical
axis indicates the temperature of the Peltier element,
while the horizontal axis indicates the elapsed time.
Before the start of the experiment, the temperature
of the Peltier element was adjusted to the same
temperature as the subject's skin surface. The
environment temperature was between 25 and 28
degrees Celsius. The subjects were six males, 22 to
25 years of age. The trial was repeated 10 times for
each subject. The subjects wore earplugs and
eyeshades in order not to hear environmental noise
and see.
When the Peltier element surface reached the same
temperature as the palmar skin surface, the element
was placed on the palm. After a while, the
temperature of the Peltier element decreased. The
ratio of temperature decrease of the Peltier element
was -5.5 degrees Celsius per second.
The subjects were asked to push a switch when
they felt that the Peltier element had become cold
(“Stop” in Fig. 3), after the temperature of the Peltier
element started to decrease (“Start” in Fig. 3). The
time interval between “Start” and “Stop” was
measured. This time interval was named the
“Response time.”
Figure 2: Stimulation points.
2.3 Results and Discussion
Figure 4 shows the average results for all subjects.
The vertical axis shows the response time in seconds
while the horizontal axis shows the stimulation
points.
As Figure 4 shows, the response time was different
for each stimulation point and about 1 second. Next,
we calculated the deviation value for all response
time in order to standardize the data. Table 1 shows
the results for the deviation value of response time.
When the response time was mean, the standardized
Figure 3: Stimulation pattern.
Temperature
Time
Sto
p
Star
t
Response time
PC
A
D
DA AMP
Figure 1: Experimental setup.
Peltier element
Thermocouples
BIOSIGNALS 2008 - International Conference on Bio-inspired Systems and Signal Processing
308
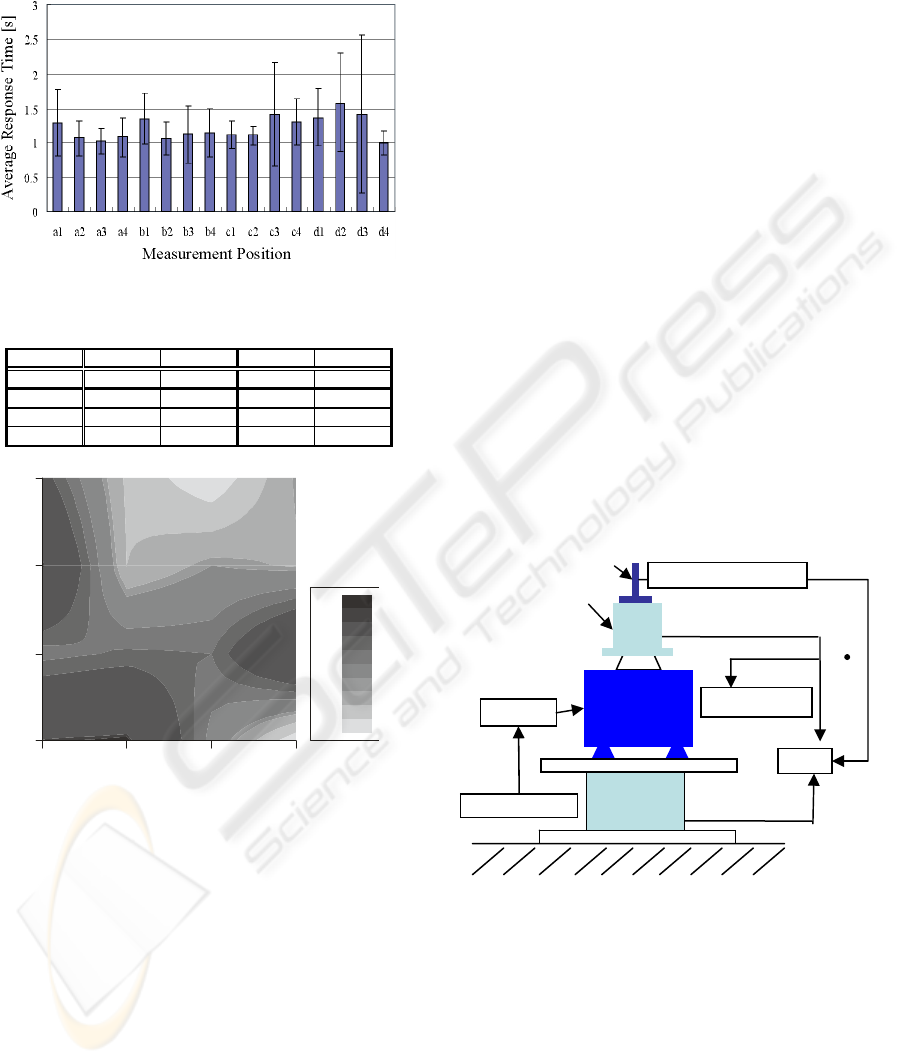
value was 50. If the value was larger than 50, it
meant the response time was longer than the mean
and vice versa.
Figure 4: The response time.
Table 1: Standardized response time.
12
3
4
a 47.938.234.740.7
b 53.738.641.140.3
c 44.445.645.253.3
d
53
.
5
5
4.
0
42.
9
3
4.
8
36.5
38.6
40.5
41.1
43.6
45.2
46.8
53.3
53.6
a
b
c
d
12
3
4
Figure 5: The standardized response time in contour graph.
Figure 5 shows the contour graph of standardized
response time. From figure 5, it was found that the
response time was short on position “a” and central
area of palm. And it was also found that the response
time was long on peripheral area of palm.
3 MEASUREMENT OF
MECHANICAL IMPEDANCE
3.1 Experimental Procedure
The palmar mechanical impedance can be found
from the power and the acceleration caused when
the palm is vibrated at various frequencies.
Therefore, we devised an experimental setup capable
of inducing the vibration of the skin. We used a
small vibrator, and measured the power and
acceleration by means of an impedance head. The
mechanical impedance of the skin was measured
with the measurement setup shown in Figure 6. The
vibrator outputted a sine wave vibration, and the
vibration was relayed to the palm through the
impedance head and the contactor pin. We used 15
measurement frequencies: 80, 100, 150, 200, 250,
300, 350, 400, 450, 500, 600, 700, 800, 900 and
1000 Hz. A touch sensor was used to confirm that
the palm touched the contactor pin. The same
subjects in chapter 2 participated in this experiment.
The subjects touched the pin with the palm of the
right hand. When the pin touched the palm, the
vibrator made the skin vibrate. The subjects were
asked to control the pressure of their palm on the
contactor pin by watching the output of the load cell.
The power with which the skin pushed the pin was
set to 50 gf. During the experiment, the subjects
were asked to simply place their palm onto the
contactor pin. The impedance of the palm was
measured by the impedance head, and the data were
inputted into a computer. The measurement was
made as described in chapter 2 (Fig. 2).
Figure 6: Mechanical impedance measurement device.
3.2 Results and Discussion
From the analyses of mechanical impedance, we
divided them into two categories. The typical
patterns of each category were shown in Figures 7
and 8. Figures 7 and 8 show the average results for
all subjects at stimulation point a2 and d2,
respectively. The vertical axis shows the impedance.
The horizontal axis shows the frequency in Hz. The
lower part of those graphs shows the imaginary part
Impedance head
Contacto
r
pin
Oscillato
r
Amp
Vibrato
r
Load cell
Oscilloscope
PC
Static force
Touch senso
r
Force, Acceleration
RELATIONSHIP BETWEEN THERMAL PERCEPTION AND MECHANICAL CHARACTERISTICS ON A PALM -
Aiming at Developing a Communication Support Device for the Deaf-Blind
309
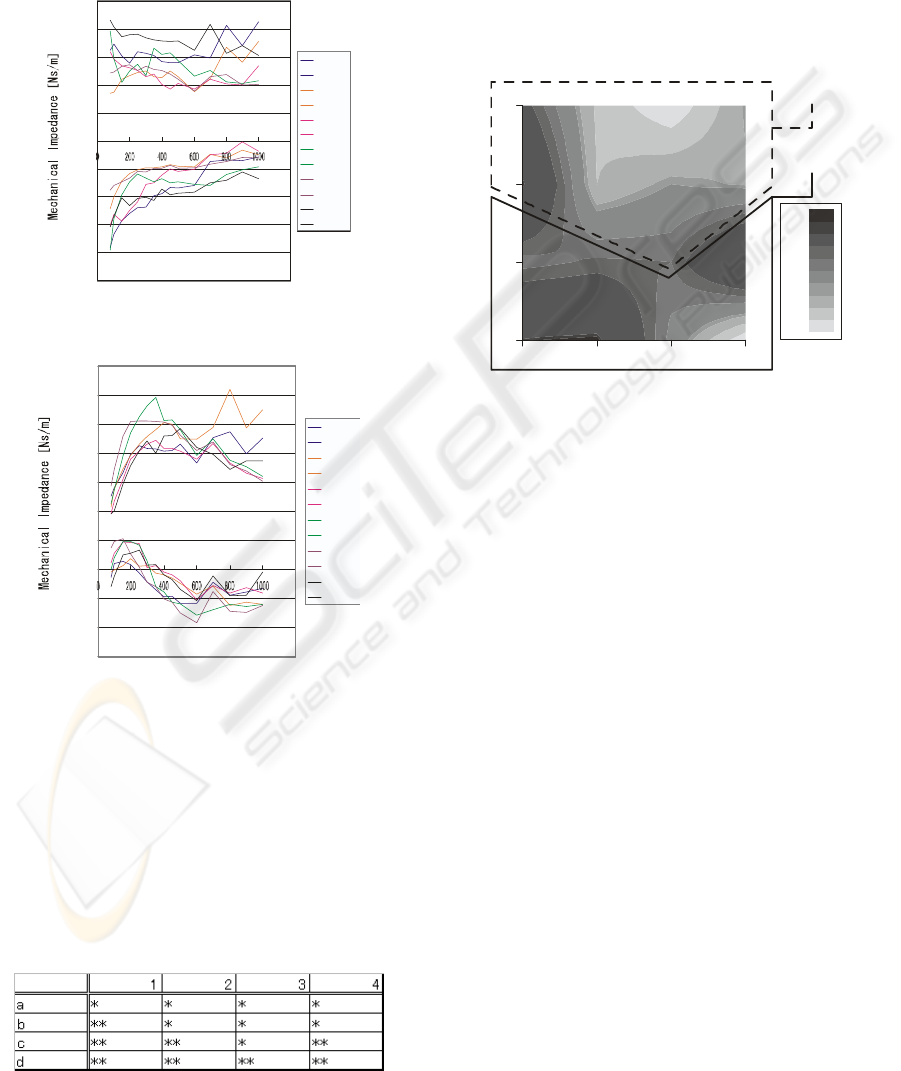
of the impedance. The upper part shows the real part
of the impedance.
Figure 7 shows that the value of imaginary part
increased as the frequency increased. We called this
pattern #1. On the other hand, the value of imaginary
part increased and decreased as the frequency
increased in figure 8. We called this pattern #2.
-2.5
-2.0
-1.5
-1.0
-0.5
0.0
0.5
1.0
1.5
2.0
2
.
5
Re A
Im A
Re B
Im B
Re C
Im C
Re D
Im D
Re E
Im E
Re F
Im F
Fr e
q
uenc
y
[
Hz
]
Figure 7: The impedance change (pattern #1).
-1.50
-1.00
-0.50
0.00
0.50
1.00
1.50
2.00
2.50
3.00
3
.5
0
Re A
Im A
Re B
Im B
Re C
Im C
Re D
Im D
Re E
Im E
Re F
Im F
Fr e
q
uenc
y
[
H
z
]
Figure 8: The impedance change (pattern #2).
Table 2 shows the categorized results for all
stimulation points. One-asterisk shows that pattern
#1 change was obtained in the stimulation point,
while two-asterisks shows pattern #2. From table 2,
it was found that the pattern #2 was obtained on
peripheral palm where the hand was relatively thick
and the pattern #1 was obtained on relatively thin
part.
Table 2: Position dependence of impedance change.
3.3 Comparison between Response
Time and Mechanical Impedance
Figure 9 shows the combination between figure 5
and table 2. From figure 9, it was found the response
time was relatively short at the area of pattern #1,
while the response time was relatively long at the
area of pattern #2. There seemed to be a relationship
between response time and mechanical impedance.
Therefore, we hypothesized that the response time
could be obtained by using mechanical impedance.
36.5
38.6
40.5
41.1
43.6
45.2
46.8
53.3
53.6
a
b
c
d
1234
Pattern #1
Pattern #
2
Figure 9: Comparison between response time and
mechanical impedance.
4 CONCLUSION
We investigated the relationship between response
time and mechanical impedance in this paper. In the
near future, we are planning to make an energy
conductive model by using mechanical
characteristics in order to estimate thermal
stimulation response.
REFERENCES
Horio, H., & Wada, C., 2005. Basic research into the
development a Deaf-Blind communication device
based on the use of thermal apparent motion, SICE
Annual conference 2005, 348-352.
Itoh, K., Sakai, T., & Sakajiri, M., 2003. Assistive
technology in the use of a PC for the deaf-blind(In
Japanese), WIT 2002 of the Institute of Electronics,
Information and Communication Engineers, 25-28.
Wada, C., & Wada, Y., 2003. A proposal for a
communication device with a finger and a palm for the
deaf-blind, 10th International Conference on Human -
Computer Interaction, 4, 281-285.
BIOSIGNALS 2008 - International Conference on Bio-inspired Systems and Signal Processing
310
