
INVERSE SIMULATION FOR RECOMMENDATION OF BUSINESS
SCENARIO WITH QUALITATIVE AND QUANTITATIVE
HYBRID MODEL
Keisuke Negoro, Takeshi Nakazaki, Susumu Takeuchi and Masanori Akiyoshi
Graduate School of Information Science and Technology, Osaka University
2-1 Yamadaoka Suita, Osaka,565-0871, Japan
Keywords:
Qualitative and Quantitative Simulation, Monte Carlo Method, Inverse Propagation, Contradiction.
Abstract:
In order to decide an effective management plan, managers often draw up and evaluate business scenarios.
To make the evaluation, a simulation method on the qualitative and quantitative hybrid model represented as
causal graph has been proposed. There is a strong need to get optimal input values for the target outputs in
the simulation, but exhaustive search can not be realistically applied to it from considering the processing
time. Therefore, we propose a quick search method for optimal input values cencerning the qualitative and
quantitative hybrid simulation. Our approach is to get optimal values of input nodes by inverse propagation of
effects from the value of target output nodes on the simulation model. However, it generates the contradiction
that the value of a separated node in the causal graph decided from one of destination nodes is different from
the value of the other destination nodes. Therefore, we re-execute the inverse propagation repeatedly from
the nearest qualitative node connecting to a quantitative node for solving the contradiction. By experimental
results about the proposed method, time could be reduced for reaching the solution. We also could confirm a
certain level of accuracy about the solution.
1 INTRODUCTION
In order to decide an effective management plan,
managers often draw up and evaluate business sce-
narios that indicate a series of changes about busi-
ness factors. For evaluating the business scenarios,
the modeling and simulation is often used(Forrester,
1961). However, it was considered to be difficult to
execute simulation on the models including both qual-
itative and quantitative information which are general
factors of business systems(Kuipers, 1986).
Based on this situation, a simulation method on
qualitative and quantitative hybrid model has been
proposed(Samejima et al., 2007a). In the method,
both qualitative and quantitative factors can be han-
dled in a model. The model consists of nodes which
show business factors and arcs which show cause-
effect relations between the business factors. All
nodes have values, and in the simulation, they are
changed by propagation of effects through arcs. The
value ofinput nodes are decided according to the busi-
ness plan, and the value of output nodes are checked
for evaluation of the plan. In the method, the propaga-
tion of the effect between quantitative and qualitative
nodes is achieved using random numbers by monte
carlo method. So, the outputs are represented as a
form of probability distribution.
On the hybrid simulation, it is required to decide
optimal input values that bring target output values at
the highest probability. Of course such an input can
be decided by exhaustive search, but it takes much
time. Therefore, we propose the quick search method
for optimal input in the hybrid simulation.
In order to decide the optimal input for the target
output, our approach is simply utilizing the simulation
model proposed in the work(Samejima et al., 2007a),
which is made by users for cut-and-try solution. In the
model, propagation of effects between nodes is de-
fined as a rule. It is considerd to be possible to decide
the value of source node from the value of destination
node by using the rule inversely. Therefore, values
of input nodes are obtained by deciding the value of
source nodes repeatedly. The values of input nodes
obtained from that way is considered nearly as the op-
timal input value, so we repeat the inverse simulation
to get probability distribution on input values.
333
Negoro K., Nakazaki T., Takeuchi S. and Akiyoshi M. (2008).
INVERSE SIMULATION FOR RECOMMENDATION OF BUSINESS SCENARIO WITH QUALITATIVE AND QUANTITATIVE HYBRID MODEL.
In Proceedings of the Third International Conference on Software and Data Technologies - PL/DPS/KE, pages 333-338
DOI: 10.5220/0001900203330338
Copyright
c
SciTePress
2 INPUT VALUE SEARCH ON
HYBRID SIMULATIONL
MODEL
2.1 Qualitative and Quantitative
Hybrid Simulation
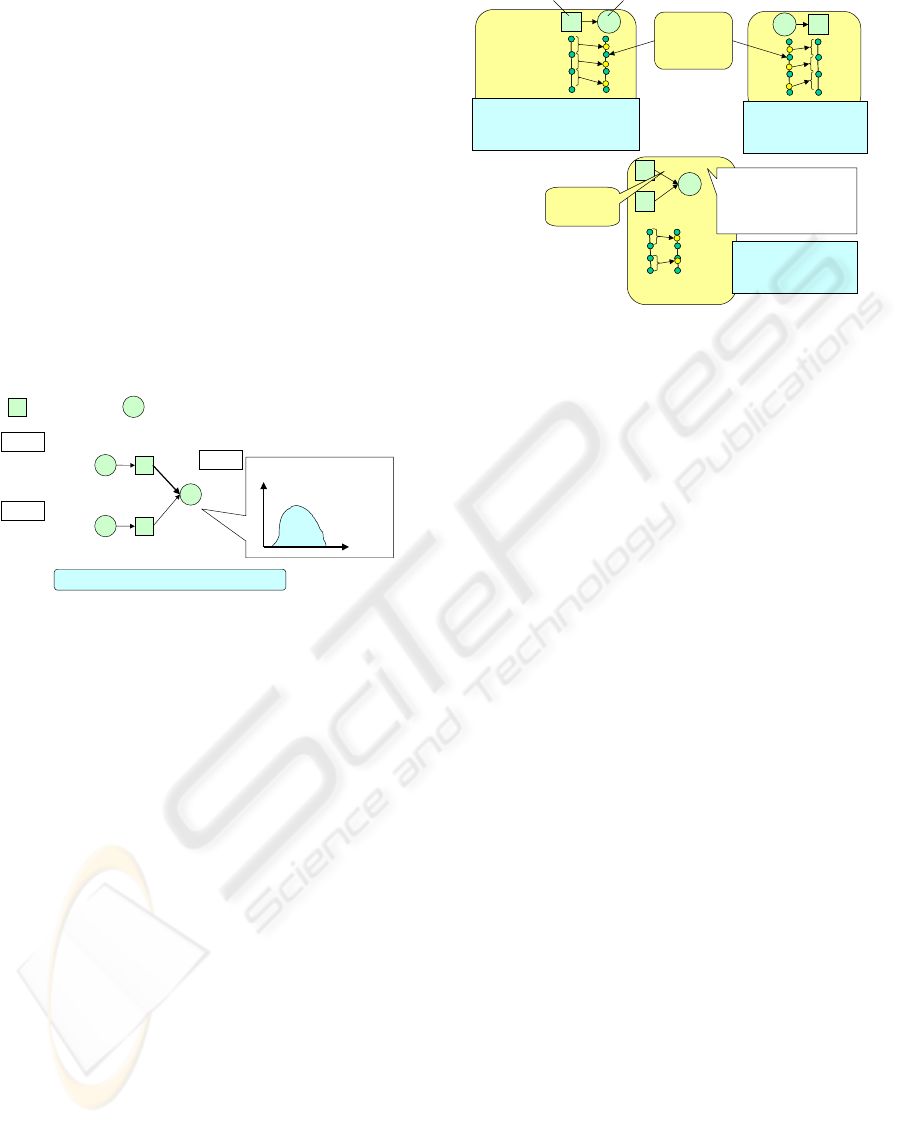
In qualitative and quantitative hybrid simulation, both
factors are handled together in a model. The model
consists of qualitativeand quantitativenodes, and arcs
between nodes. Qualitative nodes were given with
the value range. In this method, because the propaga-
tion of an effect between quantitative and qualitative
factors is achieved using random numbers by monte
carlo method, output is distribution of probability as
shown in Fig.1(Samejima et al., 2007b).
The number of
quality manager
[10, 20]
Production time
[2.0, 5.0]
Quality level
Lead time
Volume
of sales
:Quantitative node
:Qualitative node
Output
Probability
Evaluate
as probability
distribution
Input 2
Input 1
Deciding values using Monte Carlo method
Volume
of sales
Figure 1: Qualitative and quantitative hybrid simulation.
Propagationbetween quantitativenodes is decided
by mathematical expression given by the user. Be-
tween qualitative nodes that are given with state val-
ues (five kinds of values), the value of destination
node is decided as the pair of the value of source node
in consideration of cause-effect relation (ex. mono-
tonically increasing or decreasing).
We describe about the propagation between qual-
itative and quantitative nodes as follows. A quantita-
tive node connecting to a qualitative node is divided
into five ranges by landmarks given by the user, and
the particular range is paired with the state value of
the qualitative node on the basis of cause-effect rela-
tion, as shown in Fig.2
• Propagation from a qualitative node to a quantita-
tive node
In the corresponding pair of range with the state
value of the qualitativenode, a unique value of the
quantitativenode is decided by generating random
numbers.
• Propagation from a quantitative node to a qualita-
tive node
The state value of the qualitative node is decided
as the corresponding pair of range made by land-
40
10
x
z
Sum of propagated
values in that
reflected the weights
y
M
H
dH
20
0
M1 C
1
M2 C
2
z = C
1
V
1
+C
2
V
2
y
x
0
30
V
1
V
2
Weights from magnitude
Correlation at random
C
1
>C
2
C
1
+C
2
= 1
M(normal)
H(high)
dH(slightly high)
Qualitative value is decided at
random in the corresponding
pair of range
Ranges are
divided by
landmarks
State value is decided
as the corresponding
pair of range
Magnitude
correlation
Source node
Destination node
Figure 2: Propagation of effect between qualitative and
quantitative nodes.
marks in which the value of quantitative node ex-
ists.
• Propagation from multiple nodes to a node
Propagation from each source node to the desti-
nation node is executed by the above-mentioned
manner. On the basis of magnitude correlation
about connecting arcs to the destination node,
weighting coefficient about each arc is decided
using random number. As a result, sum of each
propagatedvalue multiplied by the coefficient was
decided as the value of destination node.
In propagation of effect from a qualitative node to
a quantitative node, the value of destination node is
not decided in a unique manner. So by repeating a
chain of propagation in a model, distributions of the
values about output nodes are generated.
2.2 Problems about Searching Optimal
Input Values
As we mentioned in the introduction, it is required to
decide optimal input values that bring target output
values at the highest probability. On the hybrid simu-
lation, the optimal input can be decided by exhaustive
search. However, it takes much time because a certain
amount of time is needed to get an output of distribu-
tion in the simulation. The brute-force search is not
considered to be realistically available. Therefore, we
propose the quick search method for optimal inputs in
the hybrid simulation.
ICSOFT 2008 - International Conference on Software and Data Technologies
334
3 MODEL-BASED INVERSE
PROPAGATION
As mentioned in section.2.2, it is difficult to decide
optimal input values by exhaustive search in the qual-
itative and quantitative hybrid simulation. Therefore,
we propose the method to obtain optimal input values
for the target outputs quickly.
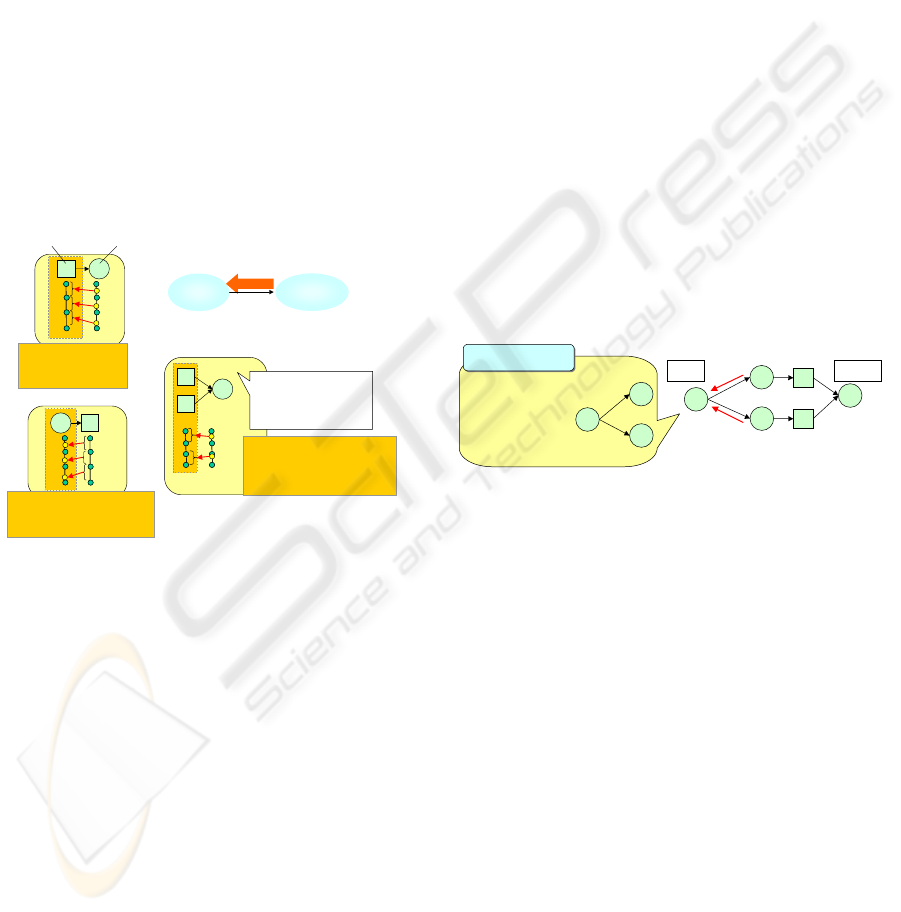
3.1 Problem on Inverse Propagation
In order to decide the optimal input for the target out-
put, our approach is to use original simulation models
defined by users. On the model, propagation of ef-
fects between a source node and a destination node is
defined as a rule. So, it is possible to decide the value
of source node from the value of destination node by
using the rule inversely. We define the inverse propa-
gation as shown in Fig.3.
M
H
dH
40
10
x
z
V1, V2 are decided at random
(Condition:C1V1+C2V2 = z)
State value is decided as the
corresponding pair of V1or V2
y
M
H
dH
20
0
M1 C
1
M2 C
2
y
x
0
30
V
1
V
2
State value is decided
as the corresponding
pair of range
Qualitative value is decided at
random in the corresponding
pair of range
Source node
Destination node
Weights from magnitude
Correlation at random
C
1
>C
2
C
1
+C
2
= 1
Source
node
Destination
node
Inverse propagation
Figure 3: Inverse propagation between qualitative and quan-
titative nodes on a model.
• Inverse propagation from a quantitative node to a
qualitative node
The state value of the qualitative node (source
node) is decided as the corresponding pair of
range made by landmarks in which the value of
quantitative node (destination node) exists.
• Inverse propagation from a qualitative node to a
quantitative node
In the corresponding pair of range with the state
value of the qualitative node (destination node),
a unique value of the quantitative node (source
node) is decided by generating random numbers.
• Inverse propagation from a node to multiple nodes
On the basis of magnitude correlation about con-
necting arcs to the destination node, weighting co-
efficient value about each arc is decided at ran-
dom. Moreover, a random number about each arc
is generated so that sum of the products about the
random numbers multiplied by the weighting co-
eeficients is corresponding to the value of destina-
tion node. Finally, the value of each source node
is decided, by inverse propagation of each arc’s
random number in the above-mentioned manner.
A set of values about input nodes that will gener-
ate the target output can be obtained by deciding the
value of source nodes repeatedly. The set of values
about input nodes is considered as candidates of the
optimal values of input nodes, so we repeat the in-
verse simulation to get probability distribution on in-
put values. The sets of values got at high possibility
are defined as the optimal inputs.
However, if a source node has more than two des-
tination nodes, called “branch node”, there is a possi-
bility that the value of source node from one of desti-
nation nodes is different from the value of other ones
as shown in Fig.4. It contradicts the rules of propaga-
tion about normal direction that the value of each des-
tination node is decided from the same source node.
It is possible to adjust the different values to the aver-
age, but that is not an appropriate way for executing
inverse propagation correctly.
7
10
Output
Input
Values of destination
nodes are decided
from identical node
y
1
x
y
2
y
1
= f(x)
y
2
= g(x)
Contradiction!
Contradiction!
Figure 4: Contradiction about inverse propagation at a
branch node.
In case of the contradiction, our approach is to ad-
just the values by executing the inverse propagation
of effect between qualitative and quantitative nodes
again. The factors of the contradiction can be prop-
agated from the cause-effect relation between quali-
tative and quantitative nodes, because values of the
qualitative nodes are decided as a random number in
the corresponding pair of range to the value of qual-
itative node. Therefore, if the contradiction has oc-
curred at a branch node, we re-execute inverse prop-
agation from the nearest qualitative node connecting
to a quantitative node. Re-execution of propagation
from the qualitative node is repeated and stopped in
case of getting the corresponding values at branch
node. If the contradiction can not be solved in the
pre-defined number of times, all the inverse propaga-
tion is considered to be unavailable and canceled.
INVERSE SIMULATION FOR RECOMMENDATION OF BUSINESS SCENARIO WITH QUALITATIVE AND
QUANTITATIVE HYBRID MODEL
335
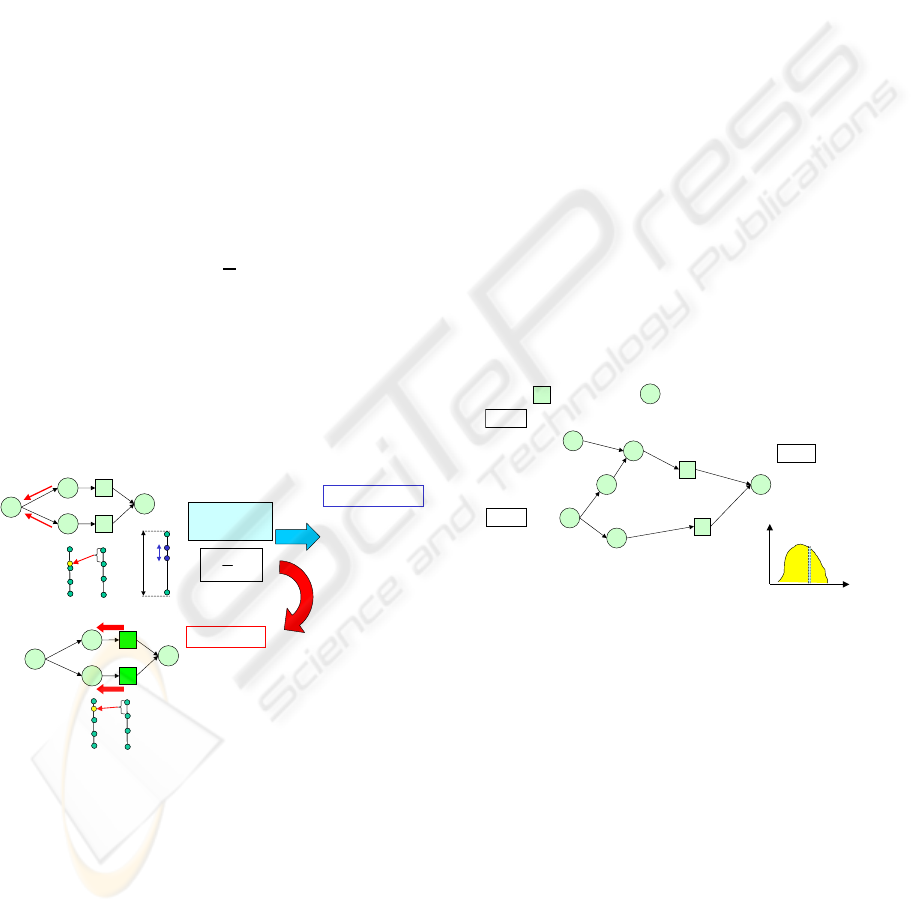
3.2 Input Value Search Method by
Inverse Propagation
It is shown in Fig.5 the outline of input value search
method by inverse propagation with re-propagation.
At the beginning of the method, the values of target
output are set. And, inverse propagation is executed
from the output nodes to the input nodes.
The judgment is necessary whether contradiction
is occurred or not. There are realistically few cases
inversely propagated values to a branch node are en-
tirely the same value. So, inconsistency needs to be
allowed to some extent and we introduced a function
for the judgment of contradiction. The difference be-
tween the maximum value and the minimum value of
the inverselypropagated values to the separate node is
defined as “d”, and the value range about the branch
node is defined as “R”. And, the judgment of contra-
diction is done with the following expression.
ε =
d
R
If ε is equal to or more than the threshold k, contra-
diction is considered to be occurred. In case that con-
tradiction is not occurred, the value of branch node is
decided as the random number between the maximum
value and the minimum value of the inversely propa-
gated values. Effects are propagated inversely in this
manner, and finally values of input nodes are decided.
V
1
V
2
d
M
dH
H
0
15
20
M
dH
H
0
15
20
V
2
V
1
Re-propagation
Judgment of
contradiction
?k
R
d
<=
ε
Contradicted
Re-execute inverse propagation
from the nearest qualitative node
connection to a qualitative node
Yes
No
Not contradicted
The value of node
is decided from
the range [V
1
, V
2
]
at random
Figure 5: Input value search method by inverse propagation.
The process for getting a set of values about input
nodes from the target outputs is shown as follows.
step 1 A chain of inverse propagation is executed
from the output nodes to the input nodes.
step 2 If contradiction is occurred at a branch node,
it is re-executed inverse propagation from the
nearest qualitative node connecting to a quan-
titative node.
(a) In case that the contradiction is solved, in-
verse propagation is continued.
(b) If the contradiction can not be solved in
the pre-defined number of times, all the in-
verse propagation is considered to be un-
available and canceled, and the process goes
back to the step 1.
step 3 A set of values about input nodes is decided by
inverse propagation.
Repeating the above process for the pre-defined
number of times, the distribution of probability is ob-
tained.
4 EVALUATION EXPERIMENT
4.1 Model and Output of Our
Experiment
We execute experiment of the proposed method. Us-
ing the model described in Fig.6, we evaluated the
processing time for getting the distribution of inputs
and checked whether the sets of optimal values about
inputs can be obtained or not.
Volume
of sales
Probability
The number of
quality manager
[15, 25]
Step interval =1
Production time
[3.0, 5.0]
Step interval =0.1
Frequency of tests
Amount of production
in a day
Lead time
Opportunity
loss rate
Volume of sales
[0, 1600]
Target output
Input 1
Input 2
output
:Quantitative node
:Qualitative node
Quality level
Figure 6: The model for the experiment.
“The number of managers in charge of quality”
and “Production time” are set as input nodes. The
value of “The number of managers in charge of qual-
ity” is given in range from 15 to 25 on step intervals
1, and “Production time” is given in range from 3 to 5
on step interval 0.1.
In qualitative and quantitative hybrid simulation
in normal propagation, 10000 values of output are
got from an input value. And, also in the proposed
method, 10000 sets of values about input nodes are
got from a target output. The limit of re-propagation
from qualitative nodes is set 1000 times. The thresh-
old “k” for the judgment of contradiction is set 0.01.
In this model, some target outputs produce input
distributions with multiple peaks. It is shown in the
ICSOFT 2008 - International Conference on Software and Data Technologies
336
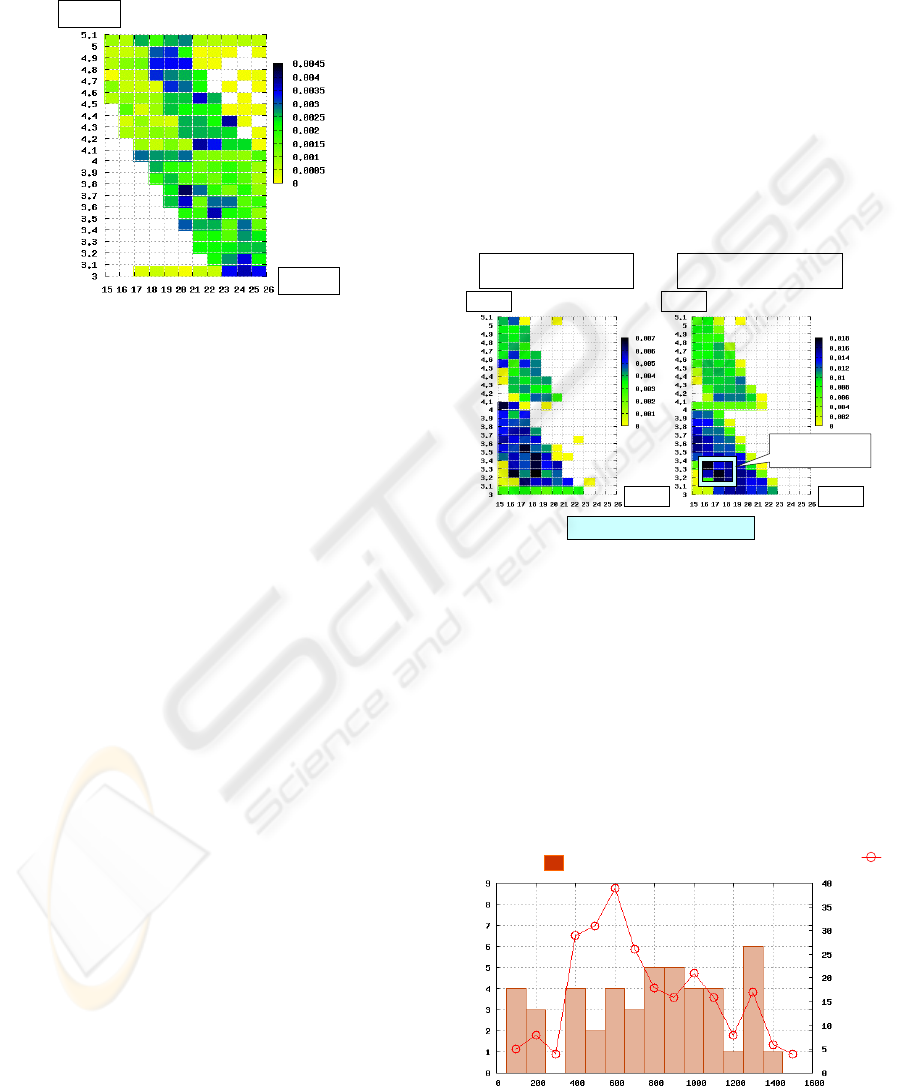
Fig.7 the probability distribution about sets of input
nodes for the target output “700”. According to the
distribution, the input sets of high probability for the
output “700” are scattered about input space.
Input 1
Input 2
Figure 7: Probability distribution for the target output
“700”.
For fifteen target outputs values between 100 to
1500 on step intervals 100 using the model, we evalu-
ated the processing time for getting the distribution of
inputs and checked whether the sets of optimal values
about inputs can be obtained or not.
4.2 Processing Time
We compared the processing time for getting the dis-
tribution of inputs by the proposed method to the
time by exhaustive search. The program is described
with Java. Windows XP and Pentium M 1.6GHz and
512MB memory are used as the execution environ-
ment of the program.
It takes 5 minutes on an average by the proposed
method, which is at least 3 minutes and at most 11
minutes. On the other hand, it takes 2 hours 10 min-
utes to search all sets of inputs values by exhaustive
search. It is concluded that much time is reduced to
get the distribution of inputs.
The reason for scattering time about proposed
method is that the number of input sets that can pro-
duce target outputs is different between the target val-
ues. If the number of inputs sets that can bring about
the target outputs is quite few to the input space, it is
occurred re-propagation or cancellation at high prob-
ability. And it takes more time to get a distribution of
inputs.
4.3 Precision of Probability Distribution
about Inputs
On the probability distribution about input got by the
proposed method, users probably regard the input sets
at the highest probability and around them as optimal
inputs. So, we defined the set of inputs at the high-
est probability as “suggested inputs (x, y)”(x is the
value of input1, y is the value of input2), and counted
the number of right optimal input sets in the range of
suggested inputs and around the point as ”hit num-
ber”. Optimal sets of input values are defined as sets
of top 30% at probability about all candidates. The
counted hit numbers are shown in Fig.8.
Probability distributions
from exhaustive search
Probability distributions
from the proposed method
In case of target output “400”
Input 2
Input 1
suggested input
and around it
Input 2
Input 1
Figure 8: Suggested inputs sets and around the point.
By the result about hit numbers in Fig.9, opti-
mal sets of inputs are included in suggested inputs or
around the point for the most case of target outputs.
The reason why optimal sets are not included at the
case the target out put is 300 or 1500 is that the num-
ber of optimal sets is very small.
Additionally, we checked degree of coincidence
between probability distributions from the proposed
method and distributions from exhaustive search. We
Hit number:
The number of
optimal inputs
:
Figure 9: Hit numbers and optimal sets of inputs.
INVERSE SIMULATION FOR RECOMMENDATION OF BUSINESS SCENARIO WITH QUALITATIVE AND
QUANTITATIVE HYBRID MODEL
337
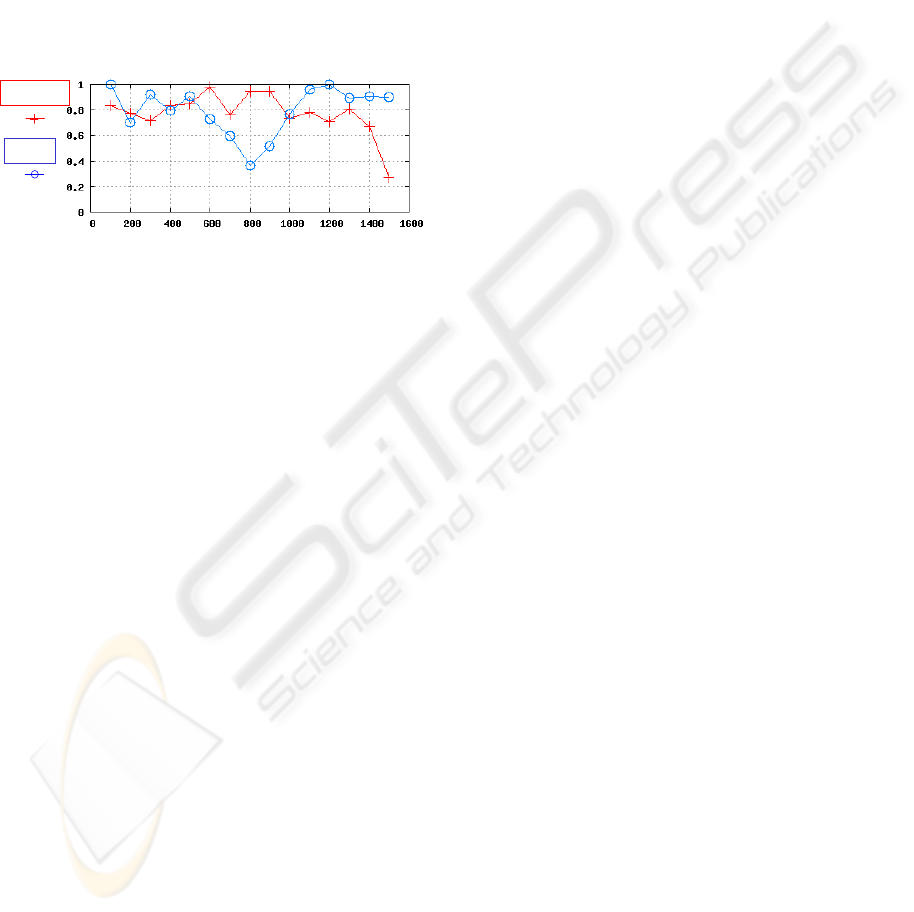
calculated degrees of precision and recall for each dis-
tribution about inputs sets of top 50% at probability.
The result is shown in Fig.10, for example, the ten-
dencies of distributions are mostly corresponding to
each other at the target output “400” in which both the
precision and the recall are large. In the other target
outputs, precisions are considered to be large. By that
result, we can say probability distributions from the
proposed method have coincidence with the distribu-
tions from exhaustivesearch. Therefore, the proposed
method has a possibility to be applied to the problem
with multiple peaks.
Recall
Precision
Figure 10: Precision and recall for the distributions.
At the target output “1500”, however, the preci-
sion value is small while the recall value is large. It
is considered that the number of inputs sets of top
50% at probability is large in the distribution from the
proposed method, and they include inputs sets bot-
tom 50% at probability in the distribution from the
exhaustive search. On the contrary, the recall value
is small while the precision value is large at the tar-
get output “800”. It is considered that the number of
inputs sets of top 50% at probability is large in the
distribution from the proposed method is small, and
most of inputs sets top 50% at probability in the dis-
tribution from the exhaustive search are not included
in them.
5 CONCLUSIONS
In this paper, we proposed inverse simulation for rec-
ommendation of business scenario with qualitative
and quantitative hybrid model. As an approach, we
used the cause-effect simulation model that was made
by the user and executed propagation of effects in-
versely in order to decide a value of a source node
from a value of a destination node. Executing the in-
verse propagation in a chain of cause-effect relations
from output nodes, we decided the values of input
nodes for the target outputs. Because the value of
source node is decided at random between a qualita-
tive destination node and a quantitative source node,
contradiction is occurred concerning the value of a
branch node where one of destination nodes is dif-
ferent from the value of the other destination nodes.
Therefore, in the case of the contradiction, we re-
executed the inverse propagation repeatedly from the
nearest qualitative node connecting to a quantitative
node for solving the contradiction. According to the
repeating the whole re-propagation, probability distri-
bution of input nodes were obtained.
Evaluation was done by the processing time and
checked whether optimal inputs could be obtained or
not about fifteen values of target output. It took 5
minutes for the processing and much time could be
reduced to get the distribution of inputs. We could get
optimal inputs about thirteen target outputs out of fif-
teen, so it is confirmed a certain level of coincidence
between probability distributions from the proposed
method and distributions from exhaustive search.
REFERENCES
Forrester, J. W. (1961). Industrial Dynamics. MIT Press,
Cambridge, USA.
Kuipers, B. (1986). Qualitative simulation. Artificial Intel-
ligence, 29(3):289–338.
Samejima, M., Akiyoshi, M., Mitsukuni, K., and Ko-
moda, N. (2007a). Business scenario design sup-
port by qualitative-quantitative hybrid simulation. In
Proc. of The IEEE International Conference on e-
Technology, e-Commerce, and e-Services (EEE’07)
and the IEEE International Conference on Electronic
Commerce (CEC’07), pages 401–408.
Samejima, M., Negoro, K., Akiyoshi, M., Norihisa, K., and
Mitsukuni, K. (2007b). Hybrid simulation on quali-
tative and quantitative integrated model using monte
carlo method. In Proc. of 2007 Summer Computer
Simulation Conference (SCSC 2007), in CD-Rom.
ICSOFT 2008 - International Conference on Software and Data Technologies
338
