
Combining Visual and Text Features for Learning in
Multimedia Direct Marketing Domain
Sebastiano Battiato
1
, Giovanni Maria Farinella
1
, Giovanni Giuffrida
1
Catarina Sismeiro
2
and Giuseppe Tribulato
1
1
University of Catania, Department of Mathematics and Computer Science
Viale A. Doria 6, Catania, 95125, Italy
2
Imperial College London, Tanaka Business School, South Kensington Campus
London, SW7 2AZ, UK
Abstract. Direct marketing companies systematically dispatch the offers under
consideration to a limited sample of potential buyers, rank them with respect to
their performance and, based on this ranking, decide which offers to send to the
wider population. Though this pre-testing process is simple and widely used, re-
cently the direct marketing industry has been under increased pressure to further
optimize learning, in particular when facing severe time and space constraints.
Taking into account the multimedia nature of offers, which typically comprise
both a visual and text component, we propose a two-phase learning strategy based
on a cascade of regression methods. This proposed approach takes advantage of
visual and text features to improve and accelerate the learning process. Exper-
iments in the domain of a commercial Multimedia Messaging Service (MMS)
show the effectiveness of the proposed methods that improve on classical learn-
ing techniques.
1 Introduction and Motivations
In recent years, as a result of technological advances in computing and communications,
new channels for customer contact have become available, leading to the broadening of
the direct marketing process [1].
The domain of our empirical application is the targeting of multimedia messages
(MMS) sent to mobile phone users, one of the new direct marketing channels. In this
context a single multimedia message is sent everyday to the mobile phones of millions
of customers. Each message contains a commercial offer and each offer advertises a
specific product or service that can be purchased directly from the mobile phone with
few clicks (e.g., a ringtone, a song, or a video). From the mobile operator point of view
this is in general very cost-effective: operators can easily reach millions of potential
buyers at little cost, making the profit potential of these advertising-related services
very high. In addition, given the mobile phone market saturation and fierce competition
[2], value added services (VAS) and direct marketing offers are currently a significant
revenue source for many mobile service providers.
Battiato S., Maria Farinella G., Giuffrida G., Sismeiro C. and Tribulato G. (2008).
Combining Visual and Text Features for Learning in Multimedia Direct Marketing Domain.
In Metadata Mining for Image Understanding, pages 34-47
DOI: 10.5220/0002337200340047
Copyright
c
SciTePress

One of the challenges of direct marketing applications, like the one in our empirical
domain, relates to the need of acquiring knowledge regarding the performance of all
possible offers. Such knowledge is to be used in the development of better targeting
and segmentation policies, which have always been at the core of the success of direct
marketing activities [3, 4].
Traditionally, direct marketing companies have relied heavily on pre-testing to ac-
quire knowledge and select the best offers [5]. The pre-testing process is simple and
widely used across the industry. First, the set of offers under consideration is sent to a
limited sample of potential customers. Then, depending on the sample response, com-
panies compare the performance of each offer and select the best offer for each segment
of the population. Performance measures will vary depending on the specific applica-
tion (email, mobile messaging, etc.) and can include the number of items bought, the
revenue per order and the click-through-rate (CTR). The best offers are the only ones
sent to the wider population of potential customers, reducing waste (by avoiding send-
ing irrelevant and potentially annoying messages to too many customers) and allowing
higher performance and profitability. This testing approach has worked well for the
many direct marketing applications characterized by a low cost of contact and a large
customer base (e.g., traditional mail).
The broadening of the direct marketing process and the creation of new channels,
like the one in our empirical application, has brought new learning and knowledge
acquisition challenges to the industry. First, the number of new offers in need to be
tested in most of the new applications grows faster than the available opportunities
for learning. Second, many of the offers have very short life-spans, posing additional
pressure to produce fast learning. Under these circumstances the learning space may
not be enough to learn on all available items.
A good optimization and targeting system, that learns quickly and efficiently and
that selects the right message/product to be sent to each customer so that revenues are
maximized, could provide an additional profitability boost.
This work is driven by the need of improving and accelerating the learning process
in direct marketing applications under severe time and space constraints. We propose to
optimize learning by taking advantage of the different features extracted from an offer’s
multimedia content (which include visual and text features). The main contribution of
this research is to demonstrate that one can make the learning phase more efficient and
effective by taking advantage of the information on visual content together with the tex-
tual information present in each offer. The proposed strategy is assessed by simulation
of an MMS direct marketing system using a real MMS dataset, and it outperforms tradi-
tional learning methods. We build on our initial work [6] in which the MMS ”goodness”
is derived combining text information with color based visual features. In that paper we
showed that the combination of such simple color and text-related features performs
better than when each type of feature is considered in isolation.
In this paper the Textons-based representation [7–9] of visual content for each MMS
has been used together with text features for learning purpose. Another contribution of
this work is a new two-phase learning strategy in which a cascade of regressions meth-
ods is used to improve on classical learning methods. The suggested learning approach
first learns through regression based methods which MMS offers available for learning
3535

should be subject to further testing, and which offers should wait for a better moment
or simply be discarded. This first phase takes advantage of the static (non-behavioral)
features extracted from image and text and from previous CTR information. In a sub-
sequent phase, we propose to learn only on pre-screened MMS offers up to the limit of
the system’s learning capacity. This second-phase learning will take place just like in
traditional direct marketing learning systems: the offers are sent to a sample of potential
customers and the behavioral feedback registered and used for final offer selection. In
our empirical application we show that the proposed approach can improve substan-
tially the learning and optimization process, whenever direct marketing companies are
operating under time and learning space constraints. The proposed learning method can
be generalized and used in other multimedia direct marketing domains different from
the MMS domain proposed in this paper.
The remainder of the paper is organized as follows: Section 2 introduces the dataset
we have used to test our approach, the simulated MMS direct marketing system, and
the main structure of our two-phase learning strategy. Section 3 and Section 4 describe
the process we have employed to extract visual and text features from the MMS offers.
In Section 5 we provide details on the regression tools, and on the cascade learning
strategy that uses the extracted features. Section 6 reports the experiments and discusses
the results in the MMS application domain. We conclude in Section 7 with avenues for
further research.
2 The Two-Phase Learning Strategy
The current section introduces the dataset and the basic concept used to simulate a
real MMS Direct Marketing System. Moreover, the structure of the two-phase learning
approach will be presented.
2.1 The Multimedia Messaging Services Dataset
To test the proposed approach, we use a real dataset of commercial multimedia mes-
sages sent to mobile users in Europe over a period of 15 months. There were more
than one million users who opted-in for the service. There were also more than 70,000
possible direct marketing offers to advertise, but only a subset of 8600 items were la-
beled with a CTR due to the limit of our real system in sending more than twenty items
per day. Each commercial offer is composed by a small picture, a short description,
and a price. The database we use contains the RGB thumbnail image associated with
each offer. All images are encoded by JPEG standard with a high quality setting (i.e.,
no blocking is evident). The typical resolution size is 200×200 or 200×116 (see Fig-
ure 1). Our database includes also the short text description associated with each offer.
This text message contains on average twelve words and briefly describes the com-
mercial offer. Let’s note that differently than [10] the text does not describe the image
Fig. 1. Examples of images available in commercial MMS offers.
3636

content. In particular the overall dataset contains several kinds of pictorial contents (e.g.
face, people, building, cartoons, etc.) that is not directly related to the category and text
of the offers. For each offer we also know the exact price charged to users who click on
the offer and the click-through-rate of the offer across all mobile phone users.
2.2 Simulating a Real MMS Direct Marketing System
Given the number of people in the customer base, and the reduced number of oppor-
tunities to contact them, we are able to learn only on a small number of new MMS
offers each day. We define the sending rate to be the number of daily (learning) trials.
This corresponds to the maximum number of MMS offers we can send to the learning
panel each day (the learning panel being a set of customers we use for learning on new
offers). We define arrival rate as the average number of new MMS items added to the
offer catalogue each day. We note that, before a final decision is made on which MMS
items to send to the optimization portion of the customer base, we should learn on the
revenue potential of each one of these new items.
In the type of applications we are considering, it is very likely that the arrival rate
is greater than the sending rate. We call overcapacity rate the difference (arrival rate -
sending rate). In addition, we call overcapacity the total number of unlearned messages.
Hence, overcapacity measures the number of items on which we cannot learn, under the
given learning space constraints. Since overcapacity grows monotonically each day (the
rate of growth is given by the overcapacity rate), with a positive growth rate (common in
the new direct marketing applications discussed previously) the learning task becomes
more difficult over time.
Finally, we define base size as the number of offers that have never been sent to
customers and are present at the beginning of the first learning phase (in a sense, the
base size is the overcapacity measured just before the first learning phase takes place).
As time goes by, if the overcapacity rate is greater than zero, the number of offers that
accumulate without ever been subject to learning increases (overcapacity grows). This
leads also to a growth of the base size just before a first learning phase is initiated.
2.3 The Two-phase Learning Structure
We propose a two-phase methodology to improve learning on new offers under time and
learning space constraints. In Figure 2 the overall schema of our approach is reported.
We first estimate which of the offers available for learning are likely to be good
(in terms of estimated CTR) by taking advantage of their static (non-behavioral) visual
and text features, and of the past CTR of similar (in terms of visual and text content)
offers. As depicted in Figure 2, at the end of the first phase all new items will be labeled
with the estimated CTR. Then, in the second phase, we constrain learning to the offers
with the highest performance potential until we reach the system’s learning capacity.
The performance potential of each offer is defined as the product between the estimated
CTR and the price. This measure represents the expected revenue for each new delivered
item. Learning in this phase takes place as in traditional direct market applications using
the pre-testing approach above discussed, that is, new offers are sent to the learning
panel and the behavioral feedback (i.e., response) is registered and used for final offer
3737
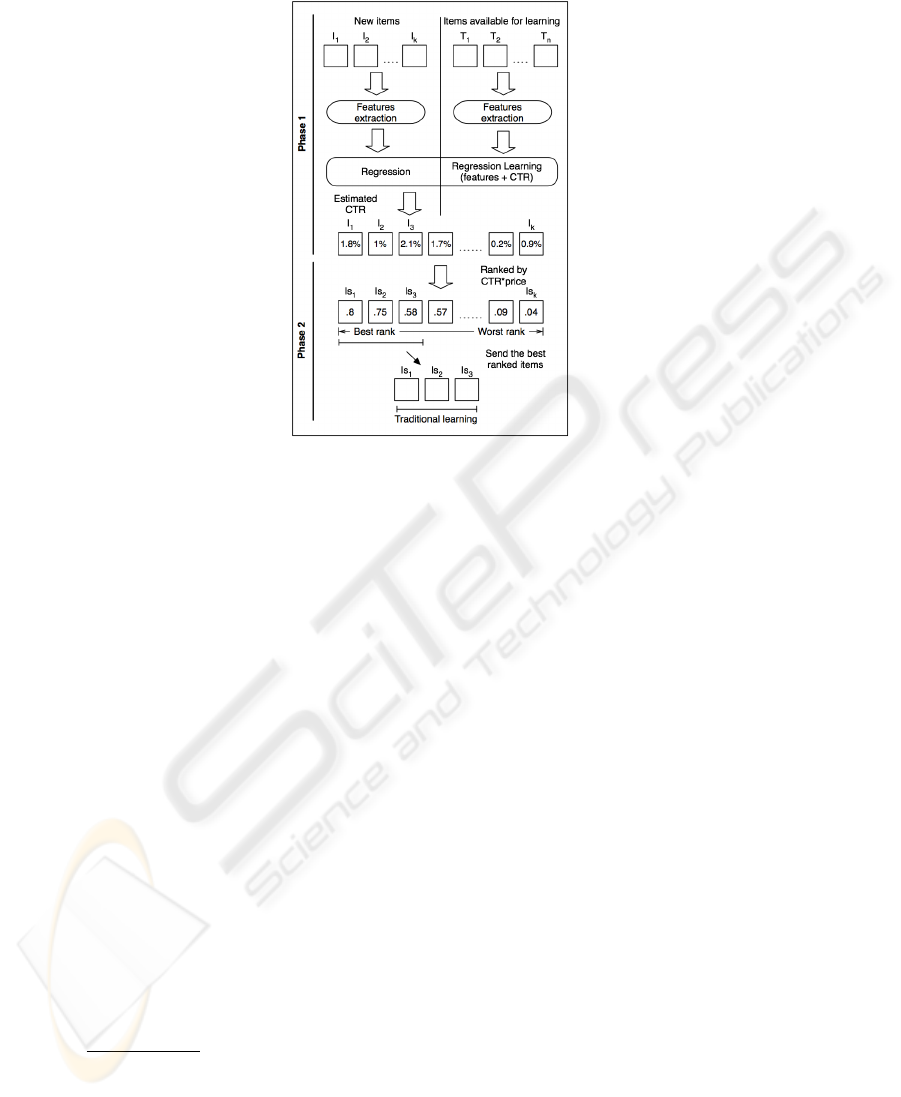
Fig. 2. The overall schema of the proposed two-phase learning approach.
selection. In other words, we apply the traditional learning only to a subset of the newly
arrived items. Such subset is chosen taking into account the performance potential of
each item computed by using its static features. Thus, we limit the traditional learning
to the most promising items for which we have enough time to learn on.
Results conduced by using the two-phase approach are discussed in Section 6. We
note that improving the learning procedure, by including the initial filtering (first phase
learning), could potentially allow us to use a smaller sample of customers in the tradi-
tional learning phase and release customers for the more profitable optimized content
delivery.
3 Encoding Visual Content through Holistic Representation
Customers’ evaluation of the offer greatly depends upon their interpretation of the visual
content. Thus, we use visual features to model how “pleasant” an image offer can be
for a user.
Studies in Scene Perception and Visual Search [11–13] emphasize the fact that hu-
mans are able to recognize complex visual scenes at a single glance, despite the number
of objects with different colors, shadows and textures that may be contained in the
scenes. Moreover, recent works of Computer Vision research community [8, 14–16]
have efficiently exploited holistic cues
3
of an image to solve the problem of rapid and
automatic scene classification bypassing the recognition of the objects inside the scene.
An holistic representation to capture the visual content of the scene as whole entity is
3
By definition, an holistic cue is one that is processed over the entire human visual field and
does not require attention to analyze local features ([8])
3838

a good deliverable in our application domain. More specifically, we have to choose an
holistic representation able to capture the structure present in the MMS image. As well
known, humans can process texture quickly and in parallel over the visual field [17]:
this makes texture a good candidate as holistic cue.
The main process [8, 18] we used in this paper to encode textures cues starts by
building a vocabulary of distinctive patterns, usually called visual words, able to iden-
tify properties and structures of different textures present in the offer’s images. Using
the built vocabulary each offer’s image will be represented as an histogram of visual
words.
To build the visual vocabulary each image in the training set is processed with a bank
of filters. All pixel responses are then clustered pointing out a centroid for each clus-
ter. These centroids, called textons, represent the visual vocabulary. Each image pixel
is then associated to the closest textons taking into account its filter bank responses.
Hence, each image becomes a “bag” of textons (or visual words). A normalized his-
togram on textons is used as descriptor for the holistic representation.
In this work we use the bank of filters suggested in [9] and the k-means clustering
algorithm to build the Textons vocabulary. More specifically, each pixel in each image
has been associated with a 17-dimensional feature vector obtained by applying three
Gaussian kernels (σ=1, 2, 4), four Laplacian of Gaussian kernels (σ=1, 2, 4, 8) and 2
Derivative of Gaussian Kernels (σ=2, 4) on x and y directions. The Gaussian kernels
have been applied on Lab channels whereas the remaining filters only on L channel.
4 Extracting Features on Text Description
To determine the static features of the short descriptive message of each offer, we col-
lected the set of most common words among all messages in the training set (i.e., among
all messages for which performance is known). We then filtered out all stop words and
stemmed the remaining ones.
Among all words extracted from the collection of messages we removed the least
significant words. The significance of a word is function of its entropy computed over
the distribution of that word across all messages considered. That is, words that appear
on a large percentage of messages tend to be less discriminant (thus, less significant)
than words appearing on fewer messages. In addition, we removed also all words ap-
pearing in a very limited number of messages (less than five). This is justified by the low
probability of finding the same word in the learning set, thus, it becomes very unlikely
that we can use that word in the generalization phase.
After filtering out unlikely words, we dummified the learning space by creating
a Boolean variable for each word. Thus, given a phrase, we set to one all Boolean
variables corresponding to the words composing the text, and to zero otherwise. After
processing the entire training set, we obtain a description of the text of each offer as
a function of dummy variables. On average we extracted five words per message and
used all of these in the first learning phase.
3939

5 Exploiting Different Kind of Features for Learning
As previously described, we obtain the static features for each MMS through automatic
computer vision and text mining techniques (see Sections 3 and 4). Based on these
features we create feature vectors for each MMS:
– f
T extons
: vector representing the probability distribution over the visual vocabulary
(Textons) for each offer.
– f
T ext
: vector representing the Text-based features for the short-text associated with
each offer; the vector contains the dummy variables for the words present in the
text.
Our objective is to predict the CTR for those items not yet sent to the population. Hence,
the dependent variable of our learning problem is the CTR, which has been measured
on items previously sent to mobile phone users (training set). For those messages not
yet tested in the population, we use the predicted CTR to sort the offers and decide
which ones to subject to further testing (i.e., to send to the second learning phase).
To perform the first learning phase and predict the CTR (see Section 2.3), we use
the observed CTR and the static features of the commercial offers previously sent to
users to train a regression-based model. Previous work has used in a similar context
classification methods based on decision trees [6]. Because decision trees require the
dependent variable to assume a discrete form, the authors in [6] convert CTR into per-
formance classes (e.g., Good, Fair, Bad). Unlike this previous research, we propose that
it is possible to perform a more accurate and robust learning process by taking into
account the continuous nature of the CTR (our dependent variable). Hence, instead of
decision trees, we propose to use regression-based methods that can better accommo-
date a continuous dependent variable.
We tested for different regression models on our dataset: Regression Tree (RT) [19],
Locally Weighted Regression (LWR) [20], and Support Vector Regression (SVR) [21].
We selected these regression methods based upon some properties of the relevant fea-
tures:
– Considering the binary nature of text features, RT could be a sensible choice. The
use of RT also follows from what has been done in previous work [6] and allows
us to test the performance of other regression-based methods against alternative
models that rely on discrete dependent variables.
– Due to the complexity and non linearity of our problem (which involves image and
text-based features), it is reasonable to look at the neighborhood of each feature
vector to estimate the CTR of an offer. The LWR method allows exactly the use of
localized information.
– The visual representation based on Textons encodes image as a whole entity; re-
gression methods that take into account the entire representation of an offer, such
as SVR, could then be more appropriate.
To test the RT performance, we used the WAGON library [22] in our experiments.
We implemented the LWR algorithm following the work of [20]. We note that, in using
LWR, we have chosen a metric based on Bhattacharyya Coefficient [23] to compare the
distribution of Textons for each image. In addition, we employed the cosine similarity
4040

(dot product) and the Term Frequency Inverse Document Frequency (TFIDF) method-
ology [24] on Text features. To test SVM, in our experiments we used the epsilon-SVR
algorithm within the LIBSVM library [25], and a radial basis kernel.
Considering the result obtained with the regression methods mentioned above (see
Section 6 below) and taking into account the properties of the MMS feature repre-
sentation (e.g., that Textons provide a global representation, that Text is represented by
binary variables for each relevant word, etc.) we also tested a combination (also called
cascade) of LWR and SVR methods as depicted in Figure 3.
Fig. 3. The Cascade of Regression method involved in the first phase of our learning approach.
We believe the cascade of regression methods we propose is better suited to capture
the properties of each static feature (Visual and Text) and takes into account the specific
strengths of each regression method, as we will show below in our experimental results.
6 Experiments, Results and Discussion
In this section, we describe in detail the experimental setup of our simulated MMS
direct marketing system. Next we describe the results of our experiments using the
proposed learning approach, and we then discuss our main findings.
6.1 Experimental Setup
We randomly split the dataset described in Section 2.1 into three partially overlapping
subsets of 4500 MMS offers each. We sorted the MMS based on their arrival date and
time and used the first 80% of the MMS offers within each subset as training data. We
retained the remaining 20% as our test data.
We run the system simulation for each data subset and assume it works for 14 con-
secutive days. We set the sending rate, S, to 10 (the maximum number of daily trials)
and varied the daily arrival rate M (M ={10,15,20,25,...,50,55}). For each value of the
arrival rate, we assume it remains constant throughout the entire testing period. This
means that, for each run, the overcapacity rate is constant and equal to M − S. Hence,
each day, we accumulate M −S new offers on which we are not able to learn. The initial
offer catalogue size is zero (we start without any items requiring learning). We apply
the proposed two-phase approach to select the best offers to be sent for further testing
(second learning phase, based on traditional learning), and determine the performance
in the simulated system. We test different visual vocabulary sizes (in the clustering of
4141

the visual features we tested for k=100, 200, 400 where k is the number of clusters, i.e.,
the number of visual words). In the experiments presented in the following sub-sections,
we used a vocabulary with 200 visual words because our preliminary tests revealed that
this number provided the best results. We tested for the number of dummy variables
to use in representing the MMS text. We report on the experimental results based on
the best number of dummy variables for each one of the methods applied. Specifically,
through the filtering process discussed in Section 4, we obtain the best results using
an average of 1139 dummy variables in SVR and RT, and an average of 881 dummy
variables in LWR.
6.2 System Evaluation
As stated previously, for those messages not yet tested in the population, we use the pre-
dicted CTR (obtained during a first phase of learning) to sort the offers and decide which
ones to subject to further testing (i.e., to send to a second phase of learning). Hence, we
only perform additional tests to the most promising offers (up to system capacity). We
assess each offer based on performance potential (see Section 2.3). We determine this
potential by multiplying the estimated CTR of each MMS with its price (i.e., the rev-
enue for the provider from each user click). Hence, once the learning phase is complete,
we can compute the overall expected performance of any regression method (RM) tak-
ing into account the set of the chosen MMS offers as follows:
P erf ormances
RM
=
X
m∈Ω
CT R
m
× P RICE
m
(1)
where CT R
m
represents the real click-through-rate of the MMS m ∈ Ω, and P RICE
m
is the corresponding price.
We can also compute the overall system performances when we select randomly the
offers to send to the population for testing (P erformance
RAN D
) as in the traditional
learning case. Note that P erf ormance
RAN D
represents the performance lower bound.
To assess the performance of the proposed approach, we use a data mining measure
called Lift:
Lift =
P erf ormances
RM
P erf ormances
RAN D
(2)
In this case, the Lift provides us a measure of how the proposed approach performs (in
terms of revenue) relative to the traditional pre-testing (in which we do not pre-screen
items for subsequent testing). In addition to the Lift measure, and to better assess the
performances of the proposed learning approach in estimating the CTR of each offer,
we also compute the root mean squared error (RMSE) on the CTR predictions from the
test data Ψ:
RM SE(Ψ ) =
s
P
m∈Ψ
(
[
CT R
m
− CT R
m
)
2
|Ψ|
(3)
RMSE is a frequently used measure of the the distance between the predicted values
of a dependent variable and the true variable values for a given prediction method. Note
also that in Equation 3 the CTRs values were normalized to the range [0,1000].
The RMSE(Ψ ) and the Lift measures were computed for each simulation run. We then
4242
computed the average RMSE and Lift across all data subsets and across all runs. Below,
we will report on such averages.
6.3 Performances of Different Kind of Features
Because we can extract different types of features from our multimedia data (Textons
Based and Text based), we first conduct a performance assessment when using each one
of these features in isolation, with each one of the regression methods (RT, LWR, and
SVR). To determine the most appropriate regression method for each type of feature
when considered in isolation, we compare the RMSE(Ψ ) of the each method-feature
combination. This comparison will also allow us to select the best regression method
we should use to extract knowledge from each feature (which we can then use when
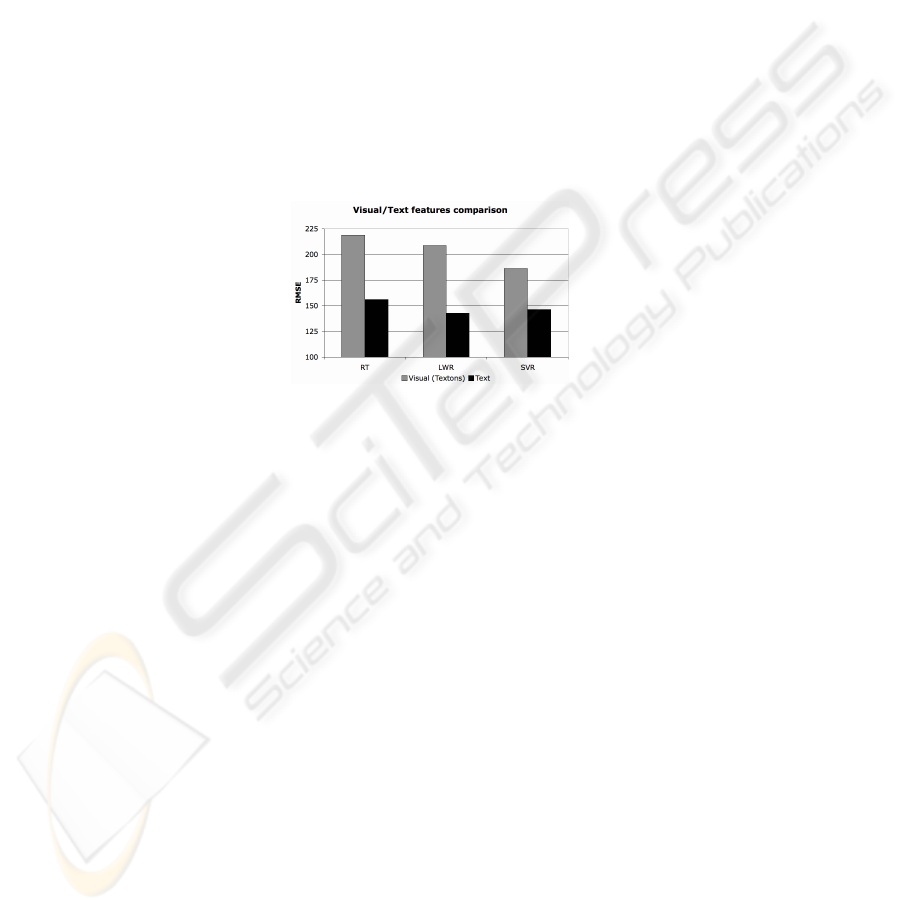
we combine features together in the regression cascade). Figure 4 reports the RMSE(Ψ )
results obtained using visual and text features when used in isolation when using the
alternative regression models.
Fig. 4. RMSE(Ψ ) obtained with the three regression methods RT, LWR and SVR working on each
kind of extracted features.
As we can see from Figure 4, for the Textons-based features we obtain the best
results using the SVR model. We can conclude that the SVR is able to exploit the global
visual representation of f
T extons
, whereas other regression methods, like the RT, are not
able to treat properly the Textons-based visual representation. These other methods rely
on the information from individual components of the visual features at each level of the
tree and do not consider the global information encoded by the combination of visual
features of each MMS.
We can make similar considerations for text-based features. RT is less powerful
than the other two regression methods because it is not able to look at the word-related
dummies jointly. However, to capture the semantic of an offer, it is better to take into
account different words together than to look at each word singularly. LWR works well
because the cosine similarity metric employed works well on the TF-IDF representation
during the experiments. As shown in Figure 4, we also find that text features perform
better than visual features across all regression methods. One possible reason for this
result is that the text might be working as a proxy for the offer’s category (i.e., telling
us whether the offers are connected to music, sports, phone wallpaper, etc.). In this
specific domain application, we do not know a priori the offer’s category (we do not
have the classification of the offers into categories). Hence, we associate the power of
text variables in predicting CTR for each MMS to the ability of the MMS short text
4343

in providing a category semantic. In contrast, the visual representation, though still
showing predictive power, does not perform as well as the text. We conclude then that
the visual component does not provide as clear clues as the text when predicting an
offer’s category or its likeability. Indeed, many of the offers from different categories
are very similar in terms of visual content.
In sum, one important result from our experiments is that text mining on an offers’
short text might provide a good proxy for an offer’s category, and as result, helps pre-
dict its CTR. This result suggests that combining the two sets f static features, visual
and text-based, we are likely to obtain prediction improvements (as both sets of vari-
ables seem to capture different aspects of the message). This result further suggests that
a greedy-like combination of regression methods could potentially provide additional
improvements in CTR prediction. What we propose is to use a combination of regres-
sion methods known as a regression cascade. In this regression cascade, we first use text
to infer the offers’ category (using the best model for text features given by our previous
analysis), and then we combine this result with the information that can be provided by
visual features. We use visual features to find the most similar offers in terms of visual
content, and again use the method most adequate for the visual features (as indicated
by our initial experiments). We will describe in more detail the cascade of regression
methods in next section.
6.4 Combining Visual and Text Features by Cascade of Regression Methods
Taking into account the results of the previous sections, we have combined the dif-
ferent static features using the considered regression methods. We first combined the
visual and text features using SVR model. This regression method obtained good per-
formances on the two types of static features (see Figure 4). We report the RMSE(Ψ )
results for the SVR model in Table 1.
Table 1. The RMSE(Ψ ) results of using visual and text features singularly and jointly in SVR are
reported. Combine together visual and text information give the best results.
Regression Approach RMSE(Ψ )
SVR(f
T extons
) 186,48
SVR(f
T ext
) 146,35
SVR(f
T ext
,f
T extons
) 145,83
From Table 1 we can see that combining visual and text features provides better
predictive accuracy, suggesting that both sets of variables indeed capture different as-
pects of the offers likeability (the SVR model using the visual and text features together
outperforms the results obtained by when using each kind of feature separately). Hence,
the Textons based features seem to be able to capture the visual content whereas, Text
features add semantic information related the category of the offer. Despite these re-
sults, we note that SVR did not provide the best results for the text features (Figure 4).
The best method to exploit text features is the LWR model. In addition, as discussed
in the previous section, our findings seem to suggest that we should use text features
before the visual component in order to capture the category of each MMS offer (e.g.,
music, sport, wallpaper, etc.). Then, we could add the visual features to discriminate
4444

between different visual content and improve predictive ability. This analysis induced
us to use a greedy combination of features and regression methods. The final regres-
sion approach selected involved the LWR and the SVR models in cascade to take first
advantage of the text features and then the visual features.
We tried two alternative formulations for the cascade of regressions. In the first one,
we model the text features using the LWR. We then combined the CTR predicted using
the LWR with the visual features, used a SVR model. The second alternative cascade
tested included also text features directly in the SVR model in addition to the predicted
CTR from the LWR output and the visual features (this cascade model is presented in
Figure 3). We added text features again because the SVR and LWR models provided
comparable result on these features, though they exploit the data in a very different
manner (SVR looks at feature point in the global space whereas LWR looks locally
around the features point). We then exploit again the text features directly in the SVR
to take advantage of the different types of information contained in the text. We report
the RMSE(Ψ ) results of these cascade regressions in Table 2.
Table 2. The RMSE(Ψ) results of using visual and text features in SVR are reported in comparison
with the results obtained by the proposed cascade approach. A cascade of regression methods
achieve best results.
Regression Approach RMSE(Ψ)
SVR(f
T ext
,f
T extons
) 145,83
SVR(LWR(f
T ext
),f
T extons
) 144,04
SVR(f
T ext
,LWR(f
T ext
),f
T extons
) 142,82
From the analysis of Table 2 we conclude that the regression cascade improves the
predictive ability of our system, estimating more accurately the CTR of each offer. The
results seem also to suggest that this method can better capture the properties of each
kind of representation (Visual, Text), and take into account of the peculiarity of each
regression method.
To better understand the performances of the overall system using the cascade ap-
proach, we computed the Lift for alternative model formulations. In Figure 5, we present
these Lift results. It is clear from the figure that using the proposed approach (irrespec-
tive of the final regression formulation) improves significantly the overall performance
of the system producing significantly higher revenue. This is because we selected the
best offers during the first learning phase to be subject to further learning, whereas we
discarded the weakest options did not wasted the scarce testing opportunities with offers
that a priori seemed too weak.
From Figure 5 we can see that the direct marketing system outperforms the tradi-
tional learning approach in more than 35% when the arrival rate is 30 items per day (a
value comparable to the one in the real system) that is comparable to the mean arrival
rate value observed in our real system. In addition, we can clearly see that the perfor-
mances of the system increases as the system constraints become more severe (more
than 30 items arrival per day) reaching 45% of improvement when compared to the
traditional testing system. It is interesting to note also that the proposed approach out-
perform the traditional learning approach also when using only visual features. In such
4545
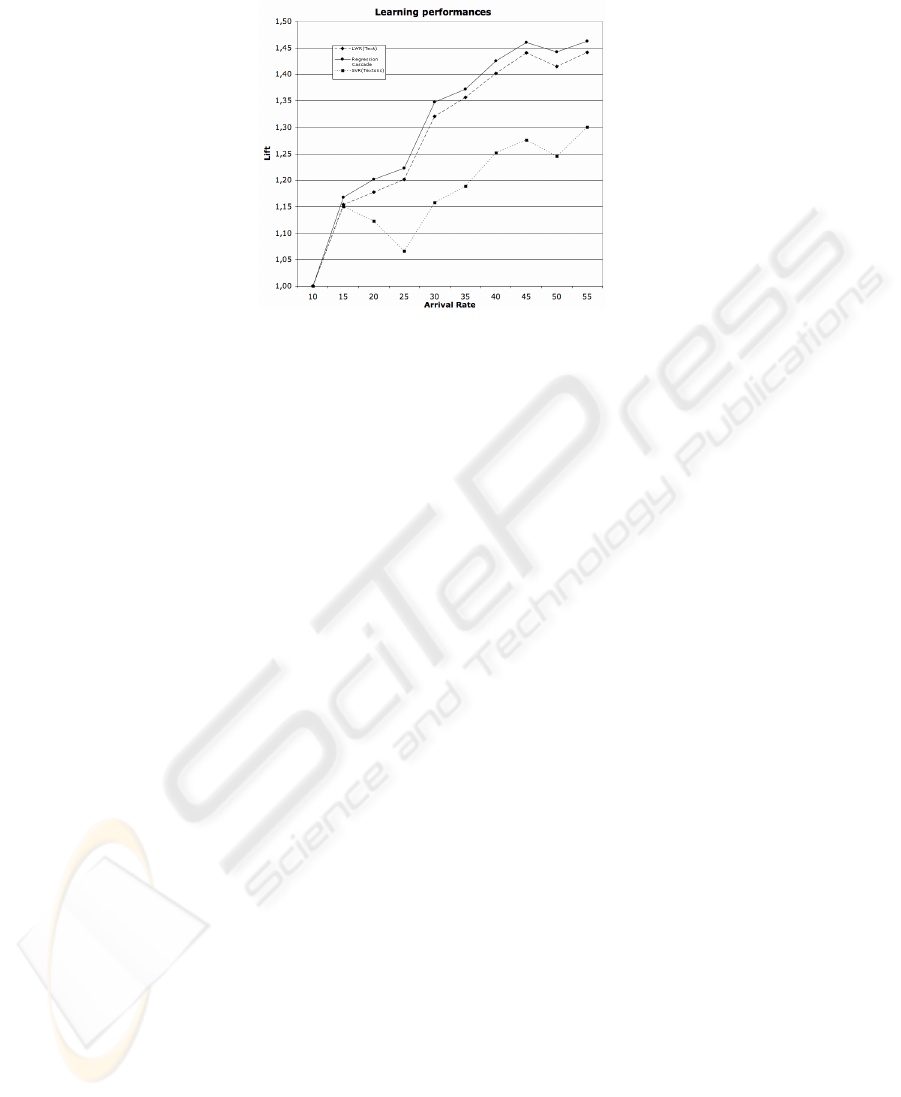
Fig. 5. The plot reports the Lift result obtained by using visual and text features singularly and by
using the cascate of regressiom method.
case, the proposed approach outperforms the traditional testing in more than 16% when
the arrival rate is 30 offers per day.
7 Conclusions and Future Works
A successful approach to improve the performance of direct marketing systems on new
multimedia channels, will require the contribution of wide range of disciplines and tech-
nologies including computer vision, data mining, statistics and marketing. In this paper,
we presented an application domain where we learning needs to take place under severe
time and space constraints. In particular, we propose a two-phase learning approach for
a direct marketing application that relies on Multimedia Messaging Service (MMS) for
offer delivery. In our approach, we propose to exploit the visual and text features of
each MMS offer through a cascade of regression algorithms to estimate the potential
(in terms of expected revenue) of each offer. We demonstrated that this approach leads
to a considerable improvement in overall performance. Researchers and businesses can
also use the presented schema in other domains in which visual and text information is
available.
Future work would require the evaluation of online techniques for the learning phase
strategy (e.g. online boosting [26]), and could take into account also other active learn-
ing strategies based on uncertain sampling. In addition, customers’ behavior and the
offer’s price could be exploited as features and be used jointly with visual and text
features to predict performance. Finally, the combination of different types of features
able to capture text and visual contents should be tested also in other direct marketing
domains.
References
1. Direct Marketing Association: The Power of Direct Marketing: ROI, Sales, Expenditures
and Employment in the U.S., 2006-2007 Edition. Direct Marketing Association (2007)
4646

2. Netsize: Convergence: Everything is going mobile. The Netsize Guide 2007. Netsize (2007)
3. Roberts, M., Berger, P.: Direct Marketing Management. Prentice-Hall (1989)
4. Prinzie, A., Van Den Poel, D.: Constrained optimization of data-mining problems to improve
model performance: A direct-marketing application. Expert Systems with Applications 29
(2005) 630–640
5. Nash, E.: Direct Marketing. McGraw-Hill (2000)
6. Battiato, S., Farinella, G., Giuffrida, G., Tribulato, G.: Data mining learning bootstrap
through semantic thumbnail analysis. In: SPIE-IS&T Electronic Imaging Science and Tech-
nology 2007 - Multimedia Content Access: Algorithms and Systems. (2007)
7. Julesz, B.: Textons, the elements of texture perception, and their interactions. Nature 290
(1981) 91–97
8. Renninger, L.W., Malik, J.: When is scene recognition just texture recognition? Vision
Research 44 (2004) 2301–2311
9. Winn, J., Criminisi, A., Minka, T.: Object categorization by learned universal visual dictio-
nary. In: ICCV ’05: Proceedings of the Tenth IEEE International Conference on Computer
Vision, Washington, DC, USA, IEEE Computer Society (2005) 1800–1807
10. Barnard, K., Forsyth, D.A.: Learning the semantics of words and pictures. In: ICCV. (2001)
408–415
11. Biederman, I., Mezzanotte, R., Rabinowitz, J.: Scene perception: Detecting and judging
objects undergoing relational violations. Cognitive Psychology 14 (1982) 143–177
12. Biederman, I.: Recognition by components: Atheory of human image interpretation. Psy-
chological Review 94 (1987) 115–148
13. Potter, M.: Meaning in visual search. Science 187 (1975) 965–966
14. Oliva, A., Torralba, A.: Modeling the shape of the scene: a holistic representation of the
spatial envelope. International Journal of Computer Vision 42 (2001) 145–175
15. Fei-Fei, L., Perona, P.: A bayesian hierarchical model for learning natural scene categories.
In: IEEE Conference on Computer Vision and Pattern Recognition. (2005)
16. Lazebnik, S., Schmid, C., Ponce, J.: Beyond bags of features: Spatial pyramid matching for
recognizing natural scene categories. In: IEEE Conference on Computer Vision and Pattern
Recognition. Volume 2. (2006) 2169–2178
17. Bergen, J.R., Julesz, B.: Rapid discrimination of visual patterns. IEEE Transactions on
Systems, Man, and Cybernetics 13 (1983) 857–863
18. Varma, M., Zisserman, A.: A statistical approach to texture classification from single images.
Int. J. Computer Vision 62 (2005) 61–81
19. Breiman, L., Friedman, J., Olshen, R., Stone, C.: Classification and Regression Trees.
Wadsworth and Brooks, Monterey, CA (1984)
20. Cleveland, W.S., Devlin, S.J., Grosse, E.: Regression by local fitting : Methods, properties,
and computational algorithms. Journal of Econometrics 37 (1988) 87–114
21. Shawe-Taylor, J., Cristianini, N.: Support Vector Machines and other kernel-based learning
methods. Cambridge University Press (2000)
22. Taylor, P., Caley, R., Black, A.W., King, S.: Wagon, edinburgh speech tools library (1999)
23. Comaniciu, D., Ramesh, V., Meer, P.: Kernel-based object tracking. IEEE Trans. Pattern
Anal. Mach. Intell. 25 (2003) 564–575
24. Oren, N.: Reexamining tf.idf based information retrieval with genetic programming. In:
SAICSIT ’02. (2002) 224–234
25. Chang, C.C., Lin, C.J.: LIBSVM: a library for support vector machines. (2001)
26. Oza, N.C.: Online bagging and boosting. In: Systems, Man and Cybernetics, 2005 IEEE
International Conference on. (2005) 2340–2345
4747
