
A NOVEL FEATURE EXTRACTION AND SELECTION
METHOD FOR STEEL SHEET DEFECTS CLASSIFICATION
Navid Rabbani, Mohammad Alamdari
Disdeh Pardaz Saba Co., Isfahan Science and Technology Town, Isfahan, Iran
Mohammad Rohollah Yazdani
Science & Research Branch, Islamic Azad University (IAU), Tehran, Iran
Farhad Imanpour
Cold-Rolling Mill II, Isfahan’s Mobarekeh Steel Co., Isfahan, Iran
Keywords: Steel Sheet Defects, Feature Extraction, Feature Selection, SFFS, Computational Complexity, SVM.
Abstract: This paper presents a novel approach for detection and classification of steel sheet defects. A Defects
database with enough samples and good imaging conditions introduced. A set of new features proposed to
extract the appropriate textural characteristics from defects images. This is followed by the selection of
important features using SFFS algorithm. Modifications to SFFS feature selection method were presented to
achieve the real-time needs of research. The proposed scheme decrease computational complexity in cost of
little decreasing of classification accuracy.
1 INTRODUCTION
In this paper we propose an algorithm utilizing novel
feature extraction and selection method with an
SVM classifier to detect, recognize and classify the
surface defects of steel strip.
Most of researches in this field suffer from lack
of acceptable steel images with good imaging
conditions and improper consideration for high-
speed production lines ((Guha, 2001), (Swaroop,
2000)) To respond these needs, a system with the
aim of imaging and archiving cold rolled steel sheets
was implanted in Isfahan's Mobarakeh Steel
Company.
2 STRUCTURE OF
IMPLEMENTED SYSTEM
Our scheme, which was implemented in Isfahan's
Mobarakeh Steel Company, was based on these
main subdivisions:
1. Imaging: imaging system with advanced line
scan camera and illumination unit provides 400
micrometer resolution.
2. Pre-processing and image enhancement.
3. Defect Detection and classification: the pre-
processed images have been segmented to non-
overlapping cells with 100 pixels by 100 pixels
dimension. A feature vector has been extracted
from each cell, which passed to classifier block
for labeling the cell with a specific defect.
4. Labels revision and extra information extraction:
the probability of a specific defect occurrence
depends on the position of cell within the sheet
and also the occurrence of defects in neighbor
cells. Regarding to these facts, in this stage, the
labels of defected cells should be revised and
extra information like distance between periodic
defects, could be extracted.
The main issue in this paper is describing the third
stage, which is the most significant procedure in the
processing algorithm.
3 DEFECTS DATABASE
To acheive an acceptable database, implemented
system in Isfahan's Mobarakeh Steel Company,
250
Rabbani N., Alamdari M., Yazdani M. and Imanpour F. (2009).
A NOVEL FEATURE EXTRACTION AND SELECTION METHOD FOR STEEL SHEET DEFECTS CLASSIFICATION .
In Proceedings of the Fourth International Conference on Computer Vision Theory and Applications, pages 250-253
DOI: 10.5220/0001784702500253
Copyright
c
SciTePress
archives thousands kilometers of steel sheet images.
A collection of defects have been collected from
archived images with supervision of quality control
technicians. The database with 2958 samples from 6
defects gathered so far and it’s still growing.
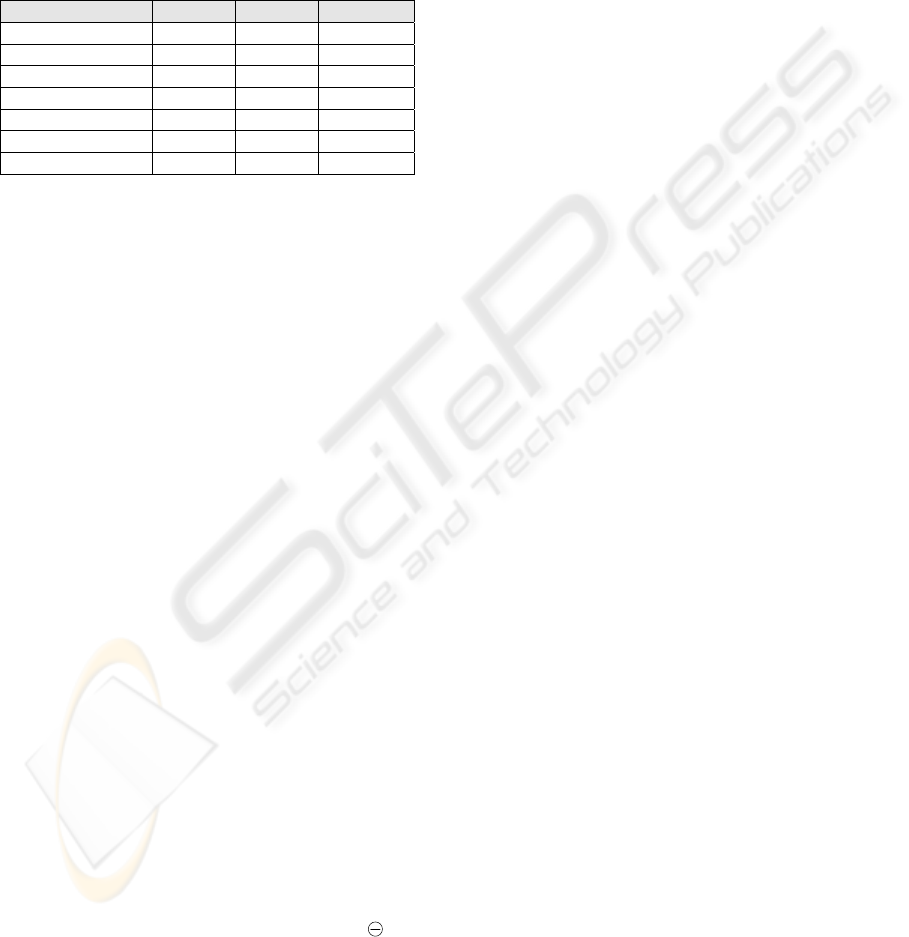
In table 1 the frequency of samples in different
classes has been reported.
Table 1: The frequency of samples in different defects
classes.
TotalTest TrainDefect Name
224110 114Punture
251127 124Roll mark
568283 285Scratch
843420 423Pressure line
5126 25Luder bounds
1021510 511No-Defection
29581476 1482Total
4 FEATURE EXTRACTION
Appropriate to visual look and the texture content of
defects, multiple types of features have been
developed. These features described, here:
Histogram based Features:
A number of defects can be discovered by means
of image histogram. To extract some features
from histogram, there are two approaches. In
first approach, histogram can be modeled by its
statistics, like central moments of different
degrees. In second approach, the histogram can
be quantized to fewer levels and there is no need
to have uniform quantization level. Here, mean
and variance, from former group and eight
features from later one have been selected. The
later features, represents number of pixels with
grayscale value among ranges [0,50], [51,71],
[72,92], [93,113], [114,134], [135,155],
[156,176], [177,255]. These ranges have been
selected wisely to have most discriminative
features over different defects.
Morphology based Features:
To discover the vertical and horizontal edges,
that made by defects, nonlinear gradients can be
employed. In this paper, morphological operators
have been utilized to extract features, measuring
quantitatively presence of vertical and horizontal
edges in image. To reach this purpose,
morphological operator of
)()(
11
SEimSEim
⊗
−⊕
derived with two horizontal and vertical
structuring elements. In each case the number of
pixels in gradient image greater than an adaptive
threshold calculated to represent features.
Linear Gradient based Features:
To extract the edges, linear filters can be used
instead of morphological operators. Here,
vertical and horizontal Prewitt masks utilized to
find the horizontal and vertical edges. Similar to
morphological features, the number of pixels in
gradient image greater than an adaptive
threshold calculated to represent features.
Adaptive Thresholding based Features:
If grayscale values of image’s pixels have the
mean of
M
, thresholds M
α
, M
β
have been
determined, where
1
<
α
,
1>
β
. The number of
pixels with grayscale value greater than
M
β
and the ones with grayscale value less than
M
α
make two features. To determine the values of
coefficients
α
and
β
, pattern search algorithm
used to maximize the Mahalanobis distance
between feature vectors of defects images. (A
slight number of database images used in this
stage, have been omitted from training and test
sets). The optimal result is
92.0
=
α
and
11.1
=
β
.
Quadratic Surface Modeling Features (Guha,
2001):
To identify defects like indents, Quadratic
Surface Modeling can be utilized. A grayscale
image can be assumed as a three dimensional
surface. This surface can be modeled with a
quadratic one.
Once the polynomial parameters are determined,
we get a fairly well idea of the surface profile
from them. The coefficients of the second order
terms
2
X
and
2
Y
, determine the surface
curliness and can be used as features (Guha,
2001).
Hu set of Invariant Moments:
The Hu set consist of a group of nonlinear
centralized moment expressions, which are
invariant under scale, position and rotation.
Radon Transform based Features:
The radon transform computes projections of an
image along specified directions (Gonzalez and
Woods, 2008). Lines with specified direction in
original image make maximums (or minimums)
in radon transform space. By mean of calculating
transform in various directions from 0 to 180
degrees, we are able to find line shaped defects
in specified directions. The features selected as
direction and location of maximum in transform
space.
Hough Transform based Features:
A NOVEL FEATURE EXTRACTION AND SELECTION METHOD FOR STEEL SHEET DEFECTS
CLASSIFICATION
251

To discover line-shaped defects, the Hough
transform also can be used (Gonzalez and
Woods, 2008).
To extract features from Hough transform, first,
edges detected from the image, then each point
of edges maps to a curve in Hough space, all the
curves in Hough space sum together then
maximum point determined, and
θ
,r of
maximum point makes the features.
We can summarize all the features previously
described:
1, 2. mean and variance
3, 4. number of pixels with greater than 25% in
grayscale value after employing horizontal and
vertical Perwiet masks.
5, 6. mean and variance for pixels with grayscale
value less than threshold calculated with Otsu's
method, if threshold effectiveness is more than
65%, else we use mean and variance of all pixels
7, 8. number of pixels greater than 1.11 times of
pixel’s mean and less than 0.92 times of pixel’s
mean.
9, 10, 11, 12. mean and number of pixels with
grayscale value greater than 1.8 times of pixel’s
mean after performing described morphological
operation.
13, 14. the
θ
,r
of maximum point in Hough
transform space.
15, 16. number of edge pixels after employing
edge detection method based on zero-crossing
17, 23. Hu set of invariant moments
24, 25. The coefficients of the second order
terms (
2
X
and
2
Y
), after utilizing quadratic
surface modeling.
26, 33. Requantized nonlinear histogram
34, 35. Direction and location of maximum point
in radon transform space.
5 FEATURE SELECTION
The main goal of feature selection is to select a
subset of d features from given set of D
measurements,
Dd <
without significantly
degrading (or possibly even improving due to the
“peaking phenomena” (Pudil et al., 1994)) the
performance of recognition system. We have been
used Sequential Forward Floating Search (SFFS),
which provides close to optimal solution at an
affordable computational cost ((Pudil et al., 1994),
(Jain and Zongker, 1997)).
5.1 Sequential Forward Floating
Search Algorithm
SFFS algorithm, start with an empty subset and
iteratively add or remove features, trying to
maximize a criterion function, until some
termination condition is met (Jain and Zongker,
1997).
The main issue remains is selecting criterion
function. In most applications, the feature’s
interclass distance (i.e. Mahalanobis distance) being
used as criterion function. It can also be selected as
accuracy of a trained classifier with inspecting
subset of features.
5.2 Criterion Function based on
Computational Cost and Accuracy
In real time application, like automatic surface
inspection, the computational cost is as important as
accuracy. So it’s more realistic to have a criterion
function, which depends on both computational cost
and accuracy. The computational cost consists the
normalized time needed to calculate the inspecting
subset of features.
If total time needed to compute the features of
subset
k
X
is
(
)
k
XT
and the accuracy of classifier
trained with features of subset
k
X
is
()
k
XA
, the
criterion,
J , can be assumed as:
() ()
()
k
kk
XT
XAXJ
′
+
′
=
1
βα
(1)
where
A
′
,
T
′
are normalized values of
A
,
T
and
coefficients
α
β
α
−
=
1, are selected upon to the
relative importance of accuracy and time. It’s
obvious that accuracy criterion is a special case of
accuracy-computational complexity with
1=
α
.
6 EXPERIMENTAL RESULTS
In this section, we demonstrate the effectiveness of
the proposed methodology compared with traditional
methods. To test the described algorithms, the
defects database divided into training and testing
sets. All the purposed features calculated for whole
images in database. In other hand, the mean time for
calculating each feature measured to use in feature
selection procedure as computational complexity.
In feature selection stage, three types of criterion
function were compared:
VISAPP 2009 - International Conference on Computer Vision Theory and Applications
252
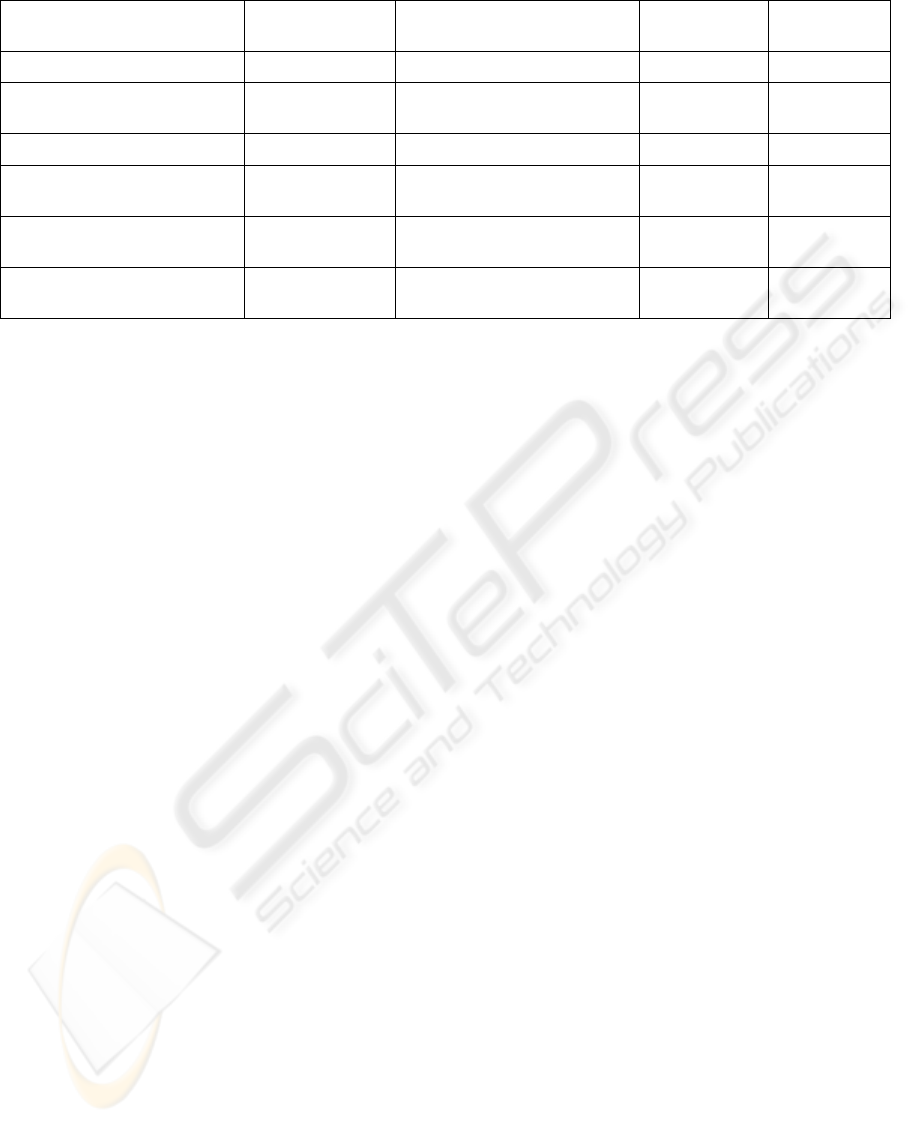
Table 2: Comparing classification results for various feature selection methods.
Classification
Accuracy
Computational
complexity
Optimal subset No. of Features
in optimal subset
Criterion function used by
SFFS Algorithm
89.92% 10432.7 1 .. 35 35 Without feature selection
90.12% 9468.2 13,34,30,31,14,32,29,24,10,33
16,4,11,8,2,3,27,1,21,23,22,18
22 Mahalanobis distance
93.10% 8607 13,9,10,35,1,8,34,16,28,5 10 SVM classifier Accuracy
85.36% 1021 12,11,33,18,24 5 Accuracy-Computational
complexity with
5.0=
α
83.98% 922 12,11,33,18 4 Accuracy-Computational
complexity with
4.0=
α
87.84% 1116 12,11,33,18,24,25,32,3 8 Accuracy-Computational
complexity with
6.0=
α
a) Mahalanobis distance: in each SFFS iteration,
Mahalanobis distance can be calculated simply
from database samples for selected subset.
b) Classifier accuracy: In each iteration, a feature
subset is selected by SFFS algorithm, then
classifier have been trained upon to selected
subset and training database. The classification
accuracy have been calculated using trained
classifier over testing database and it has been
used as criterion value of SFFS for next iteration.
c) Classifier accuracy-computational complexity:
Similar to former routine, we can obtain
accuracy-computational complexity criterion,
using eq. (1)
Several experiments were accomplished for each
suggested criterion functions. SVM used as classifier
with Gaussian kernel and
1
2
=
σ
. In each
experiment, the optimal subset has been determined
by SFFS procedure. The optimal subsets, accuracy
and computational complexity were shown in table
2, where it can be seen that feature selection using
accuracy-computational complexity criterion
outperforms convectional criterions like,
Mahalanobis distance. Also it’s clear that by
regulating
α
, we can attain desired classification
accuracy in cost of computational complexity
increasing and vice versa.
7 CONCLUSIONS
We have presented a scheme for detection and
classification of steel sheet defects. A set of new
features proposed to extract the appropriate
textural
characteristics
from defects images. Feature
selection methods utilized to select outperformed
features, modifications to SFFS feature selection
method were presented to achieve the real-time
needs of research. We can decrease computational
complexity in cost of little decreasing of
classification accuracy
ACKNOWLEDGEMENTS
The authors would like to thank all the experts of
Dideh Pardaz Saba Co. and Isfahan’s Mobarekeh
Steel Co., who have helped us during this research.
In particular, we wish to thank K. Dalvi and M.
Faghih-Imani for their particular efforts.
REFERENCES
Guha, P., 2001, Automated visual inspection of steel
surface, texture segmentation and development of a
perceptual similarity measure, Indian institute of
Technology, Kanpur, Master's Thesis.
Swaroop K Chalasani, 2000, Segmentation and
Performance Evaluation of Steel Defect Images,
Indian Institute of Technology, Kanpur, Master's
Thesis.
Gonzalez R C, Woods R E, 2008, Digital Image
Processing, Prentice Hall, 3
rd
Edition.
Pudil P, Novovicova J, Kittler J, 1994, Floating Search
Methods in Feature Selection, In Pattern Recognition
Letters, Vol. 15, pp. 1119-1125.
Jain A, Zongker D, 1997, Feature Selection: Evaluation,
Application, and Small Sample Performance, In IEEE
Transactions on Pattern Analysis and Machine
Intelligence, Vol. 19, No. 2.
A NOVEL FEATURE EXTRACTION AND SELECTION METHOD FOR STEEL SHEET DEFECTS
CLASSIFICATION
253
