
A Digital Filter Model of Cardiovascular System
and its PZ Plots in Assistance of the Medical Signal
Monitoring and Heart Condition Diagnosis
Susan Vasana and Harold Rivera
University of North Florida, 1 UNF Drive, Jacksonville, FL 32224, U.S.A.
Abstract. In an effort to take advantage of advancements in digital signal proc-
essing and bio-medical technologies, this research has investigated the feasibil-
ity of creating a digital filter model for cardiovascular system. This is based on
the understanding that ABP (Arterial Blood Pressure) waveforms are the car-
diovascular system responses of the heart pumping impulses. The digital filter
model is designed to be able to regenerate the periodic ABP signal as the sys-
tem impulse response to the stimulus of ECG (electrocardio-gram) impulses.
The digital filter model of cardiovascular system is designed and the system
pole-zero pattern (PZ plot) are displayed in the paper. To identify how the
model PZ plot can be used in assistance the diagnosis of cardiovascular condi-
tion, the number of filter coefficients, or the number of samples in a period of
the simulated models, has been explored and the resolution impacts on PZ plot
have been observed. The regenerated signal waveforms from the model with
limited resolution are also compared with the original measured ABP signal
waveforms for accuracy. Using the modern Digital Signal Processing (DSP)
technology, we can implement the model and its PZ plot within mobile/portable
blood pressure monitors with real-time display.
1 Introduction
As one of the leading causes of death in the world, heart disease has and will continue
to receive close attention. Much effort has been expended by the scientific commu-
nity to understand the circulatory system with the ultimate aim of better treatment of
cardiovascular disease. The rapidly growing field of bioengineering addresses many
of the challenges associated with the modeling of biological systems and with the
interface of such systems with man-made constructs.
One of the objectives of this endeavor is to provide with a frequency-domain as-
sessment of the heart. The Fourier series analysis of the ABP signals has been studied
and the research discoveries of the energy patterns of the ABP essential harmonics
have been published in (Ebenal et al., 2007a) and (Ebenal et al., 2007b). From a dif-
ferent aspect, this paper presents a digital IIR (Infinite Impulse Response) filter model
which can regenerate the periodic ABP waveform as impulse response of the filter
system under the pumping impulses from the heart which is represented by ECG
(electrocardiogram). This model also enables analyzing the system characteristics by
pole-zero patterns of the modeled filter systems.
Vasana S. and Rivera H. (2009).
A Digital Filter Model of Cardiovascular System and its PZ Plots in Assistance of the Medical Signal Monitoring and Heart Condition Diagnosis.
In Proceedings of the 1st International Workshop on Mobilizing Health Information to Support Healthcare-related Knowledge Work, pages 97-104
DOI: 10.5220/0001818900970104
Copyright
c
SciTePress

The emphasis of this work is on the signals associated with the cardiac cycle. The
two signals selected are the ECG (electrocardiogram) and the ABP (arterial blood
pressure) measured and recorded synchronously. The filter model presented in the
paper is a “black-box” approach to the cardiovascular system, which will has the
ABP as output signal and ECG as input impulse signal. Both of these signals provide
much information about the performance of the heart.
1.1 Electrocardiogram (ECG)
The electrocardiogram is a graphic of the electrical activity of the heart over the
course of time. This electrical activity is the periodic electrical impulse and the stimu-
lus that caused the heart muscles to contract. The electronic pulses travel to all parts
of the body. In the early days of experimentation with these signals, the challenge was
to detect them. Present technology uses electrodes attached to the skin for detection.
They are normally installed in particular areas of the body in order to detect signals
associated with different sectors of the heart tissue (Ifeachor, 2001). An ECG then
actually displays the voltage between pairs of the electrodes. When these levels are
plotted, they can represent the overall rhythm and operation of the heart. The test is
currently the best method of detecting abnormal rhythms in the heart beat. The illus-
tration in Figure 1 shows the electrocardiogram plot side to side other cardiac cycle
parameters. The fundamental events in the cardiac cycle are marked in the plot to
show their influence. The dark blue signal is Electrocardiogram signal and the light
blue signal is the Ventricular pressure which is similar to ABP used in our study. The
ABP signals are measured and recorded synchronously with the corresponding ECG
signals in our sample data.
Fig. 1. Cardiac Cycle (Destiny Quest, 1997).
1.2 Arterial Blood Pressure (ABP)
The main signal used in the modeling is the arterial blood pressure (ABP) waveform
measured over time. The ABP signal provides with good indicator of the cardiac
98
health of the patient. In fact, it is used by doctors while in surgery to monitor the
status of the patients. However, how to interpret the cardiovascular system conditions
based on the ABP waveforms are solely based on doctor’s experience and observa-
tion. The models presented in the paper and their pole & zero plots are attempted to
make it visual friendly. The measuring of ABP waveform is not a non-invasive me-
thod; it requires the doctor to inject a probe into the patient’s blood vessels. One of
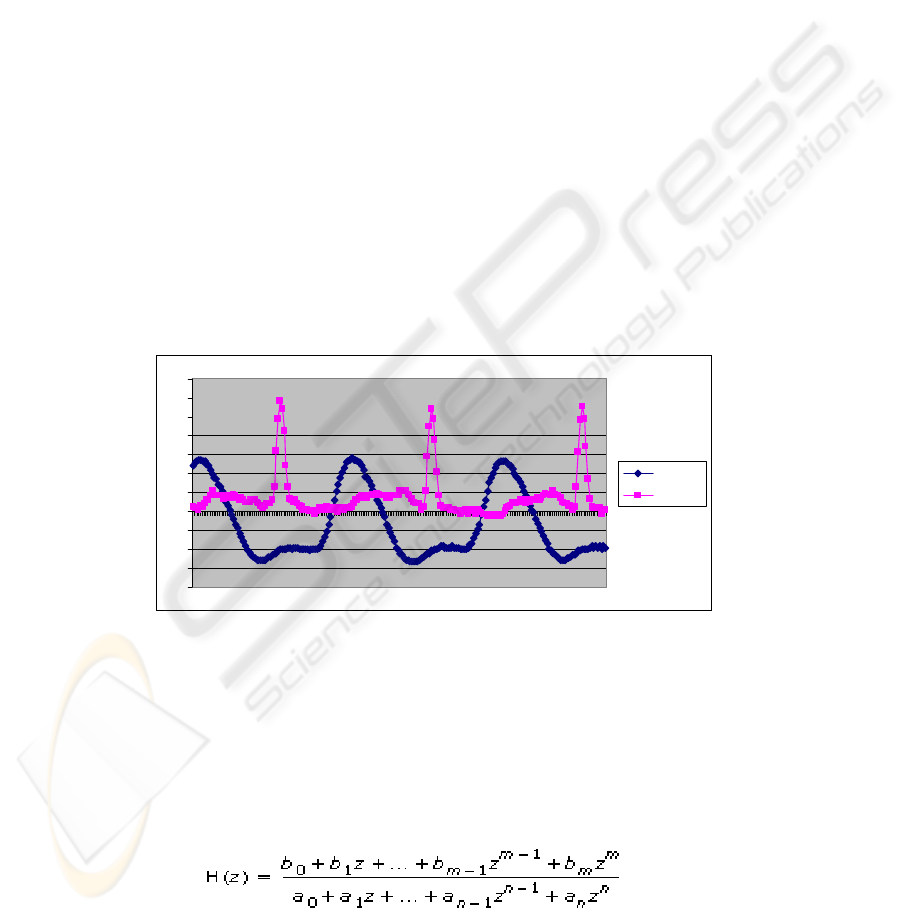
the samples of raw data (with sampling frequency of 25000 samples per second) of
the ABP and ECG waveforms is displayed in Figure 2, where series 1 is the ABP
trace and series 2 is the ECG trace.
2 Digital Filter Modeling
At some point in the beginning of the process, the main objective was to develop a
scheme in which the doctor conducting a surgical procedure is able to monitor the
cardiac status of the patient. That endeavor eventually diverged into several inde-
pendent approaches to the modeling of the cardiovascular system using digital system
theory. The analysis described in this paper corresponds to one of the variants. The
overall idea is to use the “black box” approach to find a mathematical model of the
system, even without complete knowledge of the inner workings of the cardiovascu-
lar system. Considering the great complexity of the heart and cardiovascular system,
this “black box” approach is a very reasonable step forward.
-4
-3
-2
-1
0
1
2
3
4
5
6
7
1 16 31 46 61 76 91 106 121 136 151 166 181 196 211
Series 1
Series 2
Fig. 2. Sample of Raw Data (ABP & ECG).
The data from the patients (ECG and ABP) is collected as digital samples. All of
the analyses on data presented here are performed on sampled data. For digital filter
systems and its associated signals, the Z transform is used. The Equation (1) shows
the general case of the transfer function of a digital filter system in (Orfanidis, 1996).
As mentioned earlier, the ABP waveforms starting at ECG impulses for each patient
will be represented by impulse responses of a filter system with such transfer func-
tion.
(1)
99

There exists a class of digital systems that receive an impulse as the input and
generate the output as a periodic signal. These are called digital periodic signal gen-
erators. The objective is to create a digital filter that upon an impulse train input (us-
ing ECG for alignment) to generate the periodic ABP waveforms as the output. It is
from this filter that the poles and zeros would be extracted and analyzed. Here the
illustration follows Orfanidis’ treatment in (Orfanidis, 1996).
It is clear that due to the periodicity of the ABP signal, only one period (or a car-
dio cycle) need to be specified. For the purposes of the underlying objective, it is
possible, under the above results, to generate any periodic signal by specifying only
the values corresponding to one period.
If there are D samples in a period of the signal waveform represented by the im-
pulse response as follow
h = [ b
0
, b
1
, b
2 . . .,
b
D – 1, …..
, b
0
, b
1
,
, . . .,
b
D - 1 ….
],
A digital filter with the transfer function as the equation (2) can be used to regenerate
the periodic waveform (Orfanidis, 1996):
H(z) = b
0
+ b
1
Z
-1
+ b
2
Z
-2
+ … + b
D-1
Z
-(D-1)
1 – Z
-D
(2)
The technique shown is a known method of regenerating periodic digital signals.
The result of this method is a digital filter that upon receipt of an impulse has an im-
pulse response matched to the signal being modeled. In the modeling case the de-
signed filter regenerates ABP periodic waveforms starting with their corresponding
ECG signal impulses. The filter coefficients in the numerator of the transfer function
can be obtained from the ABP signal samples in a period (cardio cycle). For the car-
diovascular model, the values for the b coefficients correspond to the desired impulse
response are the samples in one period of ABP waveform. The denominator coeffi-
cients are adjusted to reflect the number of samples in a period (cardio cycle), then
the impulse response is exactly a periodic regeneration of the ABP signal waveform.
In this manner, the filters are represented by impulse responses as the ABP signal
waveforms starting with ECG signal impulses. Each ABP waveform has a filter that
can reproduce the exact the same periodic signal. In many ways, the digital filter is a
“black box” of the heart system under measurement, exhibiting the some behavior of
the heart and cardiovascular system in terms of ECG and ABP signals.
In order to develop an alternate visual expression of an ABP waveform, the au-
thors selected the Pole-Zero patterns (PZ plot) as another system representative of the
cardiovascular system. First, a PZ plot is a very popular system diagram that shows
the poles and the zeros in the complex digital frequency domain (z plane). Second,
the poles and zeros are believed to be the critical points of the modeled system, which
may carry important information about the cardiovascular system conditions. The PZ
plot is a complete representation of a digital system.
It needs to note that the transfer function and the corresponding PZ plot apply to
linear time-invariant systems (LTI). Therefore, the approach described below, is to
regenerate the ABP waveforms as impulse responses of linear time-invariant digital
filter systems (Ingle, 2000).
Given the difficulty of obtaining ABP data (recall that a probe is inserted in the
100

subject’s blood vessels) the patient pool provided a good start upon which to build.
Two patients were selected from a pool of data. Unfortunately, the authors were given
little or no information regarding the demographics of the patients. This is not good
for the heart condition classification, but at this point, the thrust is to launch the poles
& zeros pattern (PZ plot) of the model as a useable diagnosis tool. The data available
is sufficient to start the inquiry. For the two patients, both waves were recorded syn-
chronously: the ECG signal and the ABP signal.
The data was collected using specialized instrumentation equipment. The instru-
ments have appropriate sampling rates. For instance, most of the data used in the
analysis was sampled at 25,000 samples per second. Recall that each data sample in a
period represents a coefficient on the numerator and an order in the denominator. The
sampled raw data, if down-sampled uniformly, still carries the sufficient message
with some negligible error. For the purposes of the PZ plot analysis, the authors be-
lieve that a characteristic placement, representative of a patient, would be observable
even if the data is greatly down-sampled. For this reason, it was decided that the reso-
lution of a PZ plot with less than one hundred poles and zeros is explored for the
purposes of this work. It was decided to try to have signals with a period represented
by data sets of 18, 30 and 75 data samples. Figure 3 shows both ABP waveform and
its associated PT plot using a data set of 30 samples in a cardio cycle. The PT plot
adds a visual friendly display of the ABP waveform for the doctor’s observation and
monitoring of the cardiovascular condition of the patient.
All analyses were performed using MATLAB (with the MATLAB Signal Proc-
essing Toolbox and the Filter Design Toolbox (Lynn, 1999)) from Mathworks
(
http://www.mathworks.com/products/signal/), and Signal Processing Workstation (SPW)
from Coware(
http://www.cerc.utexas.edu/~tujiajin/spwtutorials.pd). Both are very power-
ful and widely used signal processing software packages. Their capabilities are very
similar. MATLAB was ultimately selected for presentation, but analysis was also
completed in SPW.
Fig. 3. ABP data and PZ plot for Patient 1 (30 samples).
3 Simulation Results
The PZ plots for each of the patients do exhibit differences among the patients. Al-
101

though it is not clear at this point what these differences are attributed to, their mere
presence invites further research. From the filter transfer function in Equation (2), it is
noticed that the zeros are the critical points of the modeled system; the poles are there
just to make the output signal periodic. One important objective of the analysis is to
gauge the level of granularity needed to construct an appropriate portrait of the pa-
tient’s heart condition using the PZ plot. The number of coefficients, equivalent to the
number of samples per signal period (cardio cycle), will result the same number of
poles and zeros, which gives the resolution of PZ plot. While some of the plots with
very low coefficient numbers appeared to may have “lost” some information, the ones
with too many zeros tended to “bury” them in clogged plots.
The ABP signal waveforms from patient 1 were used in simulation. Referring to
Figure 4 and Figure 5 below, the plots represent the model of patient 1 at two differ-
ent levels of resolution. Recall that the values are down-sampled samples from the
same data set. In Figure 4, the ABP signal is down-sampled to 18 samples in a period;
while in Figure 5, the signal is represented by 75 samples in a period. The first plot
(Figure 4) shows two zeros on the real axis on the right. In the higher resolution plot
(Figure 5), the outlier appears closer due to scaling. It is noticed that most zeros are
close to the unit circle.
Fig. 4. PZ plot for Patient 1 (18 samples).
Fig. 5. PZ plot for Patient 1 (75 samples).
The PZ plots also illustrate the trade offs in the selection of the number of samples
per period. The lower-resolution plot has its zeroes in a more appreciable, less clut-
tered, pattern that may lend itself better for comparison than the corresponding high-
er-resolution plot. However, as seen in the other examples, the seemingly clearer
graph may or may not carry more information.
Thus, the number of coefficients in the filter affects the scale of the graph and the
ability of the analyzer to assess the difference between the plots. It is not clear at this
point at which level of resolution in the plots would be appropriate for all patients. An
idea has been formed that it will be helpful for doctors to observe the cardiovascular
102

conditions of patients to have PZ plot displayed with ABP signal side by side with
tunable resolution. That is, the number of samples in a period can be varied or adjust-
able to have both the accuracy and clarity.
Fig. 6. PZ plot for Patient 2 (18 samples).
Figures 6 shows the PZ plot of the model for a second patient at 18 samples per
period. Close observation of the PZ plots (Figure 4 and Figure 6) show differences in
the placement of the zeroes between patient 1 and patient 2.
What appears as an early accomplishment of the approach is the ability of the digital
filter models to closely match the ABP sampled data. The impulse responses appear
quite accurate to represent ABP signals even at the lower sampling resolution. The
impulse response regenerated is simply used here as a device to verify the accuracy of
the modeling. The following impulse response graphs (Figure 7) correspond to data
generated by the modeled digital filter. They are shown with the raw ABP data in the
same figure to illustrate the effectiveness of the model. The signals are shown for
only one period (cardio cycle), but their impulse response is essentially periodic. Only
the data corresponding to patient 2 is shown here. The graphs for other patients are
very similar in accuracy as the filter coefficients use the samples of ABP signals in a
period.
-3
-2
-1
0
1
2
3
123456789101112131415161718
Fig. 7. Impulse Response of Modeled filter of Patient 2 (18 samples) with raw ABP data on
top, regenerated data on bottom.
103

4 Conclusions
The approach described in the paper attempts to use a digital filter to have a “black-
box” model of the heart and the cardiovascular system of a patient. This digital filter
generates the impulse responses which match with periodic ABP signal waveforms
starting with ECG signal impulses. The pole & zero patterns of the modeled digital
system can be displayed in PZ plots. As poles and zeros are critical points on Z plan
to determine the characteristics of a digital system, the PZ plots of the models of
patients are believed to carry important information about the conditions of the car-
diovascular system under monitoring. The visual PZ plot with tunable resolution can
be displayed with original synchronized ABP and ECG signals to assist doctor in
operation monitoring or illness diagnosis. This model also can be used to gain in-
sights about human heart function and cardiovascular system in further modeling.
The resolution has been tested in simulations and the different impacts on PZ plot
have been observed. While some of the plots with very low resolution appear to have
“lost” some information in zeros, the ones with too high resolution tends to “bury”
the information in clogged plots. The regenerated signal waveform from the model is
shown to be close representative of the original raw signal samples.
Further investigation undergoing are in terms of how much sensitivity would the
PZ plots to reveal the subtle irregularities associated with cardiovascular diseases and
the DSP chip implementation of the model and PZ pattern real-time display in mo-
bile/portable blood pressure monitors.
Acknowledgements
The University of North Florida, in conjunction with the Mayo Clinic at Jacksonville,
has embarked in an effort to apply signal and system theory of digital signal process-
ing to data collected at the St. Luke’s Hospital in order to gain insights into the be-
havior of the heart system. Special thanks to Dr. Tim Shine in the patient data acqui-
sition.
References
1. Ebenal, A. J., Vasana S., Clinton, C., Cox, D., and Shine, T., 2007. Arterial Blood Pressure
System Modeling and Signal Analysis. The 7
th
IEEE International Symposium on Compu-
tational Intelligence in Robotics and Automation (CIRA 2007), Jacksonville, Florida, June
2007.
2. Ebenal, A. J., Vasana, S., and Shine T., 2007. The Essential Harmonics Of Arterial Blood
Pressure Signals, The 3
rd
IASTED International Conference on Telehealth, Montreal, Can-
ada, May 2007.
3. Ifeachor, E, 2001. Digital Signal Processing: A Practical Approach, Prentice Hall.
4. Destiny Quest from the ECG Basics, 1997, Free Medical Manual
5. Orfanidis, Sophocles, 1996. Introduction to Signal Processing, Pg 326, Prentice Hall.
6. Ingle, Vinay, 2000. Digital Signal Processing using Matlab, Ch 4, 8, 9, Thomson Learning.
7. Lynn, Paul, 1999. Introductory Digital Signal Processing, CH 4, John Wiley and Sons.
104
