
A GENETIC ALGORITHM FOR CLUSTERING TEMPORAL DATA
Application to the Detection of Stress from ECG Signals
Liliana A. S. Medina
Instituto de Telecomunicac¸˜oes, Instituto Superior T´ecnico, Lisboa, Portugal
Ana L. N. Fred
Instituto de Telecomunicac¸˜oes, Instituto Superior T´ecnico, Lisboa, Portugal
Keywords:
Genetic algorithm, Unsupervised learning, Temporal data, Electrocardiogram, Stress detection.
Abstract:
Electrocardiography signals are typically analyzed for medical diagnosis of pathologies and are relatively
unexplored as physiological behavioral manifestations. In this work we propose to analyze these signals with
the intent of assessing the existence of significant changes of their features related to stress occurring in the
performance of a computer-based cognitive task.
Given the exploratory nature of this analysis, usage of unsupervised learning techniques is naturally adequate
for our purposes. We propose a work methodology based on unsupervised automatic methods, namely clus-
tering algorithms and clustering ensemble methods, as well as on evolutionary algorithms.
The implemented automatic methods are the result of the adaptation of existing clustering techniques, includ-
ing evolutionary computation, with the goal of detecting patterns by analysis of data with continuous temporal
evolution. We propose a genetic algorithm for the specific task of assessing the continuous evolution and the
separability of the stress states.
The obtained results show the existence of differentiated states in the data sets that represent the ECG signals,
thus confirming the adequacy and validity of the proposed methodology in the context of the exploration of
these electrophysiological signals for emotional states detection.
1 INTRODUCTION
Of the existing pattern recognition methods, unsu-
pervised learning is especially appealing to organize
data which has little or no labeling information as-
sociated to it. A clustering algorithm organizes the
patterns into k groups or clusters, based on the simi-
larity or dissimilarity values between pairs of objects
such that objects in the same cluster are more simi-
lar than objects of different clusters (Xu and Wunsch,
2005) (Jain et al, 1999). The adopted similarity might
be statistical or geometrical, such as a proximity mea-
sure based on a distance metric in the d-dimensional
representationspace of the d featuresthat characterize
the data. The result will be a partition of the analyzed
data set.
The work presented here is centered on the anal-
ysis of temporal series of electrophysiologicalsignals
from an unsupervised learning perspective to assess
in particular the existence of differentiated emotional
states. Given that typically the signal is characterized
by a continuous temporal evolution, this means that
the values of the features that represent it will also
change gradually with time and that will possibly re-
flect transient emotional states present in the structure
of the signal. In the clustering context, the fact that
such transient states occur means that it is difficult to
assign signal samples to clusters such that each clus-
ter corresponds to a differentiated state. This repre-
sents a challenge in the implementation of clustering
methods to analyze temporalseries like the aforemen-
tioned electrophysiological signals because the clus-
ters are not well separated, which in turn introduces
ambiguities in the observation of differentiated emo-
tional states.
In order to assess and evaluate the existence
of these emotional states, we propose an analysis
methodology based on a genetic algorithm combined
with state of the art clustering techniques. The goal
of this work methodology is to eliminate transient
135
A. S. Medina L. and L. N. Fred A. (2010).
GENETIC ALGORITHM FOR CLUSTERING TEMPORAL DATA - Application to the Detection of Stress from ECG Signals.
In Proceedings of the 2nd International Conference on Agents and Artificial Intelligence - Artificial Intelligence, pages 135-142
DOI: 10.5220/0002752601350142
Copyright
c
SciTePress
states in order to clarify the existence of well sep-
arated clusters, each corresponding to differentiated
states present in the temporal series of data.
This methodology may be applied to temporal se-
ries of electrophysiological signals acquired during
the performanceof cognitive tasks, such as electrocar-
diography signals (ECG) or electroencephalography
signals (EEG). In this paper we specifically address
the identification of stress from ECG signals.
2 APPLICATION DOMAIN:
DETECTION OF STRESS FROM
ECG SIGNALS
The temporal series analyzed correspond to electro-
cardiography, or ECG, signals. These signals are part
of a more vast experience of multi-modal acquisition
of physiological signals - the HiMotion project. The
ECG signals were acquired from a group of 24 sub-
jects performing a stress inducing cognitive task, il-
lustrated in Figure 1. This task is a concentration
test that consists of the identification and annotation
of pairs of numbers that add to 10, by examination
of the lines of a matrix of 20 lines per 40 columns of
numbers (Gamboa, 2008). The population of subjects
is comprised of 18 males and 9 females, being their
mean ages 23.4 years. For each one of these subjects,
a montage with two electrodes called V
2
bipolar sin-
gle lead electrocardiogram was used to collect signals
from the heart (Gamboa, 2008).
Figure 1: Concentration task - examination of a matrix with
800 numbers.
Given that this concentration task is stress induc-
ing, the following methodology is applied to the ECG
signals in order to assess the existence of stress states.
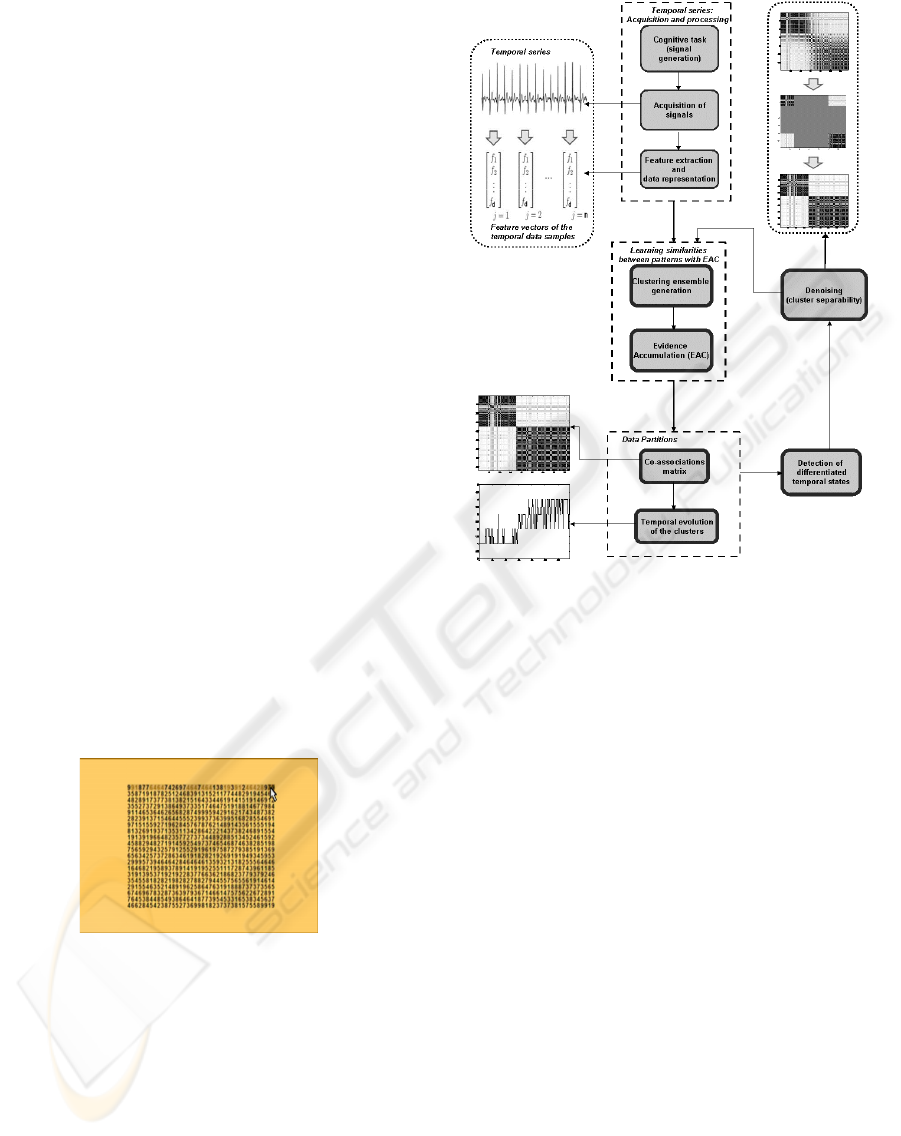
3 PROPOSED METHODOLOGY
We propose a methodology for analysis of temporal
data series, represented in Figure 2. It is based on un-
supervised learning techniquesin orderto unveil simi-
Figure 2: Proposed work methodology for analysis of tem-
poral series. The time series illustrated corresponds to ECG
signals.
larity relationsbetween the temporalpatterns that rep-
resent the data, and also to detect differentiated states
in the temporal sequences that represent the data by
applying a genetic algorithm specifically conceived
for this purpose. After the acquisition and prepro-
cessing of electrophysiological signals, these are rep-
resented by a set of j samples. Each sample corre-
sponds to a given segment of the signal, therefore be-
ing associated to a time stamp, and is characterized
by a d-dimensional feature vector, f = { f
1
... f
d
}.
The proposed methodology encompasses steps of
learning similarities between temporal patterns and
the detection of states from these. These two main
steps are described in the following subsections. The
overall process consists of refining the state detection
by means of a genetic algorithm that uses the out-
put of these clustering and state detection procedures.
The proposed genetic algorithm is described in detail
in Section 4.
3.1 Learning Similarities with Evidence
Accumulation
Different clustering algorithms lead in general to dif-
ferent clustering results. A recent approach in unsu-
ICAART 2010 - 2nd International Conference on Agents and Artificial Intelligence
136
pervised learning consists of producing more robust
clustering results by combining the results of differ-
ent data clusterings. Groups of partitions of a data
set are called clustering ensembles and can be gener-
ated by choice of clustering algorithms or algorithmic
parameters, as described in (Fred and Jain,2005). Ev-
idence Accumulation (EAC) is a clustering ensemble
method that deals with partitions with different num-
ber of clusters by employing a voting mechanism to
combine the clustering results, leading to a new mea-
sure of similarity between patterns represented by a
co-association matrix. The underlying assumption is
that patterns belonging to a ”natural” cluster are very
likely to be assigned in the same cluster in different
partitions. Taking the co-occurrences of pairs of pat-
terns in the same cluster as votes for their association,
the N data partitions of n patterns are mapped into a
n× n co-association matrix:
C(i, j) =
n
ij
N
(1)
where n
ij
is the number of times the pattern pair (i, j)
is assigned to the same cluster among the N partitions.
The final partition is then extracted from the learned
similarity matrix (co-association matrix) by employ-
ing, for instance, a hierarchical clustering method.
Graphically, the clusters can be visualized in the
representation of the co-association matrix: if con-
tiguous patternsbelongto the same cluster, then quad-
rangular shapes will be present in this representation
that correspond to neighboring patterns that are as-
signed to the same cluster in different partitions of
the data (Lourenc¸o and Fred, 2008). A co-association
matrix is illustrated in Figure 3(a). The chosen color
scheme ranges from black to white (grayscale), cor-
responding to the gradient of similarity. Pure black
corresponds to the highest similarity. Given that our
major goal is to test that the temporal evolution of
emotional states corresponds to a temporal evolution
of the analyzed signal, the graphical representation of
the co-association matrix is a powerful tool to assess
the relationships of signal samples ordered by instant
of occurrence.
The final partition can be extracted from the co-
association matrix by applying a hierarchical cluster-
ing method. For the work here described, five ag-
glomerative hierarchical methods were used: Single
Link (SL), Complete Link (CL), Average Link (AL),
Ward’s Link (WL) and Centroid’s Link (CenL). De-
tailed descriptions and studies of these algorithms
may be found in (Jain and Dubes, 1988).
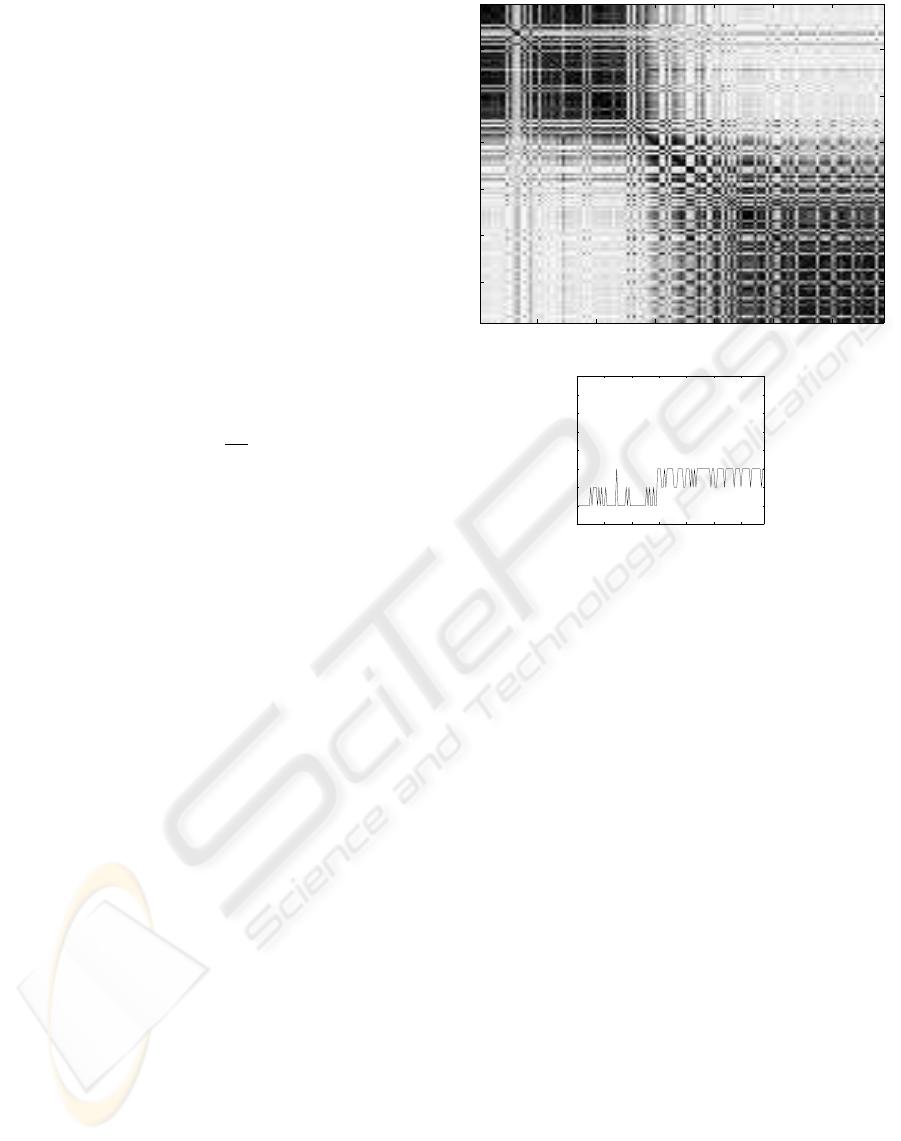
An example of an extracted partition for a set of
temporal series samples is depicted in Figure 3(b),
where the relationship between the temporally se-
quenced samples (x-axis) and the cluster to which
20 40 60 80 100 120
20
40
60
80
100
120
(a) Co-association matrix.
0 20 40 60 80 100 120
0
1
2
3
4
5
6
7
8
(b) Cluster evolution over
time.
Figure 3: Subject 6 - Graphical representation examples.
they are assigned (y-axis), is emphasized. It is possi-
ble to observe that cluster transitions generally occur
between adjacent clusters: cluster 1 evolves to cluster
2, cluster 2 evolves between clusters 2 and 3, etc. This
is a meaningful result for the testing of the hypothesis
of temporal evolution of emotional states.
3.2 Detection of Temporal States
The detectionof temporal states is performedby com-
paring and examining the temporal evolution of clus-
ters of all the partitions produced from the learned
similarity matrix, by different hierarchical methods,
and for several extraction criteria. The goal of this
analysis is the assessment of underlying structures
that might correspond to the temporal evolution of
differentiated states. The proposed criteria for this as-
sessment are illustrated in Figure 4. Each criterion
considers sample segments of the temporal evolution
of the clusters. Differentiated states are detected if:
1. There are segments such that all the samples of
each segment belong to a single cluster (Figure
4(a));
2. Each segment is comprised of samples belong-
ing to different clusters, such that each of those
GENETIC ALGORITHM FOR CLUSTERING TEMPORAL DATA - Application to the Detection of Stress from ECG
Signals
137
(a) Criterion 1. (b) Criterion 2.
(c) Criterion 3.
Figure 4: Visualization of the proposed state detection cri-
teria.
segments corresponds to a unique combination of
clusters (Figure 4(b));
3. There are segments that correspond either to a sin-
gle cluster or to a unique combination of clusters
(Figure 4(c)).
4 GENETIC ALGORITHM FOR
DENOISING OF THE DATA
To assert the existence of stress states with continuous
temporal evolution, one of the hypothesis to be tested
is that each stress state corresponds to a single group,
or possibly to an unique combination of two or more
groups. On the other hand, the occurrence of several
transient states may induce ambiguities in the obser-
vations of the graphical representations of the clusters
evolution, and obscure the structure of the data. These
transient states correspondto an intermediategroupof
samples of the temporal series which represents the
analyzed signal. It is expected that, after removing
this subset of samples from the original data set and
performing EAC on the clustering ensemble based on
the new reduced data set, a structure of separate states
might emerge from the respective co-association ma-
trix.
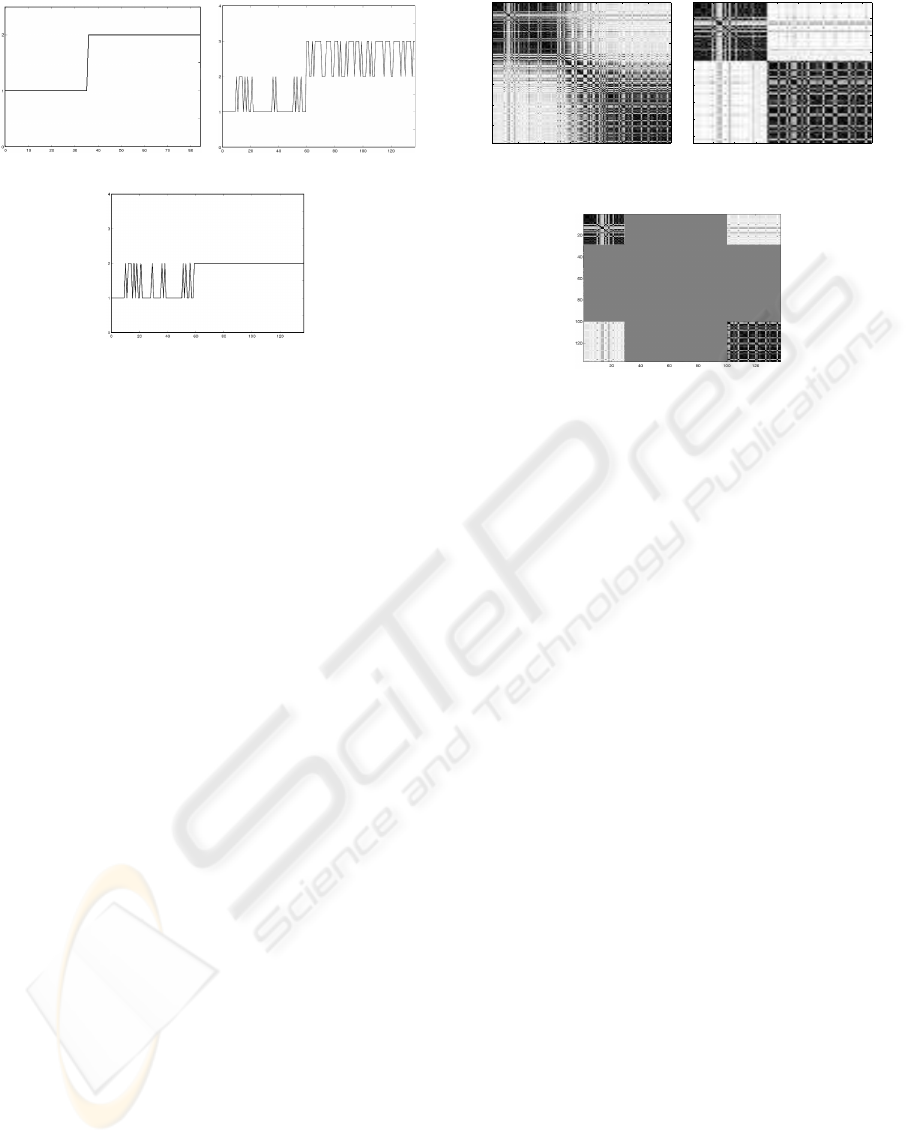
Figure 5 illustrates the testing of the existence of
at least two well separated stress states, each corre-
sponding to a single cluster, by denoising. Figure 5(a)
represents the co-associations matrix that corresponds
to the original data set of subject 6; Figure 5(c) illus-
trates the group of samples to be removed in order to
obtain two completely separated quadrangular blocks,
with no transient structures between them; finally Fig-
20 40 60 80 100 120
20
40
60
80
100
120
(a) Original data set co-
association matrix.
10 20 30 40 50 60 70 80
10
20
30
40
50
60
70
80
(b) Denoised data set co-
association matrix
(c) Intermediate subset of
samples to be removed.
Figure 5: Example of the application of denoising.
ure 5(b) illustrates the co-association matrix obtained
from the new data set.
The intermediategroups of samples to be removed
are determined by applying a task-specific genetic
algorithm (GA), specifically conceived and imple-
mented for this purpose. Several operators and proce-
dures must be declared in order to define a particular
GA (Sumathi et al, 2008). These operators were de-
fined for the denoising GA as follows and the GA is
summarized in Table 1.
Representation. Each individual is a set of samples,
generated after one or more subsets of intermediate
samples are removed from the original data set. The
first pattern of the removed subset is called minimum
limit, (l
min
), and the last pattern is referred to as max-
imum limit, (l
max
).
Fitness Function. The evaluation of the fitness value
of each individual is comprised of two stages, each
concerning a partial fitness value function.
1. Determine if two or more of the m partitions that
are associated to the individual are consistent, or
similar. Two partitions are said to be similar if
the same samples are assigned by different hierar-
chical methods to the same clusters. The partial
fitness value, F
1
, is incremented for every consis-
tent partition extracted by two or more hierarchi-
cal methods:
F
1
=
∑
P
Consistent
(2)
2. Determine, for each of the m partitions associated
to the individual, the degree of cluster separabil-
ity. Given that we want to assess the existence
ICAART 2010 - 2nd International Conference on Agents and Artificial Intelligence
138

Table 1: Proposed GA for denoising of the data sets.
1. Generate randomly a population of M individ-
uals.
2. Produce a clustering ensemble for each of the
individuals of the current population, G
i
. Apply
EAC and extract from each of the resulting co-
association matrices m final partitions with m hi-
erarchical methods according to the lifetime crite-
rion. Each individual has m associated partitions.
3. Evaluate the fitness of each individual.
4. If a termination criterion is satisfied, then ter-
minate the algorithm.
5. Initialize an empty new population, G
i+1
. Add
individuals to it according to the following proce-
dure:
5.1 Select a pair of individuals from G
i
.
5.2 Recombine the selected individuals. This op-
eration has a probability of occurrence of p
R
.
5.3 Randomly mutate the new individuals. This
operation has a probability of occurrence of p
M
.
5.4 Insert the new individuals in G
i+1
.
6. Return to step 2.
of completely separated states and given that the
data samples are temporally ordered, the separa-
bility criterion is based on temporal separability.
Giving as an example the removal of a single in-
termediate subset, the individual can be said to be
comprised of two smaller sets: one correspond-
ing to the samples of lower temporal index than
the index of l
min
, and another set corresponding to
the samples of higher temporal index than the in-
dex of l
max
. Two clusters are completely separated
if the samples assigned to the first cluster belong
to the first temporal segment, and the samples of
the second cluster belong to to the final temporal
segment. This means that the evaluated partition
correspondsto a structure of two completely sepa-
rated states, thus removing any ambiguities for the
observation of partitions and state detection. This
procedure is generalized to more that one subset
of intermediate samples.
Figure 6 illustrates the given example: a partition
of the original data set is represented in Figure
6(a), where one can observe that different tem-
poral segments of samples correspond to differ-
ent clusters or combinations of clusters. However,
(a) Original data set. (b) Denoised data set.
Figure 6: Subject 6 - Partitions obtained for the original and
denoised data sets. The x-axis represents the temporally
ordered ECG samples and the y-axis the clusters to which
they are assigned.
it is not possible to draw conclusions about the
number of these states or how many samples cor-
respond to each of them. Figure 6(b) represents
the partition obtained after denoising of the origi-
nal data set by employing the proposed denoising
GA. This partition consists of two separated clus-
ters and we can conclude that at least two different
emotional states are present in the data: an initial
state comprised of the first 35 ECG samples and a
final state comprised of the final 50 ECG samples.
Samples that are assigned to clusters that do not
correspond to their temporal segment are said to
be outliers. The partial fitness function, F
2
, takes
the number of these outliers, n
outliers
, and sub-
tracts it from the total number of analyzed sam-
ples, n
samples
. Given that each individual has m
associated partitions, then:
F
2
=
1
m
∑
m
n
samples
− n
outliers
n
samples
(3)
The final fitness value, F
total
, for each individual is
F
total
= αF
1
+ (1− α)F
2
(4)
Selection. Two individuals are selected for recombi-
nation based on the fitness values associated, by ap-
plying deterministic tournament selection.
Recombination. This operation consists on the re-
combination of the minimum and maximum limits of
the selected individuals, in order to generate a new in-
dividual; the new minimum and maximum limit val-
ues are chosen randomly as intermediate values of the
selected individuals’ minimum and maximum limits,
respectively.
Mutation. This operation consists on modifying the
minimum and maximum limits by adding or subtract-
ing a randomly chosen number, n
mut
, to or from the
limits values. Addition and subtraction have the same
probability of occurrence.
Termination Criteria. The GA terminates either if
the fitness of an individual reaches a certain thresh-
old, or if a maximum value of G is reached, whatever
GENETIC ALGORITHM FOR CLUSTERING TEMPORAL DATA - Application to the Detection of Stress from ECG
Signals
139
happens first. In either case, the solution is given by
the individual with the highest fitness at termination.
5 APPLICATION TO ECG
TEMPORAL DATA
5.1 ECG Processing and Feature
Extraction
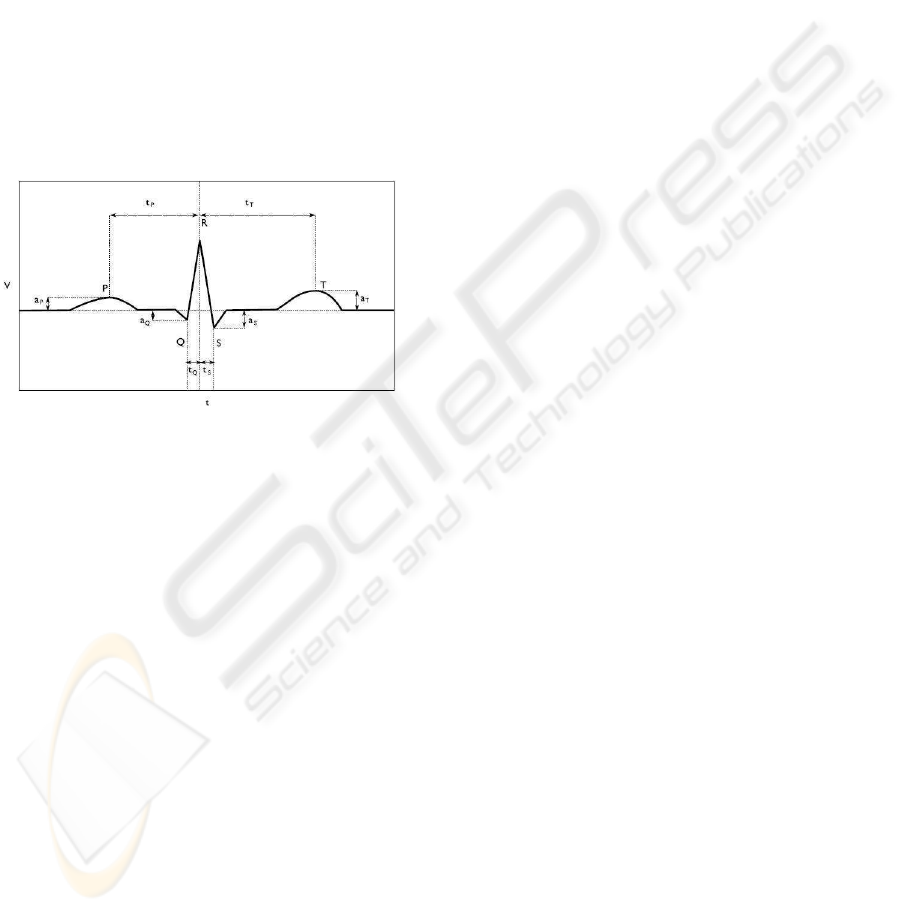
An ECG signal is a recording of the electrical activity
of the heart that consists of sequences of heart beats.
Each heart beat has a typical morphology which con-
sists of five waves (P, Q, R, S, T), schematically rep-
resented in Figure 7.
Figure 7: PQRST wave.
From the acquired time series corresponding to
the ECG signal, signal processing techniques were
applied for signal segmentation (Gamboa, 2008) and
a mean wave form was calculated based on 10 consec-
utive heart beats, to remove some spurious noise. All
the waves were aligned with respect to the R wave.
The recorded signal for each subject is then summa-
rized in a temporal sequence of 137 mean waves, each
wave represented by a feature vector (Gamboa, 2008).
The representation of the ECG signals is based
on the P, Q, S, T waves. The R wave is used for
time alignment, setting the initial instant of the beat
(t
(
R) = 0). The following rules are used to locate the
position of each of the P, Q, S, T waves and to extract
the eight main features of each mean wave (Gamboa,
2008), as depicted in Figure 7:
1. t
P
- the first maximum before the R wave;
2. a
P
- the amplitude of the P wave;
3. t
Q
- the first minimum before the R wave;
4. a
Q
- the amplitude of the Q wave;
5. t
S
- the first minimum after the R wave;
6. a
S
- the amplitude of the S wave;
7. t
T
- the first maximum after the R wave;
8. a
T
- the amplitude of the T wave.
Each mean wave is represented by a 53-
dimensional feature vector: the aforementioned 8 fea-
tures, plus the amplitudes of the signal at 45 points of
the signal obtained by re-sampling of the mean wave
(Gamboa,2008). Thus, for each of the 24 subjects,
there is a group of 137 temporally sequenced samples
or patterns, corresponding each sample to a vector of
53 features.
5.2 Algorithmic Parameters and
Experiments
Two spectral clustering algorithms are used to pro-
duce two clustering ensembles for each of the 24 data
sets. These algorithms were originally proposed by
(Ng et al, 2002) and (Shi and Malik, 2000). Each par-
tition of the clusteringensembleis generated such that
it corresponds to a combination of possible values of
the spectral algorithm’s parameters. These parame-
ters consist in the number of clusters of the partition,
k, and a scaling parameter, s. The ranges of values
used for partition generation are as follows: each par-
tition corresponds to a combination of k ∈ [2, 6] and
s ∈ [0.3, 0.4, ..., 2.9, 3.0]. The co-association matrix
generated for each data set by EAC corresponds to
the accumulation of information from the two cluster-
ing ensembles, which correspondsto 280 partitions of
the data, being that the five hierarchical methods ref-
erenced in Section 3.1 are used for combinedpartition
extraction.
The results of two experiments concerning the
ECG data sets are described and compared in this pa-
per: (1) state detection in the partitions obtained for
the original data sets and (2) state detection in the par-
titions obtained for the denoised data sets by the pro-
posed GA.
The parameter values chosen for implementation
of the denoising GA are the following:
- Number of individuals: M = 20;
- Number of partitions associated to each individ-
ual: m = 5;
- Number of populations generated (termination
criterion): G = 20;
- Threshold of fitness value (termination crite-
rion): 0.95;
- Probability of recombination: p
R
= 0.9;
- Probability of mutation: p
M
= 0.1;
- Range of mutation values: n
mut
∈ [0, 5];
- Weight of partial fitness value: α = 0.1;
ICAART 2010 - 2nd International Conference on Agents and Artificial Intelligence
140
5.3 Results and Discussion
Figure 8 represents co-association matrices obtained
for the original data set and for the denoised data set
of subjects 1, 13 and 21, which show different levels
of separability of the evolution into stress states. By
20 40 60 80 100 120
20
40
60
80
100
120
(a) Subject 1 - Original data
set.
10 20 30 40 50 60 70
10
20
30
40
50
60
70
(b) Subject 1 - Denoised
data set.
20 40 60 80 100 120
20
40
60
80
100
120
(c) Subject 13 - Original
data set.
10 20 30 40 50 60 70 80
10
20
30
40
50
60
70
80
(d) Subject 13 - Denoised
data set.
20 40 60 80 100 120
20
40
60
80
100
120
(e) Subject 21 - Original
data set.
10 20 30 40 50 60 70 80
10
20
30
40
50
60
70
80
(f) Subject 21 - Denoised
data set.
Figure 8: Subjects 1, 13 and 21 - Co-association matrices.
comparing the representations of both co-association
matrices for the same subject, it is possible to observe
that denoising of the original data sets, such that the
eliminated subsets of samples correspond to zones of
transition of the temporal evolution, will lead to the
revelation of the structure of states in the temporal
ECG series. Similarity relationships between con-
tiguous samples are thus emphasized, which means
that the clusters are separated such that a structure of
two differentiated states emerges, with no ambiguities
in the observation and detection of these states.
This better separability of emotional states by the
proposed GA-based method is further evaluated by
observing the temporal evolution of clustering results
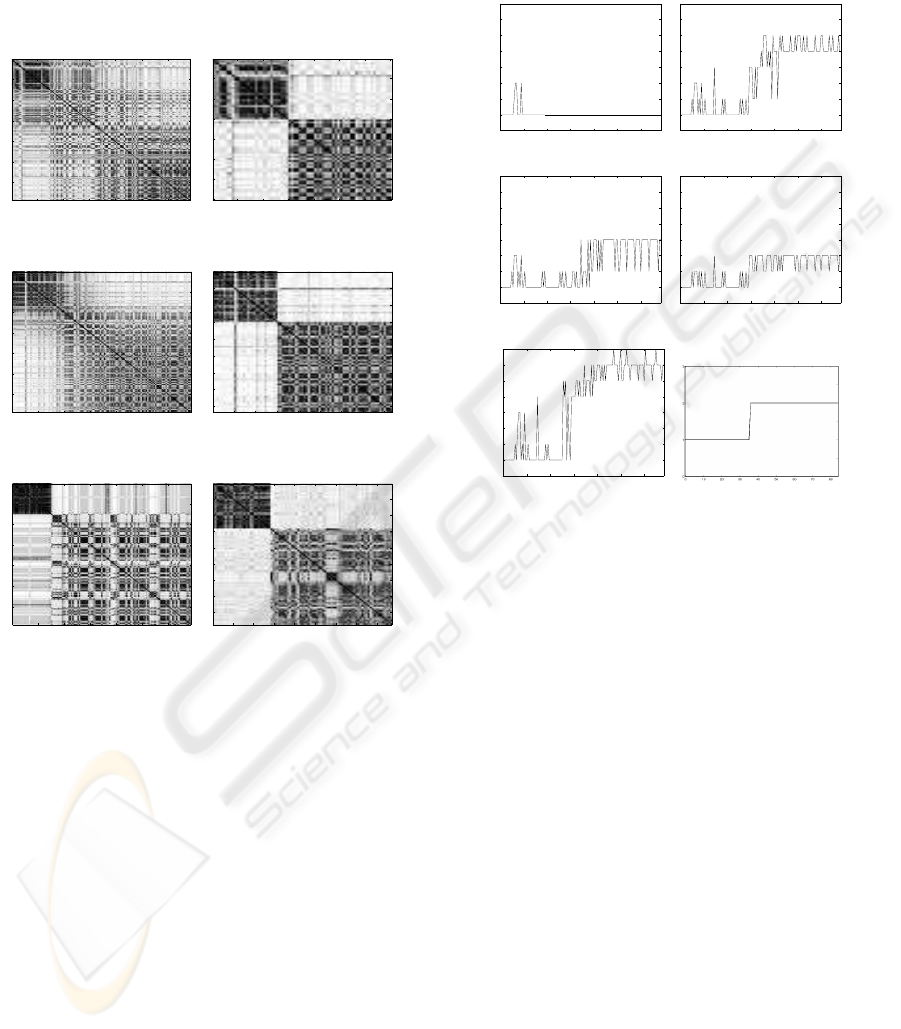
produced from the learned similarities. Figures 9(a)-
9(f) illustrate the temporal evolution of clusters ob-
tained for the original data set of subject 6, while Fig-
ure 9(e) pertains to the corresponding denoised data
set. Each partition corresponds to one of the five hier-
archical methods used for combined partition extrac-
tion.
0 20 40 60 80 100 120
0
1
2
3
4
5
6
7
8
(a) SL.
0 20 40 60 80 100 120
0
1
2
3
4
5
6
7
8
(b) CL.
0 20 40 60 80 100 120
0
1
2
3
4
5
6
7
8
(c) AL.
0 20 40 60 80 100 120
0
1
2
3
4
5
6
7
8
(d) WL.
0 20 40 60 80 100 120
0
1
2
3
4
5
6
7
8
(e) CenL. (f) After denoising.
Figure 9: Subject 6 - Figures (a) to (e): Original data set
partitions. Figure (f): Denoised data set partition (the same
partition was extracted by the five hierarchical methods).
The x-axis represents the temporally ordered ECG samples
and the y-axis the clusters to which they are assigned.
By inspection of Figure 9, it is possible to observe
that the five hierarchical methods extractdifferent par-
titions, in terms of number of clusters and samples as-
signed to each cluster. Though a structure of the data
appears to be present, the transitions between clus-
ters induce ambiguities in the observation of differen-
tiated states. After applying the proposed genetic al-
gorithm to determine which subsets of samples must
be removed in order to eliminate these ambiguities,
it is possible to observe in Figure 9(e) that the five
methods extract the same partition of the data, and
that these partitions reveal two completely separated
clusters each corresponding to a different emotional
state. Thus, these results validate the observations of
the original data set and it is possible to conclude that
emotional states are observable in the ECG temporal
series of subject 6.
It is worth emphasizing that the proposed method-
ology does not impose structure on the data, but rather
enhances the underlying structure. As an illustrative
example, Figure 10 shows the co-association matri-
GENETIC ALGORITHM FOR CLUSTERING TEMPORAL DATA - Application to the Detection of Stress from ECG
Signals
141

20 40 60 80 100 120
20
40
60
80
100
120
(a) Original data set.
5 10 15 20 25 30 35 40 45 50 55
5
10
15
20
25
30
35
40
45
50
55
(b) Denoised data set.
Figure 10: Subject 5 - Co-association matrices.
ces of one subject that exhibits no differentiated states
during the execution of the concentration task. In this
case, no states were detected for the original data set
or the denoised data set.
Overall, by visual inspection of co-association
matrices and clusters evolution associated to the orig-
inal data sets, it is possible to infer the existence of
emotional states with temporal evolution for 12 of the
24 subjects. After applying the proposed genetic al-
gorithm, these states are differentiated and in a few
cases completely separated for 8 of those 12 subjects,
and also for two other subjects for whose temporal se-
ries is not possible to obtain a state structure using just
the original data sets. For these 10 subjects, a maxi-
mum of 59% samples and a minimum of 31% are re-
moved in order to evidentiate the temporal separation
of the clusters.
The fact the number of subjects for whom differ-
entiated states are detected is greater for the original
data sets than for the subsets obtained with denois-
ing is related with the fitness function proposed for
evaluation of each possible subset. The criteria cho-
sen to implement it are strict, given that we want to
evidence completely separated states, using for each
evaluation different partitions obtained by each hier-
archical method. It is possible that one or more of
these methods, for instance Single Link, may be in-
adequate for the analysis of the temporal series, thus
degrading the fitness values
6 CONCLUSIONS
The proposed methodology of analysis is based on
unsupervised learning techniques, namely representa-
tive clustering algorithms and a state of the art cluster-
ing ensemble method, and also on a proposed genetic
algorithm for assessment of the existence of differen-
tiated states in temporal series of signals by denoising
of the data sets, as well as for validation of the re-
sults obtained for the original data sets. Results show
that the use of denoising techniques as a means of
pre-processing the data and validation of the state ob-
servations for the original data sets reinforces the as-
sumption that at least two different states are present
in the data set, each corresponding to a single cluster
or combination of clusters. Thus, it is possible to in-
fer the existence of emotional states in the temporal
series analyzed by employing unsupervised learning
methods and an evolutionary computation technique.
Ongoing work consists on a further extensive vali-
dation of the proposedmethodology in the herein pre-
sented application domain, as well as extrapolation to
the automatic analysis of other time series, such as
EEG data.
ACKNOWLEDGEMENTS
We acknowledge financial support from the FET pro-
gramme within the EU FP7, under the SIMBAD
project (contract 213250).
REFERENCES
Gamboa, H. (2008). Multi-Modal Behavioral Biomet-
rics Based on HCI and Electrophysiology. PhD
Thesis, Instituto Superior T´ecnico, Lisboa, Portugal.
http://www.lx.it.pt/ afred/pub/thesisHugoGamboa.pdf
Jain, A. K., Murty, M. N. and Flynn, P. J. (1999). Data
Clustering: A Review. In ACM Computing Surveys,
Vol.31, Issue 3, pp.264-323.
Fred, A. and Jain, A. K. (2005). Combining Multiple Clus-
terings Using Evidence Accumulation. In IEEE Trans.
on Pattern Analysis and Machine Intelligence, Vol.27,
Issue 6.
Xu, R. and Wunsch II, D. (2005). Survey of Clustering
Algorithms. In IEEE Trans. on Neural Networks, Vol.
16, Issue 3, pp.645-678.
Ng, A. Y., Jordan, M. I. and Weiss, Y. (2002). On Spectral
Clustering: Analysis and an Algorithm. In Advances
in Neural Information Processing Systems, volume
14, pp 849-856.
Shi, J. and Malik, J. (2000). Normalized Cuts and Image
Segmentation. In IEEE Trans. on Pattern Analysis and
Machine Intelligence, Vol. 22, Issue 8.
Lourenc¸o, A. and Fred, A. (2008). Unveiling Intrinsic Sim-
ilarity: Application to Temporal Analysis of ECG. In
Proc. of BIOSIGNALS 2008, pp. 104-109.
Sumathi, S., Hamsapriya, T. and Surekha, P. (2008). Evo-
lutionary Intelligence: An Introduction to Theory and
Applications with Matlab,Springer.
ICAART 2010 - 2nd International Conference on Agents and Artificial Intelligence
142
