
VISUALIZATION OF DOCUMENT CLUSTERS
An Interactive Visual Tool to Browse Textual Documents
Faryel Allouti, Mohamed Nadif
LIPADE, UFR MI, Paris Descartes University, 45, rue des Saints Pres, 75270, Paris, France
Benoˆıt Otjacques
Public Research Center - Gabriel Lippmann, Informatics, Systems and Collaboration Department
41, Rue du Brill, L-4422 Belvaux, Luxembourg
Keywords:
Information visualization, Clustering, Documents.
Abstract:
Handling collections of text documents has become a daily task for many professionals whatever their eco-
nomic sector or position in the organization. In many cases, little metadata is added to the documents, which
makes it difficult to automatically derive a semantic structure within the collection. This paper describes a new
tool that combines the clustering and the visualization paradigms to help a user identify similar documents in
an unstructured collection. Several clustering algorithms can be used to identify clusters of documents that
are subsequently displayed on a plane. In this work, we use the Classification EM algorithm. The original-
ity of our approach is to allow the user to refine the clustering process interactively by means of a visual
analysis of the results of the intermediate steps. In addition, the tool also shows some enriched views of the
content of documents and allows the user to include a semantic analysis based on personal knowledge to the
computer-based clustering process.
1 INTRODUCTION
Considering the exponentially increasing amount of
digital data, the automatic processing of collections
of documents has become a major issue in both the
academic and the business contexts. This trend can
be illustrated by several examples. The massive in-
dexation of pages underpinning the amazing success
of Google is perhaps the most famous one in the last
few years.
At the individual level, many of us regularly spend
time searching for a specific document in our file sys-
tems. We regularly browse our storage disks to find
out the numerous versions of a report and identify
the right one. As few of us rigorously build and
maintain semantically relevant and cross-referenced
storage structures (allowing mapping among differ-
ent systems), search operations usually take too much
time. In many cases, other tools (e.g. e-mail) are
diverted to become secondary file systems that also
need to be explored. Unfortunately all these systems
do not share common access points to the data (e.g.
indexes, key words). This issue known as the Frag-
mentation Problem (cf. Gonalves and Jorge (2008))
raises additional challenges regarding document re-
trieval.
Thus, full text search (potentially in several dis-
tinct systems) is often the only available solution to
find out the needed file(s). Unfortunately, finding the
most differential words to identify the searched file(s)
may be challenging. If several versions of the same
file are present in the collection this process may be-
come even more difficult. In some cases, the files are
tagged with metadata and the search process can rely
on this complementary information. Unfortunately
again, metadata are often not sufficient to describe the
content of a document and summarizing a text with a
couple of relevant words is not that easy. Moreover
many documents do not have any semantic metadata
at all. In addition Blanc-Brude and Scapin (2007)
have pointed out that users only partially recall the
keywords describing their own documents.
This paper focuses on this type of problem: find-
ing similar documents in a set and subsequently an-
alyzing in details the elements of this subset to iden-
tify a specific item. We propose to investigate this
issue with a mixed approach based on the respec-
tive strengths and weaknesses of humans and com-
157
Allouti F., Nadif M. and Otjacques B. (2010).
VISUALIZATION OF DOCUMENT CLUSTERS - An Interactive Visual Tool to Browse Textual Documents.
In Proceedings of the International Conference on Imaging Theory and Applications and International Conference on Information Visualization Theory
and Applications, pages 157-160
DOI: 10.5220/0002838501570160
Copyright
c
SciTePress
puters. Computers are efficient for automated well-
defined tasks but they can not easily tackle the infor-
mal knowledge that users have concerning the whole
context of a document. Symmetrically humans con-
tinuously process pieces of information involving un-
certainty, tacit knowledge and/or informal informa-
tion. On the basis of this observationwe suggest com-
bining some computer-based clustering steps with
complementary steps on the basis of the visual intelli-
gence of humans. The partial results of the computer-
based clustering is refined by the user in an iterative
loop. Designing and experimenting such a powerful
tool is our global purpose.
2 THE STATE OF THE ART
Various computer-based approaches have been pro-
posed in order to tackle the vast amount of digital
documents that are accessible to a user in a given con-
text. Paulovich and Minghim (2008) have proposed a
technique called HiPP. It is a hierarchical point place-
ment strategy for displaying, interacting, and organiz-
ing large multidimensional data sets. Barreau (1995)
identifies four aspects of Personal Information Man-
agement: acquisition, organization, maintenance and
retrieval. Our study focuses on the retrieval phase.
Indeed, Blanc-Brude and Scapin (2007) have recently
highlighted the need for new tools to retrieve personal
documents. They explain that the presentation of the
item’s category is likely to increase the recall of that
item and that it would be interesting to find a method-
ology that would elicit a greater proportion of sponta-
neous recall. We especially study how to group sim-
ilar documents into classes and to find one or many
specific items within these classes.
Gonalves and Jorge (2008) propose to retrieveper-
sonal information not only on the basis of arbitrary
classifications in hierarchies but to report to a wider
range of contextual data. We follow these recommen-
dations by including successive classification and vi-
sualization steps together with full text search feature.
3 OUR APPROACH
Our initial purpose is to develop a tool that organizes
documents into classes, then to visualize these classes
in order to assist user in analysing and finding files
or informations in files. We limit our research to the
textual content of files excluding other elements (e.g.
pictures). However, we acknowledge the need to in-
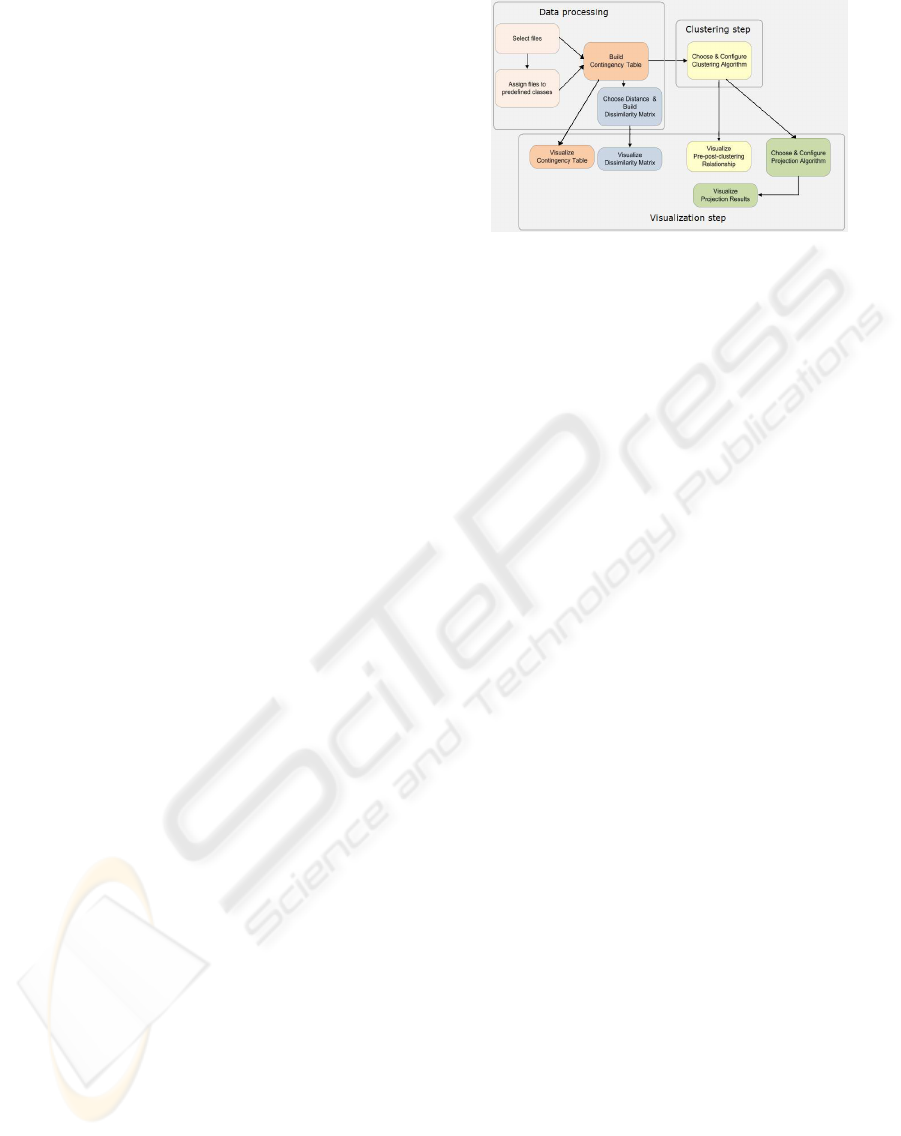
Figure 1: Global strategy.
clude other types of content in the future. We elab-
orated a global strategy that consists in three main
parts: data processing, clustering and visualization
of the results with a projection algorithm. At each
step, we offer to the user some appropriate views de-
pending on the ongoing tasks: visual representation
of the structuration of the dataset (i.e. contingency ta-
ble, dissimilarity matrix), results of the clustering step
or results of the projection algorithm (see Figure 1).
3.1 Data Processing
In this step we handle the selection of documents.
We assume that the documents belong to predefined
classes. A pre-processing is necessary to obtain data
structured in the form of a contingency table: (files ×
words) where each cell corresponds to the frequency
of a word in a file.
The data can also be presented in the form of a
dissimilarity matrix (files × files), where the value of
each Cij cell corresponds to the distance between file
i and file j. In our research work, the dissimilarity ma-
trix is computed using the chisquare distance. This
distance is justified for several reasons, in particular
because of the property of distributional equivalence,
which implies stable results when agglomerating ele-
ments with similar profiles.
3.2 Clustering Step
As previously mentioned, we focus on textual data.
We have adopted a mixture model framework. In
this context, we propose to use the multinomial mix-
ture models (Govaert and Nadif, (2007)) to cluster
the set of files. Setting this model in the classifica-
tion maximum likelihood (CML), the authors showed
that this model, when the proportions of the clusters
are assumed equal, is approximately associated to the
within-cluster criterion using the chisquare distance.
Therefore, we use the same distance in the cluster-
ing step and in the visual projection. In the general
IVAPP 2010 - International Conference on Information Visualization Theory and Applications
158

context, the criterion optimized is the complete data
log-likelihood.
3.3 Visualization
The visualization of obtained clusters is performed by
the MultiDimensional Scaling (MDS) using the Dif-
ference of Convex functions Algorithm (DCA) to op-
timize the classical stress criterion of MDS (Le Thi
and Pham, (2001)). In the following, we call this al-
gorithm MDSDCA.
MDSDCA is an iterative algorithm, to avoid a
random initialization we proposed in (Allouti et Al.,
(2009)) an initialization approach based on the parti-
tion obtained by the CEM algorithm, the dissimilarity
matrix and bearing. The proposed initialization ap-
proach avoids performing a large number of unneces-
sary iterations.
MDSDCA determines the coordinates of the dif-
ferent documents on a plane. Based on these coordi-
nates, we propose two graphical presentations. The
first one consists in positioning the different docu-
ments on a plane using the cartesian coordinates. The
second one consists in positioning documents on a
plan using polar coordinates.
4 VISUALIZATION TOOL
We emphasize that our tool provides two graphical
interfaces. The first is intended for a user. In this
case the user does not know the classes. The sec-
ond graphical interface is intended for an expert (the
researcher). In this case, the researcher has an idea
about classes and he wants to analyze and look closely
at these classes. We illustrate on Figure 2 the sec-
ond interface. This interface is composed of 6 parts.
The first part allows the user to choose the clustering
algorithm. Regarding the polar coordinates, the sec-
ond part allows to position the documents in a circle,
half circle or quarter circle. Part-3 allows to visualize
the contingency table and the dissimilarity matrix. It
allows also to search documents containing a word,
and it allows to cluster and to project a selected sub-
set. Part-4 illustrates the results of the projection algo-
rithm. Part-5 allows to position documents around a
selected document (on the part-4) respecting the dis-
tances between the selected document and the other
documents. On part-6, we display the contents of the
selected document.
We illustrate our tool on a sample of Classic3
(ftp://ftp.cs.cornell.edu/pub/smart/). Classic3 is a
database composed of 3893 documents obtained by
Figure 2: Interface for an expert.
combining the summaries of CISI, CRANFIELD and
MEDLINE.
4.1 Visualization of the Structure of
Data
The visualization of the structure of data allows to
give an overview of the data. Thus, regarding the
contingency table, the expert can visualize the words
shared by documents, one can also determine if the set
of documents share many words. One may also have
an idea about the frequency of words in each docu-
ment based on the nuance of color. The darker the
color the higher the frequency. Visualization of the
dissimilarity matrix allows to determine files that are
close to each other in term of the chisquare distance.
4.2 Visualization of the Result of the
Projection Algorithm
Our tool gives an overview of the data, filters and de-
tails on demand. That is to say that first we display the
results of the projection algorithm (part-4) and if the
expert wants details on a file, he can select a file and
view its content (part-6). He can also visualize the po-
sitioning of other files from the selected file (part-5).
In this case, he may choose to view either all files or
files arised from its Out class or files arised from its
In class.
We have also added visual cues in the text view in
order to help the user identify the most relevant words
in the document as well as in the whole class. For
example, we used brown to illustrate the stopwords.
Green illustrates the words shared by the selected file
and files belonging to its Out class. Black illustrates
words belonging only to the selected file.
We add to our tool possibility to visualize dynam-
ically the result of the projection algorithm. The dy-
namic visualization allows user to select a file and
VISUALIZATION OF DOCUMENT CLUSTERS - An Interactive Visual Tool to Browse Textual Documents
159
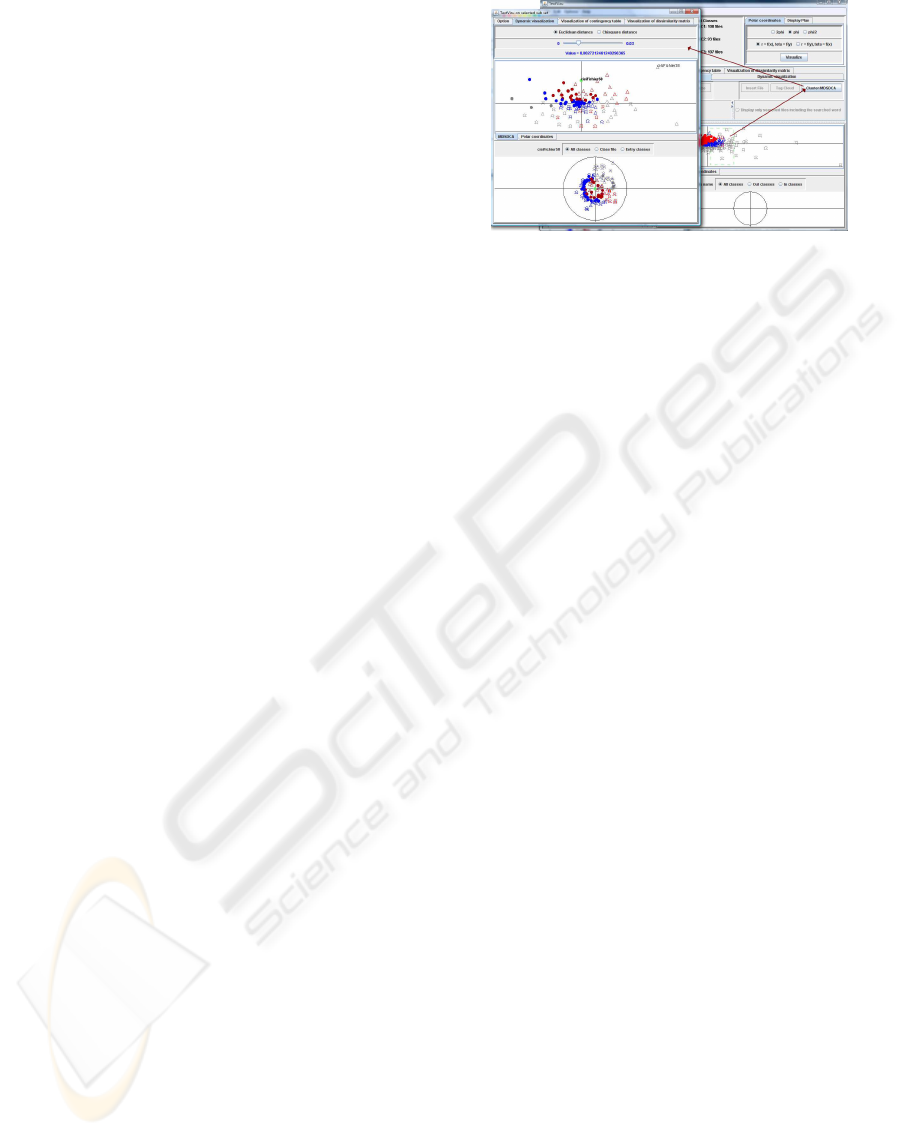
view in real-time files that are closest in terms of ei-
ther euclidian distance or chisquare distance. Thus,
the user can analyze these files in more detail (see
Figure 3).
One can also select a subset to be clustred and
to be projected. It is also possible to select another
subset from the previous one. Thus, the result of the
computer-based clustering is refined by the user in an
iterative loop (see Figure 3).
4.3 Visualization of the
Pre-post-clustering Relationship
Visualization of the pre-post-clustering allows to
show four cases: files that were in the same In classes
and are in the same Out classes, files that were not
in the same In classes and are not in the same Out
classes, files that were in the same In classes but are
not in the same Out classes, files that were not in the
same In classes and are in the same Out classes.
Specifically, this part allows to visualize files
wrongly classified.
4.4 Information Retrieval
Concerning information retreival, our tool allows to
search documents by specifying a word. To illustrate
the result of the research process, we associated color
to the files containing the specified word. We indicate
to the user the number of files containing the specified
word (see Figure 2). The user can visualize only the
files containing the specified word and thus analyse
in more detail these files. By clicking on one of these
files, one can, for example, visualize the occurrence
of the specified word in the selected file.
5 CONCLUSIONS
In this paper we presented an interactive tool that
combines the clustering and visualization methods for
textual data. The tool allows to identify similar doc-
uments into an unstructured collection. Specifically,
we used the multinomial mixture model to cluster
the documents, and MDSDCA for visualization. The
originality of our approach is to allow the user to in-
teractively refine the clustering process based on vi-
sual analysis of the results of the intermediate steps.
In addition, our tool also offers visual cues in the text
view in order to help the user identify the most rele-
vant words in the document as well as in the whole
class. Tool also shows some enriched views of the
content of documents by allowing the user to include
Figure 3: Clustering and projection of a subset of docu-
ments.
a semantic analysis based on personal knowledge to
the computer-based clustering process.
We will illustrate our tool on other real data.
ACKNOWLEDGEMENTS
The research work reported in this paper has been
supported by a grant of the National Research Fund
(FNR) of Luxembourg. For this, we thank the FNR.
REFERENCES
Allouti, F., Nadif, M., Le Thi, H. A., Otjacques, B., 2009.
Mixture model and MDSDCA for textual data. In
Proceedings of the 6th International Conference on
Cooperative Design, Visualization and Engineering
(CDVE 2009), 20-23 September 2009, Luxembourg,
published in Cooperative Design, Visualization, and
Engineering, Lecture Notes in Computer Science, vol.
5738, Springer, Berlin, Allemagne, pp. 240-244.
Blanc-Brude, T., Scapin, D., 2007. What do People Recall
about their Documents ? Implications for Desktop
Search Tools. In IUI’07, 2007 International Confer-
ence on Intelligent User Interfaces, ACM Press.
Barreau, D., 1995. Context as a factor in personal informa-
tion management systems. In Journal of the American
Society for Information Science, 46(5), 327-339.
Gonc¸alves, D., Jorge, J. A., 2008. In Search of Personal
Information: Narrative-Based Interfaces. In Proceed-
ings of the 13th international Conference on intelli-
gent User interfaces (Gran Canaria, Spain, January
13-16, 2008). IUI’08. ACM, New York, NY, 179-188.
Govaert, G., Nadif, M., 2007. Clustering of contingency ta-
ble and mixture model. European Journal of Opera-
tional Research. 36, 1055-1066.
Le Thi, H. A., Pham Dinh, T., 2001. D.C. Programming
Approach for Solving the Multidimensional Scaling
Problem. Nonconvex Optimizations and Its Applica-
tions, Kluwer Academic Publishers. 231-276.
Paulovich, F. V., Minghim, R., 2008. HiPP: A novel hier-
archical point placement straegy and its application to
the exploration of document collections. IEEE Trans-
actions on Visualization and Computer Graphics 14,
6 (2008), 1229-1236.
IVAPP 2010 - International Conference on Information Visualization Theory and Applications
160
