
AUTOMATIC ORGAN DELINEATION OF COMPUTED
TOMOGRAPHY IMAGES FOR RADIOTHERAPY PLANNING
IN PROSTATE CANCER
An Overview
Celeste Marques Oliveira
1,2,3
and Pedro Pereira Rodrigues
1,4
1
Faculty of Medicine of the University of Porto, Al. Prof. Hernâni Monteiro, 4200-319, Porto, Portugal
2
Faculty of Sciences of the University of Porto, Rua do Campo Alegre, s/n, 4169-007, Porto, Portugal
3
Department of Radiotherapy, Portuguese Institute of Oncology Francisco Gentil
Rua Dr. António Bernardino de Almeida, 4200-072, Porto, Portugal
4
LIAAD - INESC Porto, L.A. & CINTESIS - Center for Research in Health Technologies and Information Systems
University of Porto, Porto, Portugal
Keywords: Radiotherapy planning, Prostatic neoplasms, Computer-assisted methods, Tomography X-ray computed,
Image processing.
Abstract: Prostate cancer is a common cancer worldwide and a leading cause of death. Radiotherapy is usually the
first-line treatment for patients with slow-growing cancer that is confined to the prostate. In Radiation
Therapy Planning (RTP), the recognition and outlining of clinical volumes in computed tomography (CT)
images are one of the most time-consuming steps carried out by human experts. The aim of this review is to
identify and summarize evidence of the use of automatic organ delineation of CT images for radiotherapy
planning in prostate cancer. From the literature search, a total of seven studies, reported between 1994 and
2009, were selected. We associate the selected studies in order to compare results, in spite of their
differences in methodology and outcome evaluators. Most of the studies conclude that the automatic
approach is faster, while having equivalent accuracy to manual method. Concerning the observer’s
variability, automatic segmentation reaches significant gains in reproducibility. As future directions, it is
recommended the improvement of the segmentation algorithms in the delineation of problematic soft tissues
and future validation studies with large scale trials and possible studies of meta-analysis in the specific
problems.
1 INTRODUCTION
Prostate cancer is a common cancer worldwide and a
leading cause of death. According World Health
Organization is accounting for about 250,000 new
cases annually. Radiotherapy is usually the first-line
treatment for patients with slow-growing cancer that
is confined to the prostate. It represents a curative
treatment option in these patients (Boehmer, D. et
al., 2006) and the three-dimensional (3D) conformal
radiotherapy is being increasingly applied since it
may result in improved targeting of the prostate and
significant sparing of normal tissues.
In the Radiation Therapy Planning (RTP), the
recognition and outlining of clinical target volume
and adjacent organs at risk, in Computed
Tomography (CT) images, are one of the most time-
consuming steps carried out routinely by human
experts (Huyskens, D.P. et al., 2009, Haas, B. et al.,
2008). It is only by displaying these that the
dosimeters can devise an optimal plan to the
prescribed dose while minimizing radiation of
adjacent non-target tissues thereby maximizing the
therapeutic gain of treatment (Neal, A.J. et al.,
1994). Usually, they outline the boundaries of the
structure by a process of continuous contour drawing
on most (or all) slices of CT image set using a
computerized Treatment Planning System (TPS).
This is a laborious and subjective task ultimately
dependent on the clinician´s expert eye, which is
also prone to inconsistency and variability (Mcbain,
C.A. et al., 2008, Pekar, V. et al., 2004).
482
Marques Oliveira C. and Pereira Rodrigues P..
AUTOMATIC ORGAN DELINEATION OF COMPUTED TOMOGRAPHY IMAGES FOR RADIOTHERAPY PLANNING IN PROSTATE CANCER - An
Overview.
DOI: 10.5220/0003127904820485
In Proceedings of the International Conference on Health Informatics (HEALTHINF-2011), pages 482-485
ISBN: 978-989-8425-34-8
Copyright
c
2011 SCITEPRESS (Science and Technology Publications, Lda.)
TPS for irradiation of malignant neoplasm
requires CT images due to the similar physical
behavior of the radiation used for imaging and for
treatment. These images are limited of contrast for
the structures of interest, ruling out many
approaches to segmentation for this application
(Quicken, M., 2000). The emergence of imaging and
adaptive radiotherapy is producing amounts of
image data whose manual delineation slice by slice
has become infeasible (Boehmer, D. et al., 2006).
The need of efficient and robust segmentation tools
is even increasing (Li, T. et al., 2006). Segmentation
is an image processing term literally implying the
breaking down of an image into smaller parts. In the
context of RTP this comprises the contouring of
important volumes. At the present there is no
universally accepted segmentation method that is
proven to work on a large representative image
database (Bueno, G. et al., 2001).
Despite all the advances in imaging for RTP,
some anatomical regions remain indistinct and it is
very difficult to delineate. This is usually because of
an inability to differentiate the region of interest,
from the adjacent structures of similar grey-scale
signal density, for e.g. the base of the prostate gland
at its interface with the base of the bladder (Mcbain,
C.A. et al., 2008). Bladder, rectum and femoral
heads should be delineated in the TPS to achieve a
protection against high dosage of radiation trough a
selection of the optimal beam orientations by
visualizing 3D reconstruction (Mazonakis, M. et al.,
2001).
For a better understanding of the automatic
segmentation used in TPS see the authors
(Freedman, D. et al., 2005, Quicken, M., 2000).
The aim of this article is to review, to identify
and summarize evidence from scientific studies to
obtain an overview about the use of automatic organ
delineation of CT images for RTP in prostate cancer.
2 METHODOLOGY
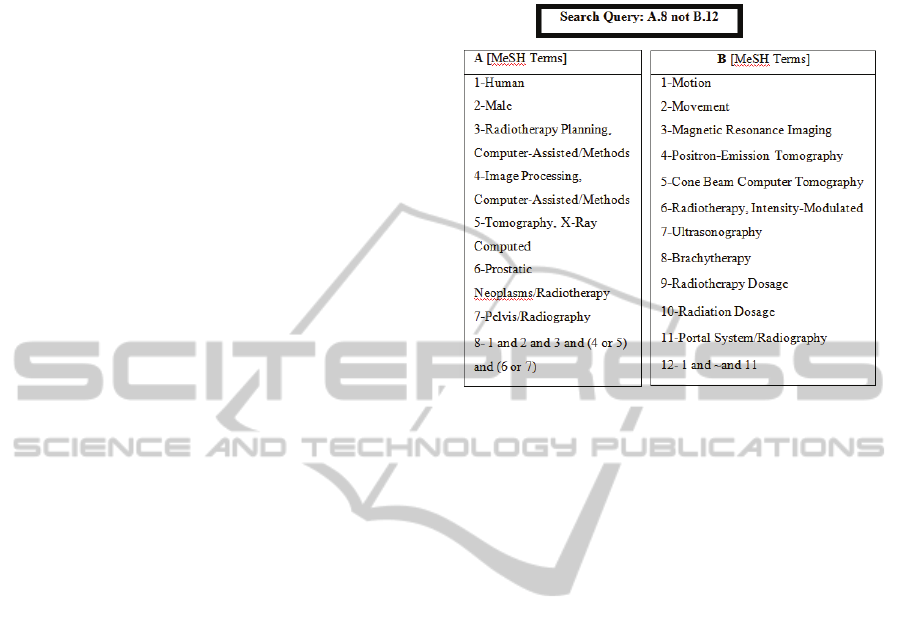
The comprehensive literature search of this review
was performed by using PubMed®. The final search
was executed on December 31, 2009 using the query
presented in Figure 1. The selection over the data
collection was performed by one reviewer that
examined the related articles.
This strategy was based on these following steps:
apply the query (n=25), exclude the articles
inadequate by reading the title and the abstract
(n=21); review the chosen articles (n=4), add some
relevant articles from related articles (n=2), and add
some article adequate from the review references of
the previous articles (n=1).
Figure 1: MeSH terms and search query used in the
methodology.
The inclusion criteria required that studies had a
clinical evaluation of the automatic (semi-automatic)
organ delineation and had used CT-based
radiotherapy planning for prostate cancer patients.
The exclusion criteria eliminate studies that had a
clinical evaluation of the automatic organ
delineation based only in Magnetic Resonance (MR)
image, or ultrasound-guided brachytherapy, or
multimodality images (combination of CT, positron
emission tomography or MR). Articles that
presented automatic localization of the prostate for
image-guided radiotherapy on cone-beam CT scans
or on megavoltage computed tomography images
were not considered in this review.
3 FINDINGS
A total of seven studies were selected from the
scientific literature. The studies were reported
between 1994 and 2009. Three of them were
published by British Journal of Radiology. Some of
these studies were a result of a work between
radiotherapy departments from different institutions
or countries.
All of the studies are clinical validations that
compare automatic segmentation with manual
tracing of pelvic organs. Most of them, had
presented quantitative and qualitative evaluations,
and nearly all studies had as object of study the
quality assessment of the automatic segmentation in
AUTOMATIC ORGAN DELINEATION OF COMPUTED TOMOGRAPHY IMAGES FOR RADIOTHERAPY
PLANNING IN PROSTATE CANCER - An Overview
483

terms of expert inter/intra variability. In the selected
articles, it was identified the technique or algorithm
or the software used in the automatic segmentation.
To this evaluation, the observers that participated in
the studies were clinical experts like Radiation
Oncologist (n=5), Dosimeter (n=1), Physicist (n=4),
Radiographer (n=1) and Oncologist (n=1). In the
studies, the segmented pelvic organs were: the
prostate (n=5), the seminal vesicles (n=3), the
bladder (n=6), the rectum (n=7) and the femoral
heads (n=4). Five studies used the same patients for
both methods of segmentation (automatic and
manual).
The table 1 shows a systematization of the
outcomes resulting from the selected studies with
different evaluators and respective metrics.
4 DISCUSSION
This review attempts to associate several studies in
order to compare the outcomes, despite the
differences in their methodologies, concerning
segmentation techniques and statistical methods. In
the segmentation approach, the studies evaluated the
following techniques: region growing, deformable,
morphological, automatic segmentation software and
auto-segmentation algorithm. Regarding the
samples, the studies differ in: CT data (number of
sets and slices, slice thickness, image resolution)
conditions of CT acquisition (administration of
contrast, bowel gas, bladder filling), organs
segmented, user’s interaction, etc. The outcomes
were measured trough different evaluators:
efficiency (given by the respective segmentation
times with mean volume/area and standard
deviations of the organs segmented or distance
Table 1: Systematization of most outcomes, presenting metrics used to evaluate the manual tracing and the automatic
segmentation (volume and time mean, overlapping ratio, Hausdorff distance) and metrics to compare directly the both
segmentation methods (percentage of relative error, percentage of agreement, band area difference in terms of average
maximum, median difference of volume and time, deviation mean, and overall rating in terms of percentage or levels).
V- Volume mean/ T- Time mean/ O- Overlapping ratio/ HD- Hausdorff Distance/ RE- Relative Error/ AG- Agreement/ BD- Band area
Difference (average maximum)/ VD- median Volume Difference/ TD- median Time Difference/D-Deviation mean / E- excellent/ G- Good/
A- Acceptable/ NA- Not Acceptable
Study
Manual tracing Automatic Segmentation Comparative Evaluators
V
cm3
T
s
O
HD
mm
V
cm3
T
s
O
HD
mm
RE
%
AG
%
BD
cm2
VD
cm3
TD
s
D
mm
Overall Rating ( %)
E G A NA
Huyskens
Prostate 60 53 33 75 9 45 30 15
Bladder 250 242 9 91 36 42 12 9
Rectum
Femoral
90
122
56
76
3
12
24
27
27
6
45
54
Hass
53
Prostate 0.81
Bladder 1.02
Rectum 2.64
Femoral 2.58
McBain
Prostate 61 480 54 120 3.1 360
Vesicles 23 120 17 120 6 0
Bladder 174 720 171 300 7.7 420
Rectum 69 480 54 120 5.6 360
Pekar
Bladder 1.5
Rectum 1.6
Right femur 0.9
Bueno
Vesicles 9.1 1.1 0.9 1.5 72
Bladder 0.9 1.5 0.9 1.2 92
Rectum 1.0 0.8 0.7 1.7 90
Mazonakis
738 504
Prostate 46 47
Bladder 305 302
Rectum 118 110
Neal
Prostate 194 219
Vesicles 108 123
Bladder 242 198
Rectum
Femur
197
1136
162
204
HEALTHINF 2011 - International Conference on Health Informatics
484

measurement between the two methods),
reproducibility (intra/inter variability given by the
coefficient of variation values or relative percentage
of agreement among the experts), accuracy (mean
segmentation error), sensitivity (True Positive Rate),
and specificity (True Negative Rate).
The most part of the studies, conclude that
automatic segmentation closely reproduce manual
contours with no significant volume difference and
with a significant time difference. The automatic
approach is faster with equivalent accuracy to
manual method. In concern with the observer’s
variability, automatic segmentation reaches
significant gains in reproducibility. This may be
attributed to the reduced user interaction required for
efficient segmentation of the organs.
In general, the studies used small samples,
except the Hass et al, and one of the studies, Neal et
al, contrary of the general outcomes, concluded that
the time taken to segment automatically the prostate
was superior compared with the manual tracing.
This fact could be explained due to the algorithm
limitations in the soft tissue segmentation.
In the automatic segmentation, the limitations
found in the studies were: underestimation of
prostate, distinguish the base of bladder from
prostate, segment the real boundary of rectum and
separation of the rectum from seminal vesicles.
All studies have emphasized the potential of the
automatic approach to improve radiotherapy
planning conditions. In contrast to manual slice
delineation, organ segmentation can be done within
a few minutes with no significant mean
segmentation error. However, some problematic
contours of soft tissues have to be corrected
interactively.
In general, many published approaches in image
segmentation are validated on a small set of test
images and few methods in the domain of automated
organ segmentation for RTP have been
quantitatively validated so far.
As future directions, it is recommended the
improvement of the segmentation algorithms in the
delineation of problematic soft tissues and future
validation studies with large scale trials.
Furthermore, a thorough systematic review
aiming at a study of meta-analysis is required to
critically access the differences between automatic
and manual segmentation, especially for prostate
cancer.
REFERENCES
Boehmer, D., Maingon, P., et al. 2006. Guidelines for
primary radiotherapy of patients with prostate cancer.
Radiotherapy and Oncology, 79, 259-269.
Bueno, G., Fisher, M., et al. 2001. Automatic
segmentation of clinical structures for RTP:
Evaluation of a morphological approach. Proceedings
of Medical Image Understanding and Analysis (MIUA
'01), 73-76.
Freedman, D., Radke, R., et al. 2005. Model-based
segmentation of medical imagery by matching
distributions. IEEE Transactions on Medical Imaging,
24, 281-292.
Haas, B., Coradi, T., et al. 2008. Automatic segmentation
of thoracic and pelvic CT images for radiotherapy
planning using implicit anatomic knowledge and
organ-specific segmentation strategies. Journal
Physics in Medicine and Biology, 53, 1751-1771.
Huyskens, D. P., Maingon, P., et al. 2009. A qualitative
and a quantitative analysis of an auto-segmentation
module for prostate cancer. Radiotherapy and
Oncology, 90, 337-345.
Li, T., Xing, L., et al. 2006. Four-dimensional cone-beam
computed tomography using an on-board imager.
Medical Physics, 33, 3825-3833.
Mazonakis, M., Damilakis, J., et al. 2001. Image
segmentation in treatment planning for prostate cancer
using the region growing technique. British Journal of
Radiology, 74, 243-248.
Mcbain, C. A., Moore, C. J., et al. 2008. Early clinical
evaluation of a novel three-dimensional structure
delineation software tool (SCULPTER) for
radiotherapy treatment planning. British Journal of
Radiology, 81, 643-652.
Neal, A. J., Sivewright, G., et al. 1994. Technical note:
Evaluation of a region growing algorithml for
segmenting pelvic computed tomography images
during radiotherapy planning. BJR, 67, 392-395.
Pekar, V., Mcnutt, T., et al. 2004. Automated model-based
organ delineation for radiotherapy planning in
prostatic region. International Journal of Radiation
Oncology Biology Physics, 60, 973-980.
Quicken, M. 2000. Generation and Application of
Statistical Shape Models for the Segmentation of
Abdominal Organs in Radiotherapy Planning. Doctor
of Technical Sciences, Swiss Federal Institute of
Technology.
AUTOMATIC ORGAN DELINEATION OF COMPUTED TOMOGRAPHY IMAGES FOR RADIOTHERAPY
PLANNING IN PROSTATE CANCER - An Overview
485
