
DEVELOPMENT OF AN INTEGRATED RISK ASSESSMENT
PLATFORM FOR THE MANAGEMENT OF CARDIOVASCULAR
DISEASES, DIABETES AND HYPERTENSION
Bhanu Priya, Shruthi Nadig, Saloni Maru, A. Srinivas, Nitish Shangari, Abhishek Biswas
PES Institute of Technology, Bangalore, India
Suresh Krishnamurthy
PES Institute of Medical Sciences and Research, Kuppam, Andhra Pradesh, India
Keywords: Cardio vascular disease (CVD), Hypertension (HTN), Diabetes mellitus (DM), Risk Assessment, Prognosis,
preventive medicine, Interactive risk analysis (IRA).
Abstract: Health care is an important requirement of life. It is defined as the prevention, treatment or management of
health related problems by using diverse strategies and services. Information Technology (IT) has pervaded
every sphere of life including health care. It not only includes information systems in hospitals for managing
clinical information about patients but also includes telemedicine, computer-assisted instructions to patients
as well as doctors, and extends to computer-assisted imaging and surgery. IT has now become a key
component in Disease Management Systems used in the assessment and management of chronic diseases
such as Diabetes and Coronary artery disease. We have developed an Integrated Risk Assessment and
Health Management System [IRAHMS] to assess the risk of developing “life-style” diseases such as Cardio
Vascular Disease, Type 2 Diabetes Mellitus and Hypertension. This includes a patient clinical information
database; a Framingham data based cardiovascular risk calculator and a module that provides personalized
health management advice and healthy life style modifications that help an individual to lead a healthy life.
The system also features an interactive risk analysis facility to analyze the contribution of each clinical
parameter to the overall risk that can help motivate patients to see the overall benefits of risk factor
modification or elimination.
1 INTRODUCTION
Disease risk prediction plays an important role in the
primary prevention of cardiovascular disease,
hypertension or diabetes. At least 25 % of the
coronary patients die suddenly without any prior
symptoms. The International Diabetes Federation
recently published findings revealing that in 2007,
the country with the largest numbers of people with
diabetes is India (40.9 million) (Yadav et al. 2008).
Statistics indicate that there is one person in the
world dying of diabetes every ten seconds.
Cardiovascular disease (CVD) and Hypertension
(HTN) are the leading causes of mortality in persons
with type 2 Diabetes Mellitus (DM) (Bhopal et al.
2005). Hence risk prediction, primary health care,
prevention and management of these inter related
diseases is critically important.
In this paper, an integrated risk assessment
methodology has been suggested that is primarily
based on the Framingham Heart Studies (Black
2002; Wilson et al. 1998; Department of Health and
Ageing: Australian Government 2008). We have
developed an Integrated Risk Assessment System
that takes in to account the patients’ important
clinical data as well as anthropological details and
calculates an individual’s risk of developing
cardiovascular disease, Diabetes and Hypertension.
The main contributions of this paper are:
(i) Development of an integrated platform for early
prediction of the probability of occurrence of CVD,
HTN & DM.
(ii) Provision for “Interactive Risk Analysis (IRA)”
where the variation of risk against each of the
clinical health parameters is visually depicted in the
534
Priya B., Nadig S., Maru S., Srinivas A., Shangari N., Biswas A. and Krishnamurthy S..
DEVELOPMENT OF AN INTEGRATED RISK ASSESSMENT PLATFORM FOR THE MANAGEMENT OF CARDIOVASCULAR DISEASES, DIABETES
AND HYPERTENSION.
DOI: 10.5220/0003150705340542
In Proceedings of the International Conference on Health Informatics (HEALTHINF-2011), pages 534-542
ISBN: 978-989-8425-34-8
Copyright
c
2011 SCITEPRESS (Science and Technology Publications, Lda.)

form of a “Slider” for all the three diseases, allowing
the user to change the risk factor profile of the
patient and to see the consequent benefits/risks to
the patient.
(iii) Provision for “Visual Analysis” of risk
variance that can be used by medical professionals
to educate the patient on his own health progress
with subsequent visits.
(iv) Provision of “Healthy Life Style” advice
based on the calculated risk that can help a patient
adopt “therapeutic” life style changes related to diet,
exercise etc, thereby favourably affecting his
chance of developing CVD.
(v) Development of a simple “Patient Education
Module” that can be effectively used by doctors and
non-physician health care providers to educate a
patient on his own prevailing medical condition,
through pictorial illustrations.
This integrated system developed by the authors can
be very effectively used by health care professionals
for day-to-day patient diagnosis and advice. The
system can play an effective role in a medical school
as a “Medico’s Educational Kit’. In the current
scenario in most developing countries where there is
acute shortage of doctors especially in remote rural
areas, this system can be used to help non-physician
workers in Primary Health Centres to arrive at a few
basic diagnostic decisions on patients visiting these
centres.
2 RELATED WORK
Research has been carried out on the prediction of
CVD in Asians using the FINRISK model (Bhopal
et al. 2005). The Framingham and FINRISK models
have been shown to give similar results in expected
patterns. Incidentally, the SCORE model (Paynter et
al. 2009) shows a variation in predicted risks,
reflecting its lack of inclusion of HDL and diabetes
as risk factors. National mortality data and modelled
predictions agree reasonably well for South Asians
combined and Bangladeshi & Pakistani men, but not
for Indian men and Pakistani and Bangladeshi
women (Bhopal et al. 2005). The model used in this
paper suggests that potential gains from controlling
major established risk factors could be substantial in
South Asians and greater than in Europeans.
The authors conclude that the FINRISK (Bhopal
et al. 2005) and Framingham models predict CVD
outcomes with better accuracies in South Asians as a
group but inconsistent with some subgroups. The
conclusion is compatible with work using the
Framingham equation (Quirke et al. 2003), which
mainly focuses on adjustment and refinement of
Framingham scores to specially suit the Black and
Minority Ethnic Groups (BMEG) in the UK.
The Framingham risk prediction tool has been
updated recently (D’Agostino et al. 2008). As a first
step, the authors use the tool to estimate the risk for
a general class of population. Later, they modify the
tool to address individual risk assessment. A sex-
specific multivariable risk factor
algorithm has been
used by the authors and it has been demonstrated
that the scores obtained by this specific
categorization yields better accuracies in terms of
CVD prediction.
Analysis has been performed on the data
pertaining to a section of men and women in the age
group of (30–74) years at 5-year age increments, to
systematically assess the risk factor combinations
that allow risk thresholds to be reached and how
different risk burdens translate into vascular age
(Mendis et al. 2007).
Two non-genetic risk prediction models have
been proposed in another research work (Paynter et
al. 2009). The first model includes the covariates
from the Third Report of the National Cholesterol
Education Program Expert Panel on Detection,
Evaluation, and Treatment of High Blood
Cholesterol in Adults’ risk score, as well as family
history of diabetes (high-risk equivalent) in
individuals. The second model uses the covariates
from the Reynolds Risk Score, a model that includes
additional biomarker information, as well as data on
family history.
The other Prediction tools for risk of
cardiovascular diseases include the following.
PROCAM (Prospective Cardiovascular Munster
Study) - The scoring system developed to predict
acute coronary events (Mendis et al. 2007).
Reynolds risk score developed to predict CVD in
women, based on family history of CVD, high-
sensitivity C-reactive protein, and hemoglobin A1C
(the latter in individuals with diabetes) (Ridker et al.
2007).
SCORE (Systematic Coronary Risk Evaluation) -
HEARTSCORE system, developed to predict fatal
CVD (Perez-Lopez et al. 2010).
QRISK score, using the QRESEARCH database
(Cox et al. 2007).
ASSIGN risk score, based on the Scottish Heart
Health Extended cohort (Woodward et al. 2007).
Cardiovascular disease (CVD) is the leading cause
of the growing global disease burden due to non-
DEVELOPMENT OF AN INTEGRATED RISK ASSESSMENT PLATFORM FOR THE MANAGEMENT OF
CARDIOVASCULAR DISEASES, DIABETES AND HYPERTENSION
535
communicable diseases. Risk prediction tools that
easily and accurately predict an individual's absolute
risk of CVD are a key to targeting limited health
care resources at high-risk individuals who are likely
to benefit the most. Health systems in low-income
countries do not have the basic infrastructure to
support resource-intensive risk prediction tools,
particularly in a primary healthcare setup (Mendis et
al. 2007).
The risk prediction strategies as described above
are very vital to the management of Cardio Vascular
and related diseases. But there is still a wide scope to
develop comprehensive prediction systems that
consider multiple diseases and help healthcare
professionals in predicting the probability of
occurrence of these diseases. Risk assessment
models that are currently available work as stand-
alone models and do not integrate modules on
treatment/management of the identified risks. Also,
the tables and monograms used in the Framingham
risk assessment modules are time consuming and
cannot easily be used in day-to-day practice due to
time constraints.
The system developed as an outcome of this
research aims to simplify the risk assessment process
and also integrates the modules for management of
the identified risks. In addition, the system provides
visual cues to the risks in a simplified manner to
patients, helping them understand their risks, thereby
increasing patient participation and compliance in
the management of chronic life style diseases where
patient motivation is the key to success.
These should help doctors to educate patients on
the exact causes of these diseases and also
illustratively advise patients on the diet plan required
and the life style modifications.
3 TECHNIQUES
OF RISK PREDICTION
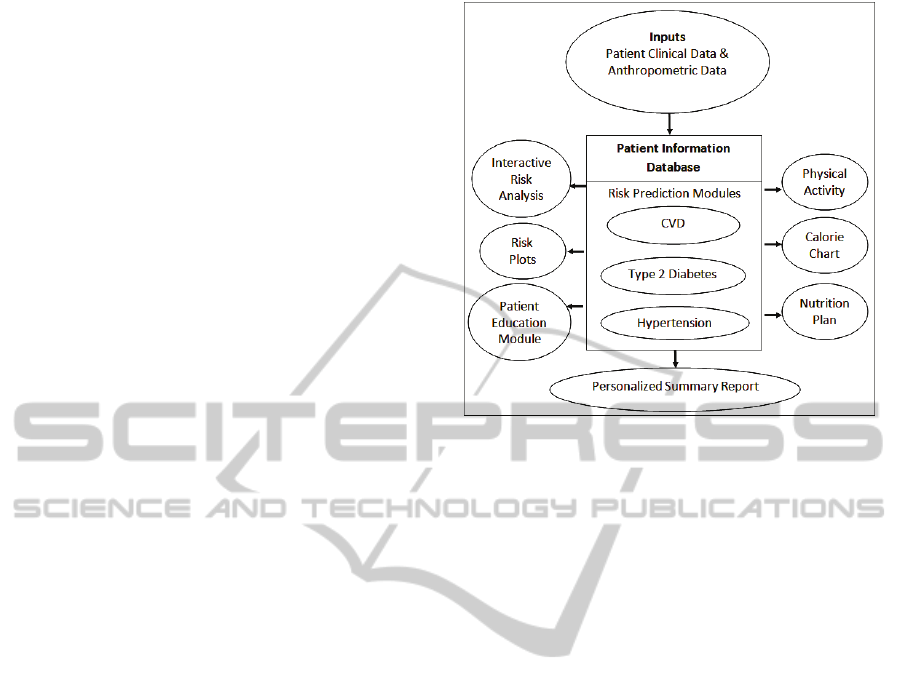
Fig.1 shows the Integrated Risk Assessment and
Health Management System (IRAHMS) developed
in this research for all the three diseases. The three
major risk assessment subsystems are CVD, HTN
and Type 2 Diabetes.
The personalized summary report contains the
risk probabilities of all three diseases (CVD, DM
and HTN) since they are highly inter-related.
Figure 1: Integrated Risk Assessment and Health
Management System [IRAHMS].
3.1 Cardio Vascular Disease (CVD)/
Coronary Heart Disease (CHD)
Framingham Heart Study is used to determine an
individual’s risk of developing CVD in the
subsequent five and ten years (Black 2002). The
model has been improved in such a way that a major
emphasis is given to the total cholesterol and HDL
Cholesterol (HDL-C), thereby giving extra weight to
cholesterol as a major risk factor (Wilson et al.
1998).
3.1.1 5-Year Risk Prediction
The risk assessment model for 5-year CVD risk
prediction (Black 2002) is analyzed based on
Framingham Heart Study. The risk factors included
in this model are age, smoking and diabetic status,
Total Cholesterol (TC), HDL-C and Systolic Blood
Pressure (SBP) measurement. Scores corresponding
to each of the above clinical parameters are
calculated. The cumulative score is used to find the
risk probability. Fig. 2 shows the samples of the
points used for the risk assessment.
3.1.2 10-Year Risk Prediction
The 10-year CVD risk prediction model for men and
women is analyzed with a score sheet using TC or
LDL-C categories (Wilson et al. 1998) with
cholesterol as a major risk factor. It considers age,
TC (or LDL-C), HDL-C, Blood Pressure (BP),
diabetes and smoking as the major risk factors. It
HEALTHINF 2011 - International Conference on Health Informatics
536
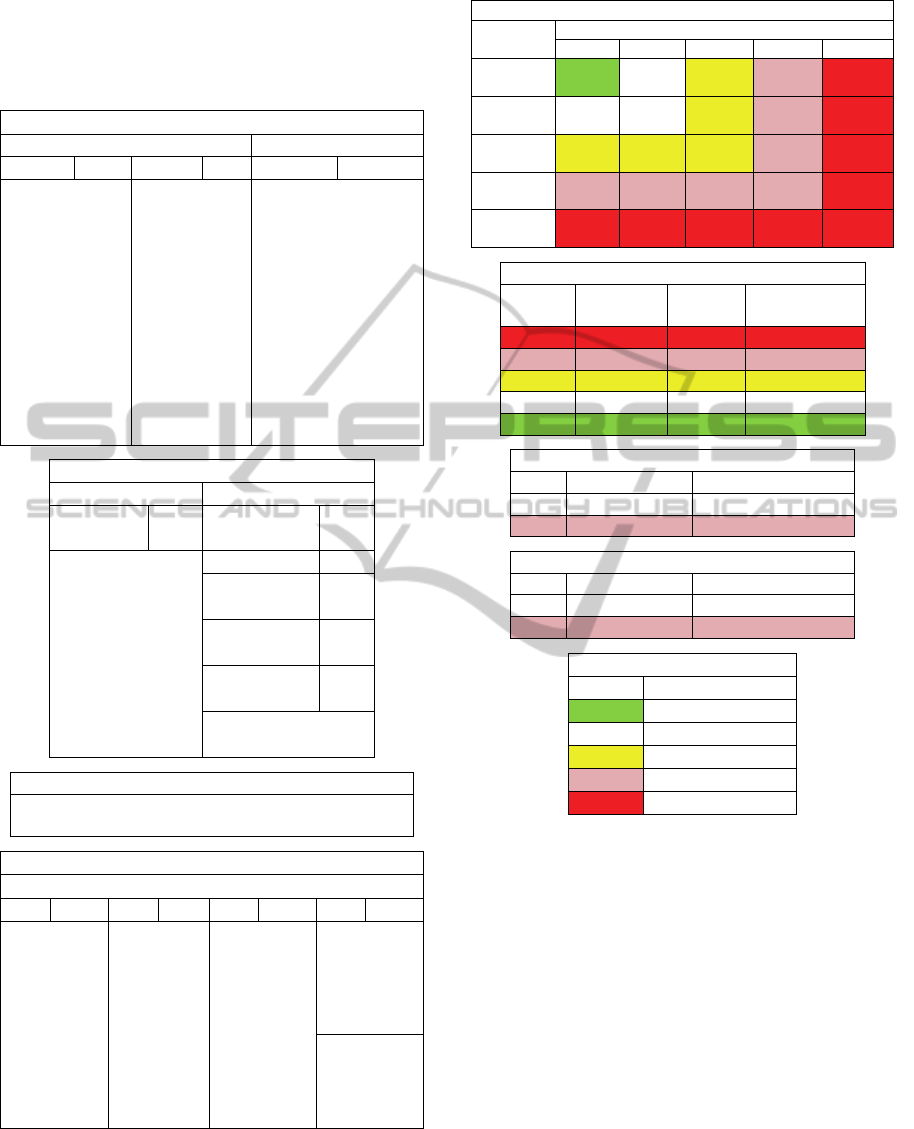
estimates risk for CVD over a period of 10 years
based on Framingham experience in men 30 to 74
years old as a baseline. The tables in Fig.3 are used
for CVD risk prediction for the subsequent 10-years.
2a. Find Points for Each Risk Factor
Age (if male) HDL Cholesterol
Age Pts Age Pts HDL C Pts
30 -2 50-51 10 25-26 7
31 -1 52-54 11 27-29 6
32-33 0 55-56 12 30-32 5
34 1 57-59 13 33-35 4
35-36 2 60-61 14 36-38 3
37-38 3 62-64 15 39-42 2
39 4 65-67 16 43-46 1
40-41 5 68-70 17 47-50 0
42-43 6 71-73 18 51-55 -1
44-45 7 74 19 56-60 -2
46-47 8 61-66 -3
48-49 9 67-73 -4
2b. Points (continued)
Systolic B.P.
SBP Pts Other
Factors
Pts
98-104 -2 Smoking 4
105-112 -1 Diabetic
Male
3
113-120 0
121-129 1 Diabetic
Female
6
130-139 2
140-149 3 ECG
LVH
9
150-160 4
161-172 5 0 points for each
NO
173-185 6
2c. Add Point For All Risk Factors
Total Points = Sum of Risk Points For (Age, HDL
C, Total C, SBP, Smoker, Diabetes, ECG-LVH).
2d. Look Up Risk Corresponding to Point Total
Probability of CVD
Pts 5 yr Pts 5 yr Pts 5 yr Pts 5 yr
<1 <1% 10 2% 19 8% 28 19%
2 1% 11 3% 20 8% 29 20%
3 1% 12 3% 21 9% 30 22%
4 1% 13 3% 22 11% 31 24%
5 1% 14 4% 23 12% 32 25%
6 1% 15 5% 24 13%
7 1% 16 5% 25 14%
8 2% 17 6% 26 16%
9 2% 18 7% 27 17%
Figure 2: Sample of points used for risk assessment (Black
2002).
Blood Pressure
Systolic
(mm Hg)
Diastolic (mm Hg)
<80 80-84 85-89 90-99 >=100
<120 0 [0]
points
120-129 0 [0]
points
130-139 1 [1]
points
140-159 2 [2]
points
>=160 3 [3]
points
HDL – C
(mg/dl) (mmol/L) LDL
Points
Cholesterol
Points
<35 <0.90 2 [2]
35-44 0.91-1.16 1 [1]
45-49 1.17-1.29 0 [0]
50-59 1.30-1.55 0 [0]
>=60 >=1.56 -1 [-2]
Diabetes
LDL Points Cholesterol Points
No 0 [0]
Yes 2 [2]
Smoker
LDL Points Cholesterol Points
No 0 [0]
Yes 2 [2]
Key
Color Relative Risk
Green Very low
White Low
Yellow Moderate
Rose High
Red Very high
Figure 3: Ten-year risk score tables for men and women
(Wilson et al. 1998).
Fig.4 shows the snapshot of the system for CVD
risk prediction in the subsequent 5-years and 10-
years.
The 10-year risk prediction in the graphic is
based on elevated TC.
3.1.3 Design of an Interactive Risk Analysis
Mechanism: The SLIDER
Based on domain inputs from the medical experts, a
SLIDER facility has been added to the system as
shown in Fig.4. The philosophy and usage of the
slider is as follows:
All the clinical parameters that are modifiable
through medical intervention (soft attributes) are
provided with a radio button as shown. Once a
particular radio button is selected(corresponding to
DEVELOPMENT OF AN INTEGRATED RISK ASSESSMENT PLATFORM FOR THE MANAGEMENT OF
CARDIOVASCULAR DISEASES, DIABETES AND HYPERTENSION
537
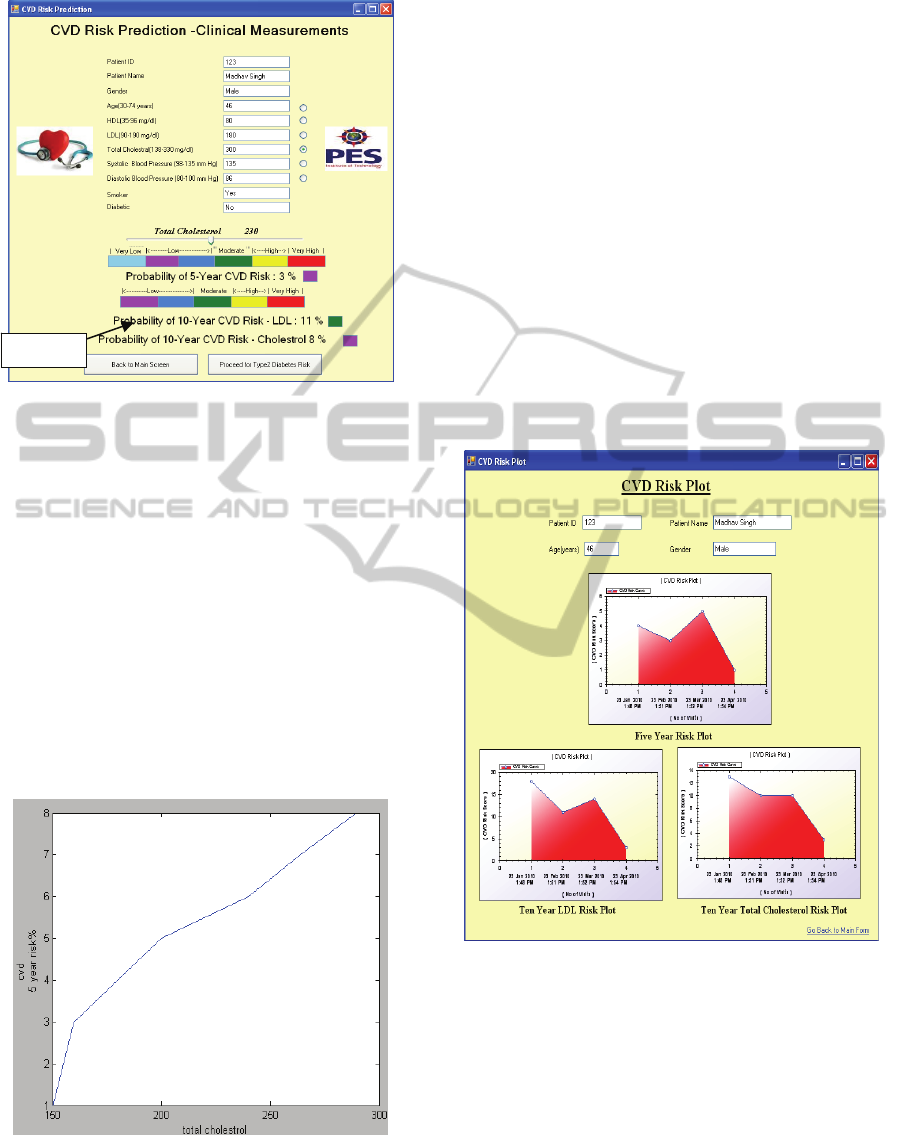
Figure 4: CVD risk assessment subsystem.
the clinical parameter chosen), the slider can be
varied over its range (for example, TC over the
range 150-330 mg/dl) and the corresponding change
in risk percentages are displayed as indicated in
Fig.4, keeping all the other attributes unchanged.
This feature is very distinct and very useful since the
effect of a change in the said parameter is directly
translated into the Risk and displayed. Doctors can
use this feature to advise and educate the patient on
the need to control the health parameter in order to
bring the risk down to an acceptable level. The same
analogy holds for the other clinical parameters also.
A sample graph of change in 5-year risk
percentages as a consequence of Total Cholesterol
changes is shown in Fig.5.
Figure 5: Variation of 5-year risk for changes in total
cholesterol.
The doctor uses this analysis to educate the
patient on the need to control the cholesterol levels
to bring down the risk percentages to an acceptable
level.
The color code depicted in Fig.4 is based on
Framingham color charts and the color boxes shown
next to the predicted risk percentages indicate the
severity of risk. This varying slider value of the
parameter being changed does not modify the
database content for the patient. It only indicates
visually to the patient, the effect of changing the
clinical parameter on the risk probability.
3.1.4 CVD Risk Plots
One another useful feature that has been
implemented in this system is the risk plot. Upon
subsequent visits by the patient to the doctor, there is
a need to graphically visualize as to how the risks
are getting changed between visits. For this purpose,
2-D plots are implemented as shown in Fig. 6.
Figure 6: CVD risk plots.
As seen in Fig.6, the plots convey to the doctor
as well as the patient, the trends in risks over
subsequent visits. These trends can be used by the
doctor to advise the patient on the variation in risks
over the visits. There are a few ways in which these
trends could be effectively utilized for analysis. For
example, due to the right usage of medication, diet
regulation and physical exercises, the risk has come
down in Fig.6 during Visit-2. During the third visit,
the patient did not follow doctor’s advice completely
and suddenly, there is an increasing trend in risk.
SLIDE
HEALTHINF 2011 - International Conference on Health Informatics
538
This is visually depicted in Fig.6.
Again, these risk plots can be used by the doctors
to even assess the effectiveness of a drug for a
particular patient condition.
3.2 Hypertension
Risk score for predicting hypertension is based on
Framingham Heart Study (Parikh et al. 2008).
Hypertension is defined as a condition with the
Systolic blood pressure of 140 mm Hg or higher or
the diastolic blood pressure of 90 mm Hg or higher.
The clinical predictors of hypertension considered in
this study are gender, age, SBP, Diastolic Blood
Pressure (DBP), Body Mass Index (BMI), Parental
Hypertension (maternal or paternal hypertension),
whether the person is currently a smoker or not,
HDL-C, Triglyceride (TGL), TC, Blood Glucose
and whether the person is physically active or not,
out of which the risk score for first seven attributes
are taken from Framingham Heart Study and the risk
score for the next five attributes are calculated based
on the odds ratio (Wang et al. 2006).
The odds ratio is a measure of effective size,
describing the strength of association or non-
independence between two binary data values. The
odds ratio is a way of comparing whether the
probability of a certain event is the same for two
groups.
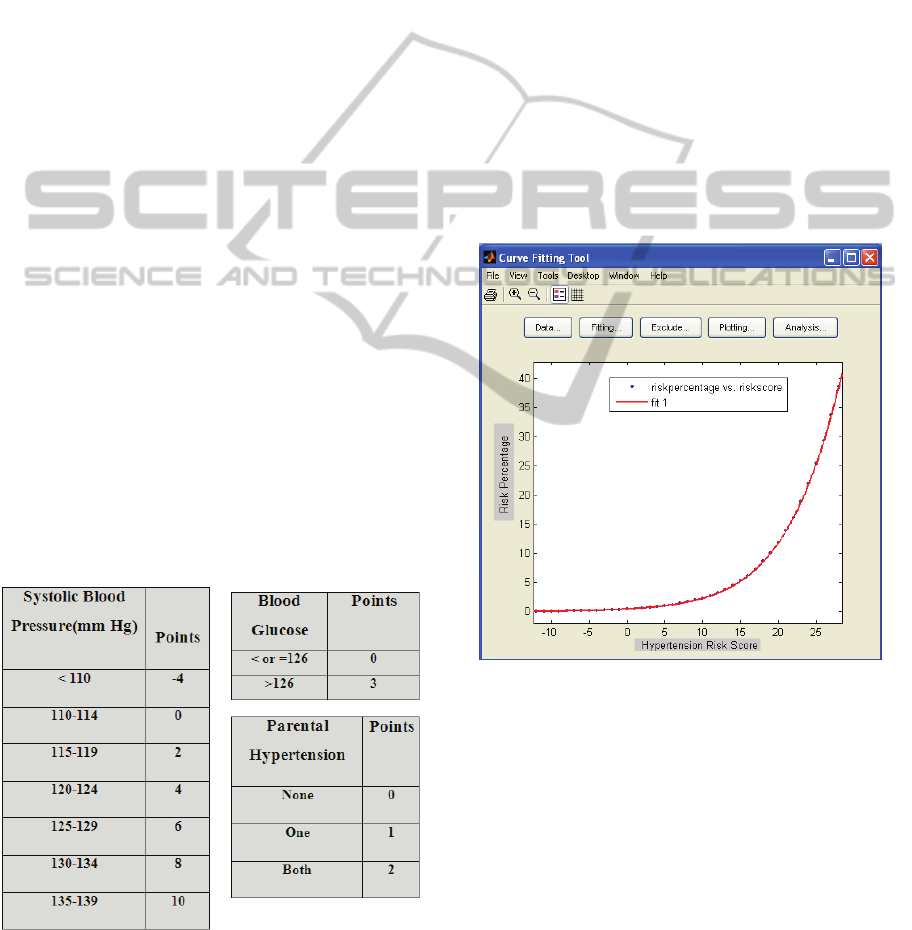
3.2.1 Hypertension Risk Assessment
From the Framingham heart study and based on
odds ratio, risk scores for different predictors of
hypertension are as shown in Fig.7:
Figure 7: Hypertension risk score tables (Parikh et al.
2008).
The scores assigned based on Odds Ratio for the
above attributes are the same as that of Framingham
study. The total effective risk score is the cumulative
value of the individual scores. Risk percentages for
1-year, 2-years and 4-years given by the
Framingham study for different risk scores are
considered to fit a curve using MATLAB Curve
fitting tool which gives a fifth degree polynomial as
shown in Fig.8. The Polynomial corresponding to
Fig. 8 is obtained as:
f(x) = p1*x
5
+ p2*x
4
+ p3*x
3
+ p4*x
2
+ p5*x + p6
This curve fitting helps in translating the risk
scores to risk percentages. Fig.9 shows a snap shot
of the Hypertension Risk Prediction subsystem. In
line with the CVD Risk Assessment subsystem, this
Hypertension risk assessment subsystem also has a
Slider option to study the effect of the clinical
parameter variation on the risk percentages (For Ex.,
Total Cholesterol shown in Fig.9).
Figure 8: Derivation of hypertension risk probability from
risk scores.
3.3 Type 2 Diabetes
Diabetes mellitus is a metabolic disease
characterized by hyperglycaemia resulting from
defects in insulin secretion, insulin action, or both.
Type 2 diabetes is a chronic (long-term) disease
marked by high levels of sugar in the blood. The
Risk Factors for Diabetes are Age, Family History,
Central Obesity, Physical Inactivity and Sedentary
Living, Insulin Resistance, Urbanization, Stress etc.
DEVELOPMENT OF AN INTEGRATED RISK ASSESSMENT PLATFORM FOR THE MANAGEMENT OF
CARDIOVASCULAR DISEASES, DIABETES AND HYPERTENSION
539
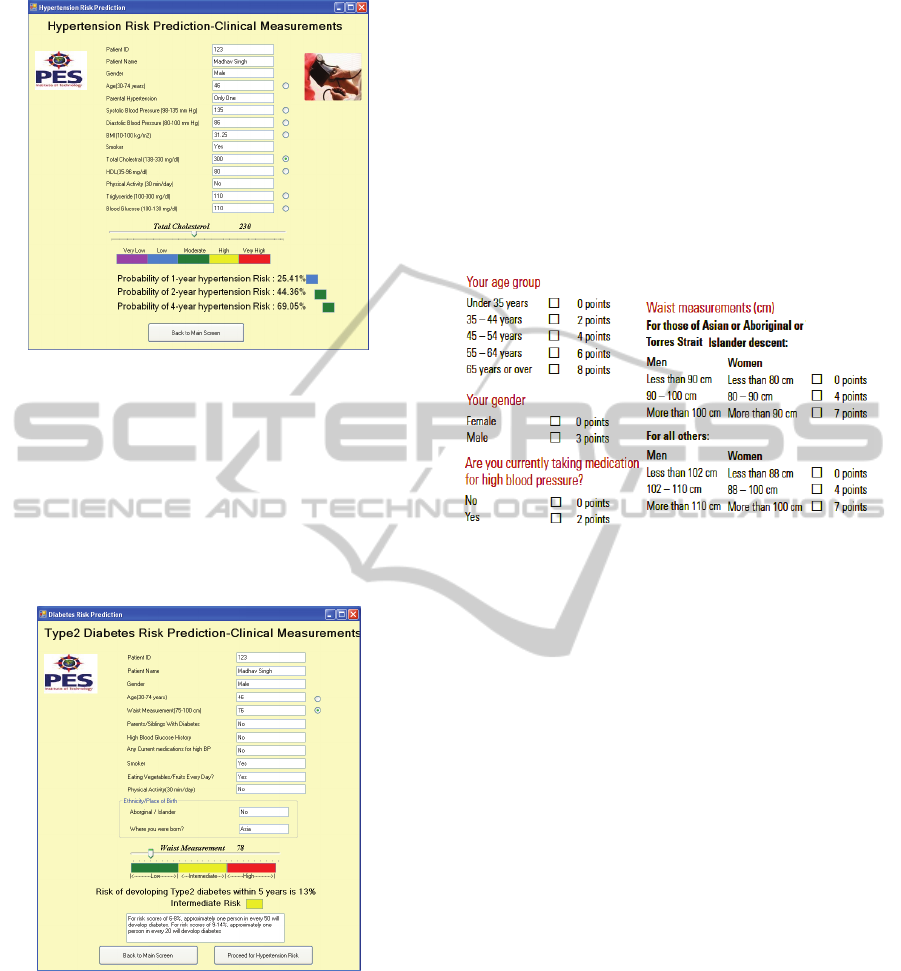
Figure 9: Hypertension risk assessment subsystem.
3.3.1 Type 2 Diabetes Risk Assessment
The type 2 diabetes risk assessment model has been
developed to provide a basis for both doctors and
healthcare workers to assess the patient’s current
level of risk of developing Type 2 Diabetes over the
subsequent five years. Fig.10 shows the snapshot of
the system for diabetes risk assessment.
Figure 10: Diabetes risk assessment subsystem.
In the development of diabetes risk assessment
model, a range of factors are considered that directly
influence the occurrence the disease including
alcohol, smoking and obesity.
3.3.2 Analysis of Risk Factors
The risk score (Department of Health and Ageing:
Australian Government 2008) is derived for a
population with ages 25 years or older, and the score
of zero is given for those with an age less than 25
years. Thus the use of this model for a population of
age less than 25 years is inaccurate. The score
measures physical activity by duration but not by
intensity. Thus, a person who walks for two hours in
a week scores the same as someone who spends two
hours in the gym in that week. Detailed analysis
(Yadav et al. 2008) shows very little change in the
computed score when the intensity of physical
activity is considered. The scores in Fig.11 are used
to arrive at the 5-year diabetes risk prediction.
Figure 11: Scores for five-year diabetes risk assessment
(Woodward et al. 2007).
The waist measurement is part of a risk score
along with other factors; Here, three classes namely
(<90 cm, 90-100 cm, >100 cm) for men are used. A
more granular classification is likely to provide
better risk prediction. In the Australian context
(Department of Health and Ageing: Australian
Government 2008), population of Aboriginal and
Torres Strait Islander origin have a much higher
mean overall score than does any other ethnic group.
Hence users of the risk score can be confident that
when used on an Aboriginal and Torres Strait
Islander population, the risk score is likely to
accurately reflect their overall risk.
The Slider option to assess the risk in relation to
the clinical parameter variation is provided in line
with the option explained under the CVD subsystem.
For example, in the snapshots, the Waist
Measurement is varied using the slider to observe
the change in risk percentages. The doctor uses this
analysis for diagnosis, treatment and to educate the
patent on the need to bring down the weight in order
to reduce the diabetes risk.
4 HEALTH MANAGEMENT
As brought out in the system model of Fig.1, this
Health Management sub system has been developed
HEALTHINF 2011 - International Conference on Health Informatics
540
as an aid to patients to assess the dietary
requirements and the physical activity prescription,
purely personalized for the patients’ health
condition. Also, a patient education module has been
developed to brief the patient about his precise
health condition that warrants a personalized
treatment. The following sections deal with the
components of this Health Management sub system.
4.1 Nutritious Food, Calorie Charts
and Physical Activity
Healthy lifestyle can be achieved by learning some
nutritional basics and personalizing them to an
individual (Wang et al. 2006). The model provides
guidelines and tips for creating and maintaining a
satisfying, healthy diet called DASH (Dietary
Approaches to Stop Hypertension). DASH is
recommended for people with hypertension or pre
hypertension. DASH diet eating plan has been
proven to lower blood pressure in studies sponsored
by the National Institutes of Health. It is based on a
Diet plan rich in fruits and vegetables, and low-fat or
non-fat dairy products which is a key feature of
high-fiber, low caloric-density, balanced meals with
appropriate serving sizes.
The system provides simple suggestions that aid
in lifestyle modifications. For health benefits,
physical activity should be moderate or vigorous and
add up to at least 30 minutes a day. The activity
pyramid (available with the system) is a guide that
can be used to plan for an active lifestyle. The health
management part of the model includes general
health and hygiene guidelines for patient education
purposes.
Health management part of patient education
module for a patient pertaining to the three diseases
(CVD, Diabetes and HTN) contains the functioning
of different body parts like heart, cells etc. It also
contains the symptoms of a disease, the disease
stages based on parameters like cholesterol and their
effect on the patient health condition for the three
diseases.
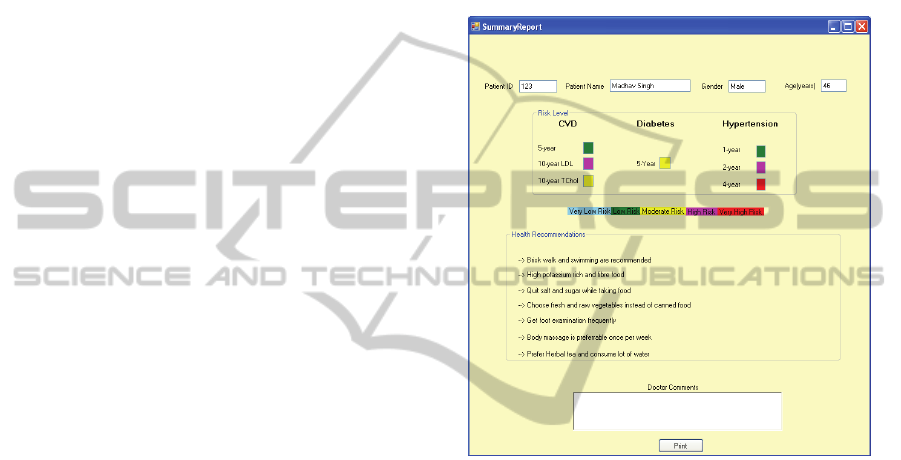
4.2 Personalized Summary Report
A very interesting feature of the Integrated Risk
Assessment and Health Management System
(IRAHMS) is the generation of a personalized
summary report that is to be handed over to the
patient along with the doctor’s diagnosis and
treatment, at the end of a session with the doctor.
Fig.12 shows a representative report.
The personalized summary report along with the
doctor’s comments for a patient during a visit is
generated including the risk levels for all three
disease conditions. It also includes dietary and
physical activity recommendations based on
individual patient risk levels with do’s and don'ts of
physical activity and food habits. This report can be
used as a guideline by the patient to keep up with the
doctor’s advice and also to be vigilant about his
personal health.
Figure 12: Personalized summary report.
5 CONCLUSIONS
AND FUTURE WORK
The integrated risk assessment system developed in
this work helps a doctor to assess the individual
patient’s risk for all the three major diseases. The
risk plots also help the doctor to assess the
effectiveness of a drug and monitor the trends in the
patient’s risk percentages over subsequent visits.
With the interactive risk analysis (using a slider), the
doctor/health worker can advise and educate the
patient on the need to control the clinical parameters
in order to bring down the risk.
Work is underway to extend this IRAHMS as a
web portal where both patients and doctors can log
in through proper authentication. Patients will be
able to remotely log into the system and update their
clinical parameters. Doctors will access this
information and update the summary report based on
their analysis. This process will extensively help in
DEVELOPMENT OF AN INTEGRATED RISK ASSESSMENT PLATFORM FOR THE MANAGEMENT OF
CARDIOVASCULAR DISEASES, DIABETES AND HYPERTENSION
541

patient healthcare especially in cases where doctor’s
personal intervention is not required and the advice
to patients can be provided over this portal. This will
have a very high impact on the present overall
healthcare system where doctors’ availability is very
scarce in remote rural areas.
ACKNOWLEDGEMENTS
The authors are thankful to SAP Research and SAP
Labs, India for funding this project as a part of the
“1
st
SAP Research & Innovation Award” granted to
PES Institute of Technology.
REFERENCES
Black, H. R., 2002, ’Cardio-Vascular Risk Factors’, Yale
University of Medicine Heart Book, Chapter 3, pp. 32-
36.
Wilson, P. W. F., D’Agostino, R. B., Levy, D., Belanger,
A. M., Silbershatz, H. & Kannel W. B., 1998, ‘MD
Prediction of Coronary Heart Disease Using Risk
Factor Categories’, American Heart Association.
‘Australian Type2 Diabetes Risk Assessment Tool’,
Australian Government, Department of Health and
Ageing, July 2008.
Bhopal, R., Fischbacher, C., Vartiainen, E., Unwin, N.,
White, M & Alberti G, 2005, ’Predicted and observed
cardiovascular disease in South Asians: Application of
FINRISK, Framingham and SCORE models to
Newcastle Heart Project data’, Journal of Public
Health, Vol. 27, No.1, pp. 93-100.
Paynter, N. P., Chasman, D. I., Buring, J. E., Shiffman, D.,
Cook, N. R. & Ridker, P. M., 2009, ‘Cardiovascular
Disease Risk Prediction With and Without Knowledge
of Genetic Variation at Chromosome’ , Annals of
Internal medicine, Vol. 150, No. 2, pp.65-72.
Quirke, T. P., Gill, P. S., Mant, J. W. & Allan, T. F., 2003,
‘The applicability of the Framingham coronary heart
disease prediction functions to black and minority
ethnic groups in the UK’, Department of Primary
Care and General Practice, University of
Birmingham, pp. 785– 786.
D’Agostino, R. B., Vasan, R. S., Pencina, R. J., Wolf, P.
A., Cobain, M., Massaro, J. M. & William B. Kannel,
2008, ‘General Cardiovascular Risk Profile for Use in
Primary Care The Framingham Heart Study’,
American Heart Association, Inc., pp. 743-753.
Mendis, S., Lindholm, L. H., Mancia, G., Whitworth, J.,
Alderman, M., Lim, S. & Heagerty, T., 2007, ‘World
Health Organization (WHO) and International Society
of Hypertension (ISH) risk prediction charts:
assessment of cardiovascular risk for prevention and
control of cardiovascular disease in low and middle-
income countries’, Cardiovascular Diseases, World
Health Organization, Geneva, Switzerland, pp. 1578-
82.
Ridker, P. M., Buring, J. E., Rifai, N & Cook, N. R., 2007,
‘Development and validation of improved algorithms
for the assessment of global cardiovascular risk in
women: the Reynolds Risk Score’, Journal of
American Medical Association, Vol. 297(6).
Pérez-López, F. R., Cuadros-López, J. L., Fernández-
Alonso, A. M., Cuadros-Celorrio, A. M., Sabatel-
López, R. M. & Chedraui, P., 2010, ‘Assessing fatal
cardiovascular disease risk with the SCORE
(Systematic Coronary Risk Evaluation) scale in post-
menopausal women 10 years after different hormone
treatment regimens’, Gynecological Endocrinology,
26(7):533-8.
Cox, J. H., Coupland, C., Vinogradova, Y., Robson, J.,
May, M. & Brindle, P, 2007, ‘Derivation and
validation of QRISK, a new cardiovascular disease
risk score for the United Kingdom: prospective open
cohort study’, British Medical Journal.
Woodward, M., Brindle, P. & Pedoe, H. T., 2007, ‘Adding
social deprivation and family history to cardiovascular
risk assessment: the ASSIGN score from the Scottish
Heart Health Extended Cohort (SHHEC)’, British
Medical Journal, Heart 2007.
Parikh, N. I., Michael, J., Pencina et al, 2008, ‘A Risk
Score for Predicting Near-Term Incidence of
Hypertension: The Framingham Heart Study’, Annals
of Internal Medicine.
Wang, W., Lee, ET; Fabsitz RR et al, 2006, ‘A
Longitudinal Study of Hypertension Risk Factors and
Their Relation to Cardiovascular Disease the Strong
Heart Study’, American Heart Association,
Hypertension.
Yadav, R., Tiwari, P. & Dhanaraj, E., 2008, ‘Risk factors
and complications of type 2 diabetes in Asians’,
CRIPS Vol. 9 No. 2.
‘Lowering Your Blood Pressure With DASH’, U.S.
Department of Health and Human Services, National
Institutes of Health National Heart, Lung, and Blood
Institute, No. 06-4082, April 2006.
HEALTHINF 2011 - International Conference on Health Informatics
542
