
REQUIREMENTS
FOR INTERACTIVE ONTOLOGY VISUALIZATION
Using Hypertree +2.5D Visualization for Exploring
Relationships between Concepts
Isabel Cristina Siqueira da Silva
1,2
and Carla Maria Dal Sasso Freitas
1
1
Instituto de Informática, UFRGS, Av. Bento Gonçalves, 9500, Porto Alegre, RS, Brazil
2
Faculdade de Informática, Centro Universitário Ritter dos Reis, UNIRITTER
Rua Orfanotrófio, 555, Porto Alegre, RS, Brazil
Keywords: Visualization, Ontology, Interaction.
Abstract: Ontologies are used for sharing among people or software agents the common understanding of the
information structure in a certain domain. Usually, ontologies are represented as static 2D graphs where the
relationships are displayed as edges, which often overlap and cause cognitive overload. Three-dimensional
representations can also lead to confusion due to occlusion. Moreover, as the ontology grows, incorporating
new concepts (and their relationships) increases the visualization complexity either in 2D or in 3D. In this
paper, we present a study about the requirements of visualization and interaction with ontologies. In order to
do that, we interviewed with four experts on ontology creation and use. From the results, we propose the
design of a 2.5D visualization tool for exploring relationships between ontology concepts.
1 INTRODUCTION
There is a gradual increase of information available
and efficient methods for information retrieval are
necessary in order to allow interoperability and
cooperation between several databases. Data
semantics is the more traditional approach for data
integration because it focuses on the relationship
between data. As such, ontologies define concepts
and ensure interoperability between systems. In his
work, Sowa (2005) points out that ontology is the
study of the categories of things that exist or may
exist in some domain, i.e., it is a catalogue of the
types of things that are assumed to exist in a domain
of interest D from the perspective of a person who
uses a language L for the purpose of talking about D.
According to Gruber (1996), ontology is a formal
and explicit specification of a conceptualization.
Noy and McGuiness (2001) discuss that ontologies
allow sharing the common understanding of the
structure of information among people or software
agents. Ontologies separate domain knowledge from
the operational knowledge, make domain
assumptions explicit and enable reuse.
However, due to the specificities of the concepts
expressed in ontologies, the analysis of individual
relationships is complex. Thus, interactive ontology
visualizations need to be efficient and allow rapid
comprehension of concepts and relationships.
Katifori (2007) confirms that it is not simple to
create a visualization that displays effectively all the
information, and, at the same time, allows the user to
perform easily various operations on the ontology.
Then, the challenge is to define the best way to
represent relationships between categorized concepts
mainly because each concept can have a number of
related attributes.
This work presents requirements analysis for
visualization and interaction in tools aiming at
creating, manipulating and exploring ontologies. We
conducted interviews with users who work with
ontologies and conceptual modelling. From these
results, we present an initial design of a 2.5D
ontology visualization method that aims at
systematizing and transmitting knowledge more
efficiently. The text is organized as follows. Section
2 discusses related work. Section 3 presents the user
interviews and points out requirements for ontology
visualization tools. Section 4 presents our proposal
for ontology visualization. Results are discussed and
final comments are drawn in Section 5.
242
Siqueira da Silva I. and Dal Sasso Freitas C..
REQUIREMENTS FOR INTERACTIVE ONTOLOGY VISUALIZATION - Using Hypertree +2.5D Visualization for Exploring Relationships between
Concepts .
DOI: 10.5220/0003372402420248
In Proceedings of the International Conference on Imaging Theory and Applications and International Conference on Information Visualization Theory
and Applications (IVAPP-2011), pages 242-248
ISBN: 978-989-8425-46-1
Copyright
c
2011 SCITEPRESS (Science and Technology Publications, Lda.)

2 RELATED WORKS
Different authors propose alternatives for
visualization and interaction with ontologies.
Katifori (2007) discusses different techniques
that could be adapted for ontology representation,
such as indented lists, trees and graphs, zooming,
space subdivision (treemaps, information slices),
focus+context and landscapes. Besides that, tools for
ontology visualization and interaction are discussed.
Fluit et al. (2005) present the cluster map technique
as a simple and intuitive method for complex
ontologies visualization.
The OntoSphere tool (Bosca et al., 2005) uses
two techniques - 3D and focus+context – for
providing overview and details according to user
needs. Baehrecke (2004) and Babaria (2004) are
proposing the use of treemaps to visualize GO (Gene
Ontologies Consortium). In a treemap, colour, size
and grouping are used in order to facilitate user
interaction and information extraction.
Protégé (Noy et al., 2000) is the common
software used for the creation and visualization of
ontologies. Protégé’s main visualization for the
ontology hierarchy is a tree view (Class Browser).
However, different visualization techniques have
been proposed: Katifori (2008) presents a
comparative study of four visualization techniques
available in past versions of Protégé: Class Browser,
Jambalaya (discontinued), TGVizTab (discontinued)
and OntoViz. The information retrieval provided by
these tools was also evaluated.
Lanzenberger (2009) discusses the importance of
ontology visualization based on graphs, as well as
tools for mapping and alignment of ontologies, and
views, which employ different structures of graphs
for ontologies visualization. These techniques are
compared in order to point out their advantages and
disadvantages.
Catenazzi et al. (2009) presents a study about
tools for ontologies visualization and proposes the
OWLeasyViz tool. It combines textual and graphical
representations for displaying the class hierarchy,
relationships and data properties. Interaction
techniques such as zooming, filtering and search are
available. Kriglstein and Wallner (2010) present
Knoocks, a visualization tool focused on the
interconnections within the ontology and the
instances. This tool employs the overview + details
approach.
The works by Samper et al. (2008) and Amaral
(2008) address semantics aspects. Amaral (2008)
proposes a semantics-based framework for
visualizing descriptions of concepts in OWL. The
framework aims at allowing users to obtain deep
insights about the meaning of such descriptions,
thereby preventing design errors or misconceptions.
Icons and symbols are used in diagrams to
characterize classes that represent concepts
descriptions. One can combine information
visualization techniques, as in the work by Schevers
et al. (2008), where the user interacts with the
ontology in the Protégé tool. Classes representing
spatial information (like polygons, points, etc.) are
presented in a second graphical interface that is used
to mimic the functionality of a GIS (Geographic
Information System).
The paper by Kriglstein (2009) presents a survey
about users’ attitudes and expectations regarding
ontology visualization, pointing out some
requirements.
3 REQUIREMENTS
FOR INTERACTIVE
VISUALIZATION
OF ONTOLOGIES
The main reason for the use of ontologies is to
provide efficient information retrieval, identifying
non-explicit relationships between data. Thus,
information categorization in ontology modelling is
very important.
Ontologies tend to grow, incorporating new
concepts and relationships, therefore increasing the
visualization complexity. Static graphs, commonly
used for ontology representation (Figure 1), are not
the best alternative for such visualization. Figure 1,
for example, presents two visualizations of the
concepts of an ontology hierarchy built with
Protégé: tree view (Class Browser) and static graph
(OWLViz). The static graph may interfere in the
user's perception about the universe represented in
the ontology because the display of relationships
generates overlapping edges. Likewise, tree view
shows the hierarchy of concepts but not their
relationships. The solution for these problems may
be the use of different information visualization
techniques.
Information visualization and concepts of human
computer interaction can optimize the
comprehension of ontologies. The searched
information can be placed in focus, distinguishing it
from the unnecessary information and facilitating
the understanding of correlated data.
Designers of visualization systems should
consider two main issues: the mapping of
REQUIREMENTS FOR INTERACTIVE ONTOLOGY VISUALIZATION
- Using Hypertree +2.5D Visualization for Exploring Relationships between Concepts
243
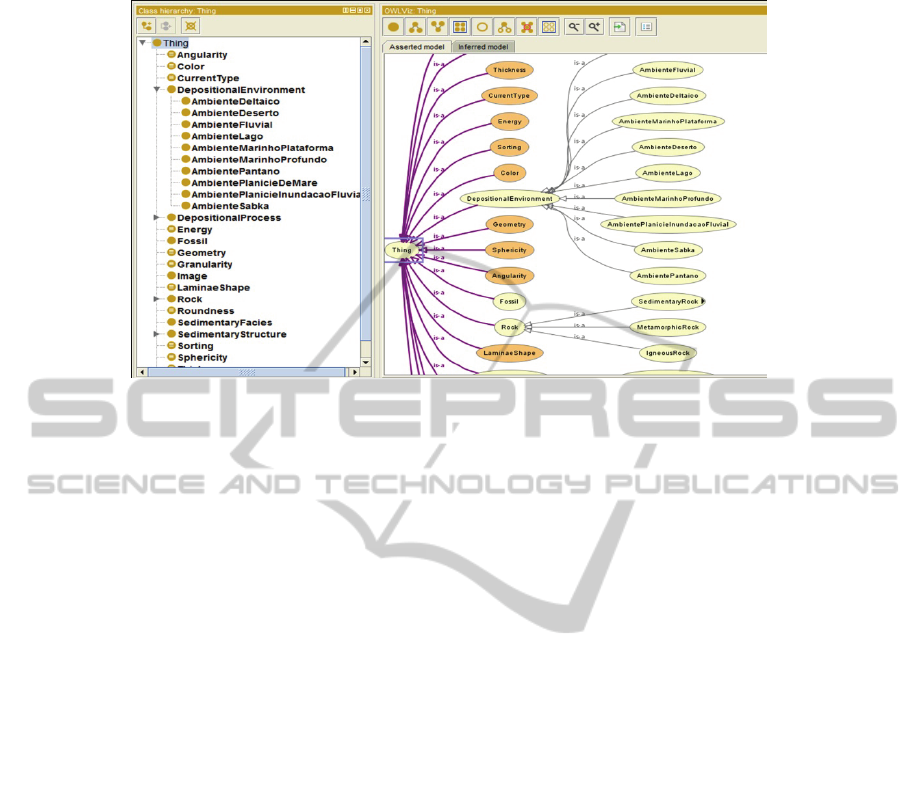
Figure 1: Visualization in Protégé: tree view (left) and static graph (right).
information for a graphical representation in order to
facilitate its interpretation by the users, and means to
limit the amount of information that users receive,
while keeping them "aware" of the total information
space and reducing cognitive effort.
As presented in section 2, many studies have
addressed the issue of the importance of ontology
visualization in creation, manipulation and inference
processes. Different visualization methods have
been proposed, but there are still many gaps to be
filled by efficient methods of visualization and
interaction. The study presented in this paper takes
into account the results already discussed by other
authors, like Katifiori (2007) and Kriglstein (2009),
adding new ideas obtained from the users
interviews.
3.1 Interviews with Users
This study started with interviews with four users,
from the Graduate Program in Computer Science at
UFRGS. They work with ontologies daily and can
be considered experts in the creation and
manipulation of ontologies. From these interviews,
we confirmed some requirements pointed out by
Kriglstein (2009), and list other necessary
requirements for ontology visualization tools.
Three experts are within the Intelligent Database
(IDB) group, whose research focus is knowledge
engineering, case-based reasoning, document
retrieval, information management, and intelligent
databases. Another expert belongs to a group
studying quality of information on the web and
recommendation systems.
Due to the low number of participants,
quantitative measurements were not taken, but the
qualitative notes are very interesting as indicated by
Nielsen (1994). The following questions were posed
to the experts:
1) When an ontology is created, which aspects
could be improved with visualization?
2) After the ontology was created, which
information is searched more often and how this
information could be displayed in order to make
understanding more efficient?
3) When and why a visualization is better than
another?
For question (1), users responded that the main focus
is on the elements that define the structure of the
ontology. These elements refer to the relations
between class and subclasses, between classes, and
between the instances of classes. An ideal
visualization tool should focus on the ontology
kernel (question 3).
During the process of ontology development,
users want to visualize different aspects of specific
demands that arise in a certain stage of development.
Thus, display features could have privileged access
at certain points, for example, checking the range of
an object property. However, the development of
ontologies is still a traditional activity, with no
defined workflow and directly influenced by the
domain.
Another important aspect related to question (1)
is the visualization of the ontology validation
generated by inference processes. Displaying errors
can (should) be improved, with the indication of
correction.
IVAPP 2011 - International Conference on Information Visualization Theory and Applications
244

In relation to question (2), we must consider that
ontologies can encapsulate a large amount of
information (hundreds of thousands of classes and
relationships, for example). Moreover, this large
volume of information can be segmented into
several distinct types (classes, attributes with
different values, relationships between types and
properties). Usually, users do not want to see these
types simultaneously, due to the cognitive overload
it would arise.
For example, clicking on an X-class, relations
with classes Y and Z are displayed. These classes
could be highlighted, while other parts of the
ontology could loose focus. The highlight could be
obtained through visual attributes such as colour,
transparency, shapes and positioning. This feature
would be very useful to get an idea of organizing a
mereology (part-to-whole relationship, part-to-part
relationship). Clicking on a main class could be easy
to identify the classes that represent the parts.
The relationships properties (transitivity,
reflexivity, symmetry, if it is functional or not) are
an important structural component, because they
have impact onto the inference that can be
performed with the ontology. Likewise, the
attributes of each class (data properties) should be
considered in the visualization.
Regarding question (3), the main problems of
current tools for ontologies visualization are
common to any tool for graph visualization:
problems of scale versus amount of information that
needs to be presented. An alternative would be to
use different visualization techniques.
According to Gurr (1999), visual representations
can be constructed in order to express the properties
of a concept. The use of tooltip texts can help in the
encoding of the displayed information, because they
contain high loads of information and are presented
selectively as the user explores the visualization of
the ontology.
Finally, a simple but important suggestion from
the users was that views of ontologies fit on an A4
format, with sufficient level of detail. It would also
be interesting to have a tool that allows adding and
removing elements of the visualization in a quick
and simplified mode.
3.2 Requirements
From such results, we can list the following
requirements for ontology visualization:
Provide overview of hierarchy ontology, with the
possibility of detailing some parts;
Avoid presenting the different aspects of an on-
tology (classes, description, object properties, data
properties, individuals) together in a unique
visualization;
Optimize the results from the ontology
validation;
Explore the use of visual attributes such as
colour, transparency, and shapes;
Provide display filters based on different
techniques of focus+context and/or overview+detail,
zoom, pan and rotation of the image;
Allow rapid and simple inclusion of visual
elements in the visualization, as well as their
removal;
Allow printing the entire ontology in paper sizes
commonly used, such as A4.
Considering these aspects, in the next section, we
present the initial idea of our method to assist the
user in the visualization of ontology hierarchy and
relationships.
4 PROPOSED VISUALIZATION
When we analyze an image, we activate our
perceptual mechanisms to identify patterns and
perform segmentation of elements. The user must
perceive the information presented in the display,
and the understanding involves cognitive
processes. An image can be ambiguous due to lack
of relevant information or by excess of irrelevant
information.
Graphs are the most intuitive form of visualizing
the relationships between concepts of ontologies by
their both hierarchical and relational
characteristics. However, relationships are displayed
in expanded nodes and the overlapping edges can be
a problem for the efficiency of information
display. An interactive graph or tree solves part of
the problem, allowing the user to highlight the
information in focus through selection, but the
overlapping edges are still a problem. In this sense,
Katifiori (2007) list tasks related to ontologies and
visualizations as shown in Table 1.
We studied the hypothesis of representing
ontologies in a 3D space, allowing the user to
navigate through in-depth visual representations,
rotating, expanding and selecting the desired
items. However, such views require the user
immersion and depth perception is crucial.
Considering these aspects, we propose a
visualization method that fits the requirements
pointed out by users as well as the tasks listed in
REQUIREMENTS FOR INTERACTIVE ONTOLOGY VISUALIZATION
- Using Hypertree +2.5D Visualization for Exploring Relationships between Concepts
245

Table 1. In the first part of this study, we have
chosen to focus on visualizing the hierarchy of the
ontology and the relationships between concepts. As
an approach to that, the hyperbolic tree is an
overview+detail method, which reduces the
cognitive overload and the user disorientation that
might happen during the interaction with the nodes,
expanding and contracting them, especially in
ontologies with many concepts.
However, besides the class hierarchy
(relationship "is one"), users of ontologies need to
analyse, in an integrated way, the other ontology
relationships. Thus, we actually have a graph along
with the tree, but end up with the problem of
occlusion of information by the overlapping
edges. This problem can be solved with the use of a
third dimension to display one or more relationships
(object properties) selected by the user. To view
them, we take the plane where the tree is displayed
and perform a 90° rotation around the X-axis (see
Figure 2a). The rotated plane, positioned in 3D as an
XZ-plane, displays the hyperbolic tree, and selected
relationships are represented as curved lines in
space, connecting the related concepts (Figure 2b),
without interfering with the display of the
hierarchical relation.
Table 1: Tasks related to ontologies and information
visualization techniques (adapted from Katifiori, 2007).
Task Description VI Techniques
Overview
Gain an overview of
the entire collection.
Trees and graphs,
3D landscapes,
treemaps (space
filling)
Zoom
Zoom in on items of
interest.
Indented lists, trees
and graphs, 3D
landscapes
Details-on-
demand
Select an item or
group and get details
when needed.
Trees and graphs,
3D landscapes,
Filter
Filter out
uninteresting items.
Indented lists, trees
and graphs
Relate
View relationships
among items.
Indented lists, trees
and graphs,
zooming, 3D
landscapes
History
Keep a history of
actions to support
undo, replay and
progressive
refinement.
-
In addition to rotations around the X-axis, rotations
around the axes Y and Z, zoom and pan are also
allowed, providing full 3D navigation. These
interactions are performed with a control, common
in tools for visualization of georeferenced data and
following usability heuristics "consistency and
standards", Thus, this control becomes more
intuitive for the user in order to facilitate the setting
with the tool.
Figure 2b shows the proposed 2.5D scheme
applied to an ontology hierarchy/graph. We explored
colour and thickness of edges and line contours in
nodes. The user remains "aware" of the ontology
hierarchy and visualizes one or more relationships in
a separate spatial dimension.
Our 2.5D visualization was presented to the four
users after they were interviewed. Informally they
approved the new possibilities for displaying and
interacting with the ontologies represented in that
way.
Also as a preliminary validation, we invited a
fifth specialist, belonging to a group that studies
quality of information on the web and
recommendation systems. She was asked to perform
a new analysis based on three questions: (1) The
initial layout is clear? (2) It is possible to clearly
separate the hierarchy concepts of the relationships
between theses? (3) The technique is useful for the
exploration of ontology aspects? Three possibilities
of answers were defined: Yes; Partially; No. The
user explored the visualization in many ways,
marking the option “Yes” for all questions.
For sure, we need to perform further studies to
find alternatives to display tooltips related to nodes,
attributes, instances and semantic concepts. Icons,
symbols and transparency are being studied in
addition to other information visualization
techniques.
5 FINAL COMMENTS
Information visualization techniques amplify
cognition and reduce exploration time of a data set,
allowing the recognition of patterns and facilitating
inferences about different concepts. We have
designed a visual and interactive way to explore
ontologies, improving the process of insight from
such data.
In this work, we also discussed requirements for
visualization and interaction with ontologies in order
support our approach to help users to perform more
easily and efficiently the different operations on the
ontology. Considering these aspects, we have
proposed a 2.5D visualization of ontologies that
combine aspects of both 2D and 3D views and take
into account the aspects pointed out by the expert
users. The main idea is to provide a representation
that is intuitive and allows efficient analysis of the
IVAPP 2011 - International Conference on Information Visualization Theory and Applications
246

Figure 2: (a) Rotation of the plane with ontology hierarchy and relationships; (b) 2.5D ontology visualization.
concepts displayed in the ontology visualization.
This study represents an initial step in the
development of an ontology visualization
tool. Future work involves the investigation of
alternative display of properties and instances of an
ontology in addition to other requirements listed in
Section 3.
ACKNOWLEDGEMENTS
We would like to thank the users that participated in the
interviews and further evaluation process.
REFERENCES
Amaral, F. Visualizing the semantics (not the syntax) of
concept descriptions. In VI Workshop em Tecnologia
da Informação e da Linguagem Humana (TIL 2008),
Vila Velha, ES, 2008.
Babaria, K. Using Treemaps to Visualize Gene Ontologies,
Human Computer Interaction Lab and Institute for
Systems Research, University of Maryland, College
Park, MD USA, 2004.
Baehrecke, E. H., Dang, N., Babaria, K. Shneiderman, B.
Visualization and analysis of microarray and gene
ontology data with treemaps. BMC Bioinformatics.
2004.
Bosca, A., Bomino, D., Pellegrino, P. OntoSphere: more
than a 3D ontology visualization tool. In Proceedings
of SWAP, the 2nd Italian Semantic Web Workshop,
Trento, Italy, December 14-16, CEUR, Workshop
Proceedings, ISSN 1613-0073, Vol-166, 2005.
Catenazzi, N., Sommaruga, L., Mazza, R. User-friendly
ontology editing and visualization tools: the
OWLeasyViz approach. In: Proceedings of the 13th
IEEE International Conference on Information
Visualisation. Barcellona, Spain. 14-17 July 2009. pp.
283-288. IEEE. ISBN: 978-0-7695-3733-7.
Fluit, C., Sabou, M., Harmelen, F. Ontology-based
Information Visualisation: Towards Semantic Web
Applications. International Symposium of
Visualisation of the Semantic Web (VSW'05). 2005.
Freitas, C. Visualização de Informações e a Convergência
de Técnicas de Computação Gráfica e Interação
Humano-Computador. Jornadas de Atualização em
Informática (JAI), XXVII Congresso da SBC, 2007.
Gruber, T. (1996). What is an ontology? [S.l.: s.n.], 1996.
DOI=http://www-ksl.stanford.edu/ kst/ what-is-an-
ontology.html. Último acesso em: abril de 2009.
Gurr, C. Effective Diagrammatic Communication:
Syntatic, Semantic and Pragmatic Issues, Journal of
Visual Languages and Computing, 10, 317-342, 1999.
Katifori, A.; Halatsis, C.; Lepouras, G.; Vassilakis, C.;
Giannopoulou, e. Ontology Visualization Methods - A
Survey. ACM Comput. Surv. 39, 4 (Nov. 2007), 10.
Katifori A, Torou E, Vassilakis C, Lepouras G, Halatsis
C: Selected results of a comparative study of four
ontology visualization methods for information
retrieval tasks. In: Research Challenges in Information
Science, 2008 RCIS 2008 Second International
Conference on: 2008; 2008: 133-140.
Kriglstein, S. User Requirements Analysis on Ontology
Visualization. Proc. International Conference on
Complex, Intelligent and Software Intensive Systems.
2nd International Workshop on Ontology Alignment
and Visualization, Fukuoka, Japan, 2009.
Kriglstein, S. Wallner, G. Knoocks - A Visualization
Approach for OWL Lite Ontologies. CISIS 2010, The
Fourth International Conference on Complex,
REQUIREMENTS FOR INTERACTIVE ONTOLOGY VISUALIZATION
- Using Hypertree +2.5D Visualization for Exploring Relationships between Concepts
247

Intelligent and Software Intensive Systems, Krakow,
Poland, 15-18 February 2010.
Lanzenberger, M., Sampson, J., Rester, M. Visualization
in Ontology Tools. Proc. International Conference on
Complex, Intelligent and Software Intensive Systems.
2nd International Workshop on Ontology Alignment
and Visualization, Fukuoka, Japan, 2009.
Nielsen, J. Usability Inspection Methods. Proceedings of
Conference on Human Factors in Computing Systems
(CHI’95). 1994. Colorado, USA.
Noy, N., Fergerson, R., Musen, M. The knowledge model
of Protege-2000: Combining interoperability and
flexibility. In Proceedings of 2nd International
Conference on Knowledge Engineering and
Knowledge Management (EKAW'2000), Juanles-Pins,
France, 2000.
Noy, N.; McGuiness, D. Ontology Development 101 – A
guide to creating your first ontology. KSL Technical
Report, Standford University, 2001.
Rocha, H., Baranauskas, M. Design e Avaliação de
Interfaces Humano-Computador. Campinas,
SP:NIED/UNICAMP, 2003.
Samper, J., Tomás, V., Carrillo, E., Nascimento, R.
Visualization of ontologies to specify semantic
descriptions of services. IEEE Transactions on
Knowledge and Data Engineering. 20(1): p. 130-134.
2008.
Schevers, H. A. J., Trinidad, G.; Drogemuller, R.M.
Towards Integrated Assessments for Urban
Development. Journal of Information Technology in
Construction (ITcon), Vol. 11, Special Issue Decision
Support Systems for Infrastructure Management, pg.
225-236. DOI=http://www.itcon.org/2006/17. Último
acesso em: outubro de 2010.
Sowa, J. F. Guided Tour of Ontology, 2005.
DOI=http://www.jfsowa.com/ontology/guided.htm.
Silva, I., Freitas, C. Avaliação de Ferramentas de Busca na
Web baseadas em Visualização de Informações. In:
Simpósio de Fatores Humanos em Sistemas
Computacionais (IHC), 2006, Natal - RN.
IVAPP 2011 - International Conference on Information Visualization Theory and Applications
248
