REAL TIME ELECTROCARDIOGRAM SEGMENTATION FOR
FINGER BASED ECG BIOMETRICS
Andr´e Lourenc¸o
1,2
, Hugo Silva
2,3
, Paulo Leite
1
, Renato Lourenc¸o
1
and Ana Fred
2
1
DEETC, ISEL-IPL, Lisbon, Portugal
2
Instituto de Telecomunicac¸˜oes, IST-UTL, Lisbon, Portugal
3
PLUX - Wireless Biosignals, S.A., Lisbon, Portugal
Keywords:
Biometrics, Electrocardiography (ECG), Biosignal processing, QRS-complexes detection, Real-time segmen-
tation.
Abstract:
In biometric recognition based on Electrocardiographic (ECG) signals, there are two main approaches for
feature extraction: fiducial and non-fiducial. Fiducial methods use points of interest within single heartbeat
waveforms, obtained by segmenting the ECG signal using QRS complexes as a reference. In this paper we
study several QRS detection algorithms, with the purpose of determining what is the best algorithm in the
context of finger based ECG biometrics using fiducial approaches; our main focus is the real-time segmen-
tation of ECG signals resulting on a set of single heart beats. We propose a method combining the adaptive
characteristics of the algorithm by Christov, with the strategy of the widely adopted Engelse and Zeelenberg
algorithm. Experimental results obtained for real-world data show that online approaches are competitive with
offline versions, and represent a contribution for the realization of real-time biometric recognition.
1 INTRODUCTION
Electrocardiographic (ECG) signals are a recent trend
in biometric recognition; they exhibit very appealing
characteristics, such as intrinsic liveliness detection,
and the fact that they do not depend on external phys-
ical landmarks, therefore being difficult to spoof.
There are two main approaches for ECG fea-
ture extraction: fiducial and non-fiducial. Fiducial
methods use points of interest within single heartbeat
waveforms (Biel et al., 1999; Shen et al., 2002; Is-
rael et al., 2005; Silva et al., 2007; Lourenc¸o et al.,
2011), while non-fiducial aim at extracting discrimi-
native information without localizing reference points
(Chan et al., 2008; Coutinho et al., 2010).
Fiducial approaches locate reference points based
on the detection of single heartbeat waveforms. These
are obtained by segmenting the ECG signal, and QRS
complexes are generally used as a reference due to
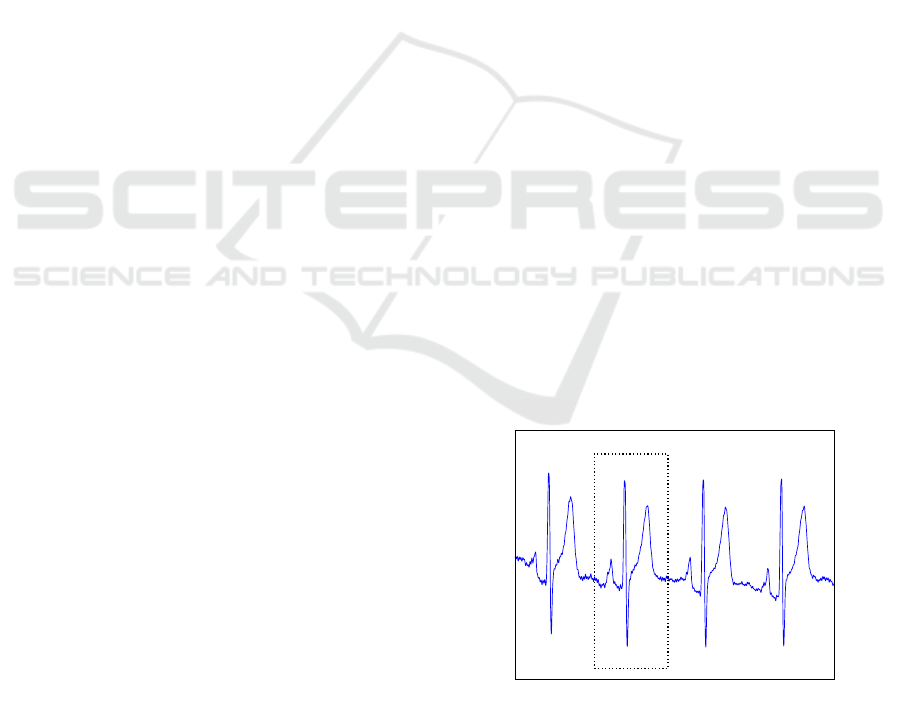
their singularity. Figure 1 shows the typical ECG sig-
nal, with QRS complexes identified. This complex
represents the depolarization and re-polarization phe-
nomenon of the ventricles.
As with other biometric traits, current research fo-
cuses on the usability and the design of more conve-
nient acquisition setups, that can be used for practical
t
m V
Q
R
S
T
P
Figure 1: ECG acquired at the chest from one patient of the
PTB-BIH (Oeff et al., ) control subjects database. The ECG
waveform is labeled with the corresponding complexes.
The P wave corresponds to the sinoatrial node triggering
impulse, the QRS complex is associated with the depolar-
ization process, and finally the T wave reflects the repolar-
ization process.
and daily applications. The acceptance of ECG based
methods requires real-time or near real-time authen-
tication/identification, which can be obtained dimin-
ishing the acquisition and processing time.
In this paper we review several QRS detection al-
gorithms, with the purpose of determining what is the
best algorithm for finger based ECG biometrics using
49
Lourenço A., Silva H., Leite P., Lourenço R. and Fred A..
REAL TIME ELECTROCARDIOGRAM SEGMENTATION FOR FINGER BASED ECG BIOMETRICS.
DOI: 10.5220/0003777300490054
In Proceedings of the International Conference on Bio-inspired Systems and Signal Processing (BIOSIGNALS-2012), pages 49-54
ISBN: 978-989-8425-89-8
Copyright
c
2012 SCITEPRESS (Science and Technology Publications, Lda.)
fiducial approaches, focusing on real-time identifica-
tion of single heart beats.
The remainder of the paper is organized as fol-
lows. In Section 2, an overview of QRS detection
algorithms is presented. In Sections 3 and 4 we pro-
vide a brief overview of representative algorithms of
offline and online QRS detection algorithms, and de-
scribe the proposed modifications for both offline and
online algorithms. Finally, in Sections 5, 6 and 7 we
outline the experimental setup, the main results and
conclusions, respectively.
2 RELATED WORK: QRS
DETECTION ALGORITHMS
The automation of electrocardiogram analysis pro-
cesses found in the Holter test and in real-time pa-
tient monitoring, led to the development of algorithms
for the detection of QRS complexes. Due to its mor-
phology (see Figure 1), it serves as basis for com-
puting the heart rate, as a reference point for cardiac
cycle classification schemes, and ECG data compres-
sion algorithms (Kohler et al., 2002). There are ap-
proaches based on signal derivatives and digital fil-
tering (Friesen et al., 1990), or more complex ap-
proaches based on artificial neural networks, genetic
algorithms, wavelet transform (for more details see
(Kohler et al., 2002)).
Using the ECG as biometric, the work in
(Lourenc¸o et al., 2011) proposes the acquisition of
this signal at finger level, through a minimally in-
trusive 1-lead ECG setup recurring to Ag/AgCl elec-
trodes without gel as interface with the skin. This type
of setup implies more noise than the traditional acqui-
sition at the chest, in particular when using multiple
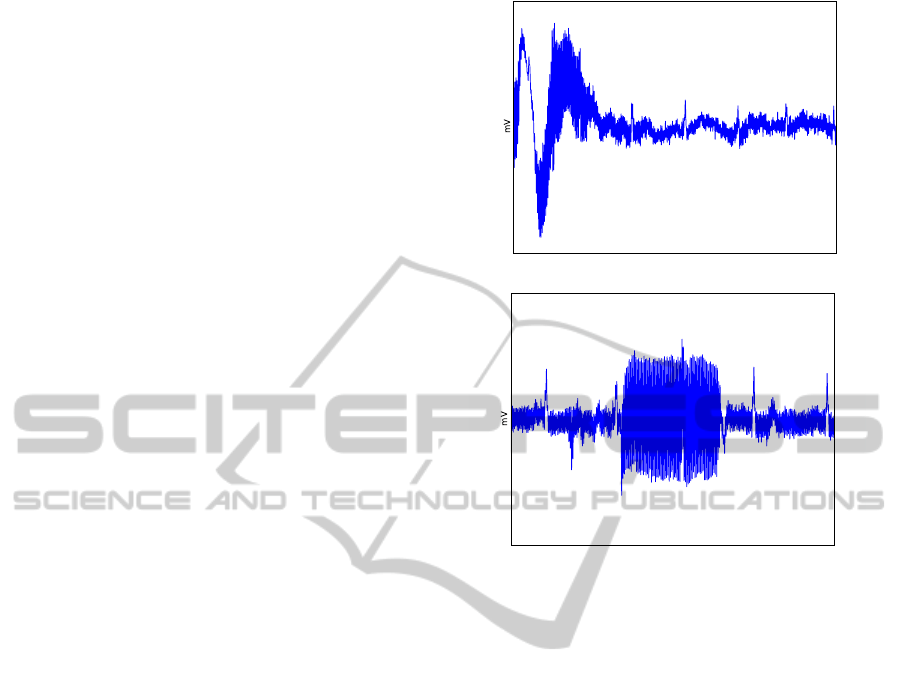
leads. Figure 2 illustrates signals collected at the fin-
gers using dry Ag/AgCl electrodes, showing common
artifacts. Figure 2(a) corresponds to the presence of
motion artifacts; in this case the amplitude of the ECG
signal is quite close to the noise amplitude; Figure
2(b) illustrates a case where signals are corrupted by
high frequency powerline noise and electromyogram
noise.
The need for robust algorithms is clear when we
compare the abovementioned signals, with traditional
ECG signals collected at the chest using conductive
gel, as depicted in Figure 1, where the noise is practi-
cally inexistent.
The development of algorithms for real time anal-
ysis of the ECG begun in the 80’s. In (Pan and Tomp-
kins, 1985), an online QRS detection algorithm was
implemented in assembly language. It consisted in
digital bandpass filtering to remove the noise, differ-
(a) Motion artifact
(b) Electrical and electromyogram interference
Figure 2: Example of finger ECG readings from two dif-
ferent subjects, collected using dry Ag/AgCl electrodes. As
we can observe, the signal quality is significantly worst than
the one obtained at the chest (see figure 1.).
entiation to obtain information about the slope of the
QRS, followed by squaring to intensify this slope and
finally a moving window integrator to produce a sig-
nal that included information about the slope and the
width of the QRS complex. This process is divided
in three phases: learning phase 1; learning phase 2;
detection. The learning phase 1 required 2s to ini-
tialize the detection thresholds. The learning phase
2 requires two heartbeats to initialize the RR-interval
average and RR-interval limit values. The detection
phase produces pulses for each QRS complex. The
thresholds and other parameters of the algorithm are
periodically adjusted, to adapt to changing character-
istics of the signal.
In (Christov, 2004), an algorithm is presented that
follows the same principles, proposing the detection
based on an adaptative threshold. over the so called
complex lead signal, y[n]. This signal is obtained
by averaging the absolute value of the differentiated
versions of all available leads. The process is initi-
ated by digitally filtering the input signal, x[n], to re-
move power-line interference and electromyographic
noise. The detection is performed by verifying when
y[n] is higher than a threshold, obtained through the
BIOSIGNALS 2012 - International Conference on Bio-inspired Systems and Signal Processing
50
window W
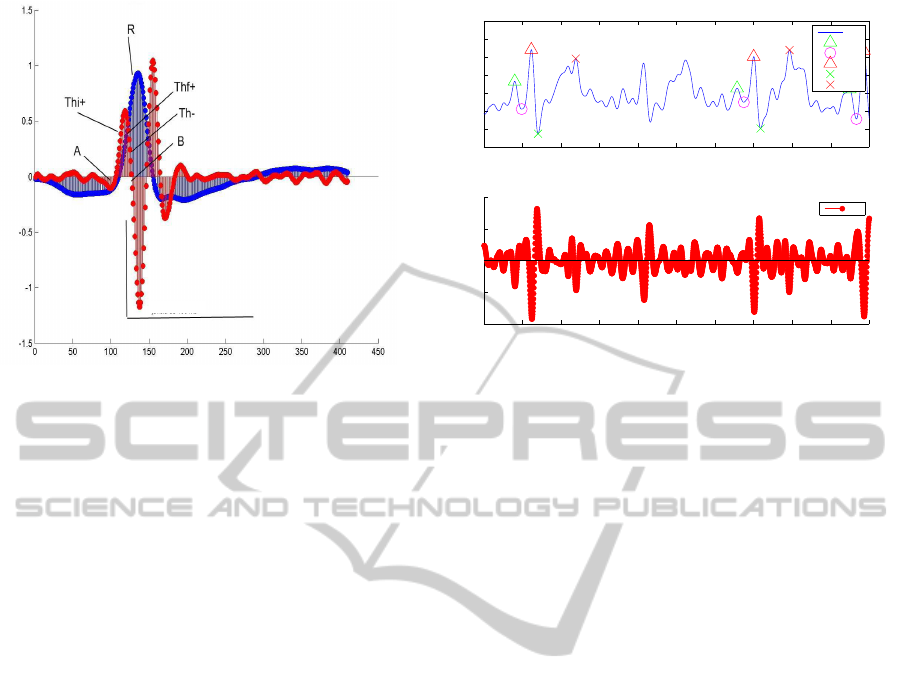
Figure 3: Adaptation of the Engelse and Zeelenberg algo-
rithm for QRS detection algorithms (Engelse and Zeelen-
berg, 1979). In blue the original signal, x[n], and in red
y
2
[n].
linear combination of three components: M (Steep-
slope threshold); F (Integrating threshold for high
frequency signal components); R (Beat expectation
threshold).
Before presenting our QRS-complex detection in
real time, we overview the state of the art in offline
QRS detection, since in previous works on ECG bio-
metric recognition, this type of algorithms was used.
3 OFFLINE QRS DETECTION
AND IMPROVEMENTS
In (Friesen et al., 1990), nine different offline QRS
detection algorithms are compared in the presence of
noise. We build on the work by (Engelse and Zee-
lenberg, 1979), since it is considered to be one of the
more robust.
The QRS detection method by Engelse and Zee-
lenberg consists of the following. A digitally filtered
version of the ECG signal, x[n], is passed through a
differentiator (Eq. 1), and then by the low pass filter
(Eq.2):
y
1
[n] = x[n] − x[n − 4], (1)
y
2
[n] =
4
∑
i=0
c
i
.y
1
[n− i], where c
i
= [1, 4,6, 4, 1] (2)
Figure 3 presents the input signal, x[n], and the
corresponding processed signal y
2
[n]. The R peak de-
tection is based on the analysis of the negative lobs of
7200 7400 7600 7800 8000 8200 8400 8600 8800 9000 9200
−0.1
−0.05
0
0.05
0.1
0.15
0.2
x[n]
DF1
P
Q
R
S
T
7200 7400 7600 7800 8000 8200 8400 8600 8800 9000 9200
−4
−2
0
2
4
y
2
[n]
y2
Figure 4: Missing R detection.
y
2
[n], and it is identified automatically, by scanning
y
2
[n] using two thresholding operations.
The detection begins by finding the interval n ∈
{n
thi+
, n
th f+
}, indicated in Figure 3, whose ampli-
tudes verify the condition: y
2
[n] > Th, with Th =
0.6max(y
2
[n]). Then, we look for a 160ms long win-
dow, W, to the right of n
th f+
, where the condition
y
2
[n] < −Th holds for a specified number of consec-
utive points (experimentally we found this number to
be at least 10 points). In (Engelse and Zeelenberg,
1979) more thresholding operations are proposed, but
we considered the described conditions enough.
Upon finding a candidate R peak, the original sig-
nal, x[n] is scanned inside the obtained windows, W,
and the peak is determined as the time instant corre-
spondig to the highest amplitude signal.
Taking as reference the identified R peak, we con-
tinue the analysis of y
2
[n] within its left and right
neighborhoods, determining the time instants were
it starts to be positive and comes down to negative
again. Within these intervals, we take the minimum
values of x[n] as the beginning of the Q and S com-
plexes, respectively.Using as reference the starting of
the Q and S complexes, we analyze x[n] finding the
maximum on their neighborhood to find the complex
Q and S.
This algorithm presents the problem of having
fixed thresholds, and if the analyzed ECG signal has
amplitude variations, its robustness is affected. As an
example, let’s consider the case presented in Figure
4, where one of the single heartbeat waveforms is not
recognized. As we can see by analyzing y
2
[n] (in red),
the negative lob is much less pronounced than in the
case of the complexes on the left and right, correctly
identified.
In order to solve this situation we tried to lower
the threshold Th, but doing so, the number of false
REAL TIME ELECTROCARDIOGRAM SEGMENTATION FOR FINGER BASED ECG BIOMETRICS
51

positives increases. To compensate for this phenom-
ena we introduce a second threshold, which enables
the identification of negative lobes comprising R-peak
time instants. Its value is obtained from the lowest
value of y
2
[n] found in the analysis, and the condition
defined as:
y
2
[n] < ThNew
ThNew = 0.7min(y
2
[n])
(3)
4 PROPOSAL FOR ONLINE QRS
DETECTION
Motivated by the offline algorithm of Engelse and
Zeelenberg, where the R complex is identified thresh-
olding two lobes of a differentiated version of x[n],
we propose to combine that strategy with adaptative
thresholds estimated along the acquisition process.
To determine this adaptive threshold we build on
the work by (Christov, 2004), using a threshold esti-
mation scheme similar to the one in (Christov and T,
2002) for the threshold M. In that work, the thresh-
old M is calculated using a temporal sliding window
of 5s. They form a buffer MM = M
1
, M
2
, M
3
, M
4
, M
5
,
consisting in the concatenation of 5 partial thresholds,
M
i
, calculated by Equation 4 in each 5s sliding win-
dow; M is obtained according to Eq. 5.
M
i
= 0.6max(y[n]), (4)
M =
M
i
during the initial 5s
1
5
∑
5
i=1
M
i
rest of acquisition
(5)
The process continuously updates the partial
thresholds, erasing the older threshold, left shifting
the intermediate thresholds and calculating a new M
5
.
This new partial threshold, M
new
5
, can become quite
high, due to premature ventricular contraction, so if
M
new
5
> 1.5M
5
, then M
new
5
= 1.1M
5
.
The algorithm doesn’t allow detections of QRS
peaks 200 ms after the last one, and the M threshold is
decreased during the interval 200 to 1200ms follow-
ing the last detection, at a low slope, until reaching
60% of its value at 1200ms. After 1200ms, M remains
unchanged until a new detection is obtained.
Notice that the R peak detection algorithm by En-
gelse and Zeelenberg can be performed in real-time,
since the computations of equations 1 and 2 only re-
quires a buffer of 4 samples. Moreover the scanning
of y
2
[n] can be performed based on a sliding window,
following the approach of Christov.
With this approach we expect to obtain better de-
cision rules for the detection of R peaks.
5 EXPERIMENTAL SETUP
To evaluate and compare the described algorithms,
we performed extensive acquisitions, collecting data
from 62 subjects (47 males and 15 females) with an
average age of 31.1±9.46 years. Subjects were only
asked to rest their left/right hands in a setup built for
this propose.
Two custom ECG sensors (Silva et al., 2011)
were used for signal acquisition, one connected to the
Ag/AgCl electrodes, and another connected to Elec-
trolycra strips placed at the index and middle finger
levels, as depicted in Figure 5. The ECG sensors add
a total gain of 1000 and analog band pass filtering be-
tween the 1-30Hz range.
Figure 5: Experimental apparatus.
To avoid ground coupling between both sen-
sors, two independent biosignalacquisition units were
used, one per sensor. Data acquisition was performed
using the commercially available bioPLUX research
system (PLUX, ), which enables Bluetooth wireless
transmission of the collected signals to the base sta-
tion. We used a sampling frequency of 1000Hz, and
12−bit resolution.
Synchronization of the acquisition units was per-
formed optically using a syncPLUX kit and a light-
dependent resistor (LDR) (PLUX, ). To one of the
systems a triggering switch was connected, which si-
multaneously activated the digital input port of the
system and a LED. To the other system, a LDR was
connected to one of the analog input channels, and
placed in direct contact the LED of the first system, in
such way that a synchronization signal was obtained
whenever the LED was lit.
This allowed us to have the data collected by each
system synchronized, without recurring to any electri-
BIOSIGNALS 2012 - International Conference on Bio-inspired Systems and Signal Processing
52
cal connection between them. Signals were acquired
during a period of approximately 2 minutes, in which
the supervisor in charge of the experimental proce-
dure would describe the experiment, goals and related
work.
6 RESULTS AND DISCUSSION
Table 1 summarizes the results of the several ap-
proaches, both for the signal acquired using the
Ag/AgCl electrodes and Electrolycras. The offline al-
gorithms of Engelse and Zeelenberg are denoted by
EG-Butter and EG-FIR; the improvement obtained
using a third threshold by EG-3; and for the online
algorithms, the Christov algorithm is denoted by Chr,
and the proposed combination by Chr+EG.
To quantify the performance of each algorithm,
we present the number of segmented waves, and the
mean and standard deviation of the percentage of the
ones considered valid, taking as population the full
data set. A segment is considered valid if the obtained
RR interval does not deviate from the mean RR inter-
val in more than 10%. The rational of this criterion
is that a deviation above this margin should be due
to segmentation errors, since acquisitions at rest and
during a short period of time have very stable RR in-
tervals.
The number of segmented heartbeat waveforms
obtained from the dry Ag/AgCl electrode signals is
higher than the ones obtained by the Electrolycra, re-
vealing that the later signals have more noise. Com-
paring the performance of the online vs offline algo-
rithms, as expressed in the table, one can observe that
offline algorithms obtain more segments than online
versions, but the percentages of valid segments are
similar.
The algorithm that exhibits better performance is
the Engelse and Zeelenberg, both using Butterworth
filters - EG-Butter, or using Fir filters - EG-FIR. Re-
garding the online algorithms, the original algorithm
of Christov - Chr, is the one that presents higher
number of segments. Our approach that combines
the adaptative threshold with the Engelse and Zeelen-
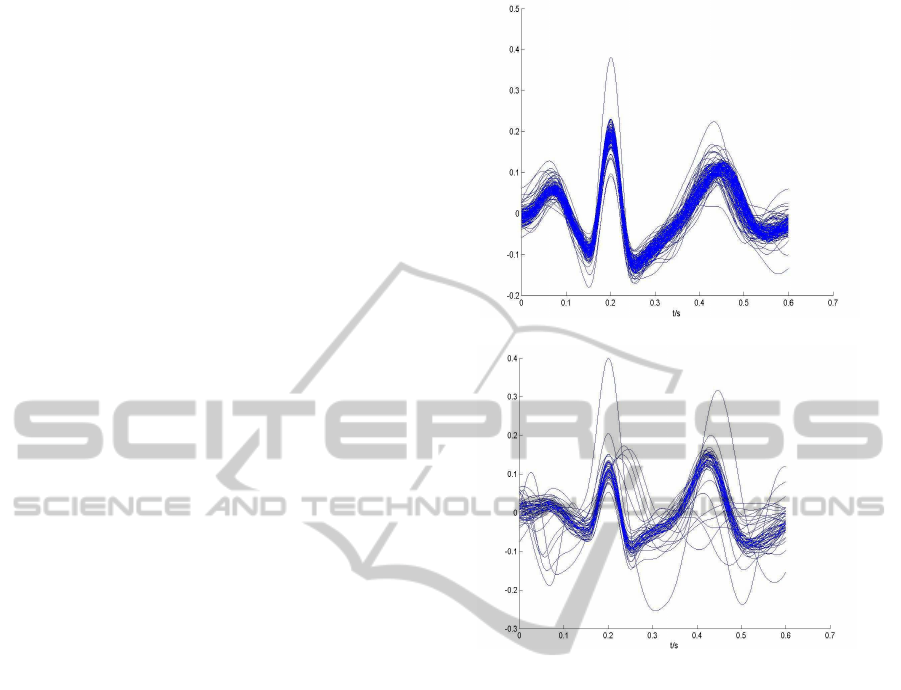
berg is slighty worst. Figure 6 presents an example
these segmentations,with the single heartbeats super-
imposed and aligned according to the R peak. One
can see than even highly noisy single heartbeats are
being correctly segmented.
7 CONCLUSIONS
In this work we studied the segmentation of ECG
(a) Segmentation 1
(b) Segmentation 2
Figure 6: Example of segmentation of finger ECG readings
from two different subjects.
signals acquired at the fingers using QRS-complex
detection algorithms. This type of process is of
paramount importance in the fiducial based algo-
rithms, since they require reference points to be cor-
rectly located on single hearbeat waveforms.
We focused an algorithm for offline ECG segmen-
tation by adaptation of the Engelse and Zeelenberg
algorithm, and the Christov algorithm for online ECG
segmentation. The online approaches have shown to
be competitive with offline versions, but their perfor-
mance is slightly worst. On the ECG biometric point
of view, these algorithms represent a contribution for
performing real-time biometric recognition.
As future work we intent to use a benchmark an-
notated ECG dataset to corroborate these conclusions.
ACKNOWLEDGEMENTS
This work was partially funded by Fundac¸˜ao para a
Ciˆencia e Tecnologia (FCT) under grants SFRH/BD/
REAL TIME ELECTROCARDIOGRAM SEGMENTATION FOR FINGER BASED ECG BIOMETRICS
53

Table 1: Experimental results for ECG Segmentation.
Type of Electrodes Type of Processing Algorithm #segments %valid - mean %valid - std
Ag/AgCl
Offline
EG-Butter 7614 96.5 6.6
EG-FIR 7322 97.9 4.3
EG-Butter-3 7625 96.4 6.7
EG-FIR-3 7719 97.8 4.6
Online
Chr 6482 94.5 12.5
Chr+EG 5971 92.4 10.4
Electrolycra
Offline
EG-Butter 6692 94.0 11.4
EG-FIR 6244 93.4 11.6
EG-Butter-3 6712 93.9 11.4
EG-FIR-3 6545 94.2 10.5
Online
Chr 5550 90.8 15.7
Chr+EG 5044 84.5 18.5
65248/2009 and SFRH/PROTEC/49512/2009, and by
the Departamento de Engenharia de Electr´onica e
Telecomunicac¸˜oes e de Computadores - ISEL, whose
support the authors gratefully acknowledge.
REFERENCES
Biel, L., Pettersson, O., Philipson, L., and Wide, P. (1999).
Ecg analysis: a new approach in human identification.
In Proceedings of the 16th IEEE Instrumentation and
Measurement Technology Conference, IMTC/99., vol-
ume 1, pages 557 –561 vol.1.
Chan, A., Hamdy, M., Badre, A., and Badee, V. (2008).
Wavelet distance measure for person identification us-
ing electrocardiograms. IEEE Transactions on Instru-
mentation and Measurement, pages 248–253.
Christov, I. I. (2004). Real time electrocardiogram QRS
detection using combined adaptive threshold. Biomed
Eng Online, 3(1).
Christov, I. I. and T, S. (2002). Steep slope method for real
time qrs detection. Electrotechniques and Electronics,
pages 13 –17.
Coutinho, D. P., Fred, A., and Figueiredo, M. (2010). Per-
sonal identification and authentication based on one-
lead ECG using ziv-merhav cross parsing. In Proc.
Int. Workshop PRIS’2010, pages 15–24.
Engelse, W. and Zeelenberg, C. (1979). A single scan algo-
rithm for QRS detection and feature extraction. IEEE
Comp in Card, pages 37–42.
Friesen, G., Jannett, T., Yates, M. J. S., Quint, S., and Nagle,
H. (1990). A comparison of the noise sensitivity of
nine QRS detection algorithms. IEEE Transactions
on Biomedical Engineering, 37(1):85 –98.
Israel, S. A., Irvine, J. M., Cheng, A., Wiederhold, M. D.,
and Wiederhold, B. K. (2005). ECG to identify indi-
viduals. Pattern Recogn., 38:133–142.
Kohler, B. U., Hennig, C., and Orglmeister, R. (2002). The
principles of software QRS detection. Engineering in
Medicine and Biology Magazine, IEEE, 21(1):42–57.
Lourenc¸o, A., Silva, H., and Fred, A. (2011). Unveiling
the biometric potential of Finger-Based ECG signals.
Computational Intelligence and Neuroscience, 2011.
Oeff, M., Koch, H., Bousseljot, R., and Kreiseler, D. The
PTB diagnostic ECG database. National Metrology
Institute of Germany.
Pan, J. and Tompkins, W. J. (1985). A real-time qrs detec-
tion algorithm. Biomedical Engineering, IEEE Trans-
actions on, BME-32(3):230 –236.
PLUX. bioPLUX research. http://www.plux.info.
Shen, T., Tompkins, W., and Hu, Y. (2002). One-lead QRS
for identity verification. In Proceedings of the Second
Joint EMBS/BMES Conference, pages 62–63.
Silva, H., Gamboa, H., and Fred, A. (2007). One lead
ECG based personal identification with feature sub-
space ensembles. In 5th International Conference on
Machine Learning and Data Mining, pages 770–783.
Silva, H., Lourenc¸o, A., Lourenc¸o, R., Leite, P., Coutinho,
D., and Fred, A. (2011). Study and evaluation of a sin-
gle differential sensor design based on electro-textile
electrodes for ECG biometrics applications. In Proc
IEEE Sensors, Limerick, Ireland.
BIOSIGNALS 2012 - International Conference on Bio-inspired Systems and Signal Processing
54
