
A STATISTICAL APPROACH TO BUILD 3D PROTOTYPES FROM A
3D ANTHROPOMETRIC SURVEY OF THE SPANISH FEMALE
POPULATION
M.V. Ib´a˜nez
1
, A. Sim´o
1
, J. Domingo
2
, E. Dur´a
2
, G. Ayala
3
, S. Alemany
4
, G. Vinu´e
3
and C. Solves
4
1
Department of Mathematics, Universitat Jaume I, Castell´on, Spain
2
Dept. of Informatics, University of Valencia, Valencia, Spain
3
Department of Statistics and O.R., University of Valencia, Valencia, Spain
4
Biomechanics Institute of Valencia, Universidad Polit´ecnica de Valencia, Valencia, Spain
Keywords:
Random compact sets, 3D-shape, Mean sets.
Abstract:
Fitting cloth is a problem for both the customer and the apparel industry, but analysis of anthropometric data
can be useful to define better sizing systems. In 2006, the Spanish Ministry of Health coordinated a study
to obtain 3D anthropometric data of the Spanish women. Our aim in this work is to develop a statistical
methodology to define prototypes based on the 3D clouds of points obtained from 3D scans of a great number
of women and apply it to the 3D anthropometric survey of the Spanish female population. To build the
prototypes, 3D images will be built, and after registration, homologous 2D sections will be averaged, and a
3D ”mean” shape will be reconstructed from them.
1 INTRODUCTION
In 2006, the Spanish Ministry of Health coordinated
a study to obtain anthropometric data of the Spanish
women. Its aim was to provide real and consistent
measures to apparel designers in order to normalize
the sizing system. The final purpose is to increase the
protection of consumers and to help in the treatment
of alimentary mental disorders.
A sizing system classifies a specific population
into homogeneous subgroups based on some corporal
dimensions (Chunga et al., 2007). There are several
local and international standards proposing a regula-
tion of the sizing system based on key anthropomet-
ric measures, but the lack of common criteria is one of
the drawbacksfor their implementation. Most of them
propose size systems by taking into account just a sin-
gle anthropometric dimension, although more elabo-
rated systems use distributions of two or three vari-
ables to define a sizing chart and cross-tabs to select
the size system covering the highest percentage of the
population. Anyway, anthropometric measures show
a great variability on body proportions, and it is not
possible to cover all the different body morphotypes
with this kind of models. That is why, multivariate
approaches have been proposed to develop sizing sys-
tems. Principal components analysis are often used
to reduce the dimension of our anthropometric data
set, and the two first principal components are used
to generate bivariate distributions (Chen et al., 2009;
Hsu, 2009; Luximon et al., 2011; Gupta and Gangad-
har, 2004; Hsu, 2009; Salusso-Deonier et al., 1986).
As an alternative to bivariate distributions, the cluster
techniques using partitioning methods like k-means
algorithms, group the population into morphologies
using the complete set of anthropometric variables as
input (Chunga et al., 2007; Zheng et al., 2007; Ng,
R. and Ashdown, S.P. and Chan, A., 2007). A large
scale implantation of this statistical approach using
data mining and decision trees, has been proposed in
Hsu and Bagherzadeh et al. (Hsu and Wang, 2005;
Bagherzadeh et al., 2010). Different alternative ap-
proaches based on optimization algorithms were first
proposed by Tryfos (Tryfos, 1986), who used integer
programming to partition the body dimension space
into a discrete set of sizes by choosing the size sys-
tem to optimize the sales of garment. Later on, Mc-
Culloch et al (McCulloch et al., 1998) modified this
approach by focusing the problem on the quality of fit
instead of on the sales.
Since fitting cloth is a problem for both the cus-
tomer and the apparel industry (Fan et al., 2004), na-
370
Ibañez M., Simó A., Domingo J., Durá E., Ayala G., Alemany S., Vinué G. and Solves C..
A STATISTICAL APPROACH TO BUILD 3D PROTOTYPES FROM A 3D ANTHROPOMETRIC SURVEY OF THE SPANISH FEMALE POPULATION.
DOI: 10.5220/0003876803700374
In Proceedings of the 1st International Conference on Pattern Recognition Applications and Methods (SADM-2012), pages 370-374
ISBN: 978-989-8425-98-0
Copyright
c
2012 SCITEPRESS (Science and Technology Publications, Lda.)

tional anthropometric surveys have been carried out
in the latest years in different countries (USA, UK,
France, Australia and Germany among others). These
studies show that a high percentage of population has
fitting problems with the cloth. Studies developed in
the UK (Smith, 2007) and Germany (Chunga et al.,
2007) show that 60% and 50% respectively of cus-
tomers manifest to have difficulty in finding clothes
that fit them properly. In the same way, an anthropo-
metric study done in USA (Faust and Carrier, 2010)
to update the sizing ASTM standards also concluded
that 54% of the population was not satisfied with the
fitting of the ready to wear (RTW) cloth (Bye et al.,
2008). Additionally, from the technological point of
view, new 3D body scanning techniques constitute a
step forward in the way of conducting and analyzing
anthropometric data and can contribute to promote
new anthropometric surveys to obtain more accurate
measurements (Simmons and C.Istook, 2003).
In this paper we propose a statistical methodol-
ogy to define prototypes based on the 3D cloud of
points obtained from 3D scans of the body of a suffi-
cient number of women and then we apply it to the 3D
anthropometric survey of the Spanish female popula-
tion. Another work who have been working following
this idea can be found in (Haslera et al., 2009).
From the 3D cloud of points of each woman, a 3D
image of a 3D shape can be built. After registration
of these 3D images, a fixed number of 2D cross sec-
tions can be obtained for each woman. Each of these
sections coincides with an anatomically relevantpoint
detected in each shape. Each set of corresponding
sections for all women can be considered as a sample
of a Random compact closed set whose mean set can
be computed. A random closed set is a popular prob-
abilistic model for shapes with a growing interest in
the Computer Science and in particular in the Com-
puter Vision literature. Its formal definition jointly
with many examples of this concept can be found in
(Stoyan et al., 1995; Matheron, 1975; Cressie, 1993).
Different definitions of the mean set of a randomcom-
pact set can also be found in the literature (Stoyan and
Stoyan, 1994; Baddeley and Molchanov, 1998; Sim´o
et al., 2004). In this paper the Baddeley-Molchanov
definition of mean set will be used. Finally, each pro-
totype will be obtained as the 3D-reconstruction of a
complete body using these cross section means.
The description of our data set and is given in
section 2.1. The computational details to obtain and
process the images and the definition of Baddeley-
Molchanov mean are explained in section 2.2. Sec-
tion 3 illustrates the results of the application of
our methodologies to the anthropometric database of
Spanish women. Some conclusions and possible fur-
ther developments conclude the paper in section 4.
2 MATERIALS AND METHODS
2.1 Data Set
A sample of 10415 Spanish females from 18 to 70
years old were randomly selected. They were scanned
by using the Vitus Smart 3D body scanner from Hu-
man Solutions, a non-intrusive laser system formed
by four columns allocating the optic system, which
moves from the head to the feet in about ten seconds
performing a sweep of the body. Several cameras cap-
ture images and associated software provided by the
scanner manufacturers, makes a triangulation that al-
lows the knowledge of the 3D spatial location of a
great amount of points on the body surface. These
points are grouped in triangles forming a mesh which
is stored as a file in Stereo-Lithography format (.stl).
Standard white garments were used to harmo-
nize the measurements, and seven small wooden half-
spheres were attached to the body surface on anatom-
ically relevant points. One of them was fixed on the
third neck vertebra, two more over the left and right
clavicles, a couple of them on the low waist and high
waist in the right side, and the corresponding pair on
the left side. These marks were automatically de-
tected by the software from the mesh of points, and
their coordinates are stored in a separated file in .xml
format.
2.2 Methodology
As a first step, a 3D binary image is produced from
the collection of points located on the surface of each
woman scanned. Running through the vertical axis of
the body (z-axis), the image is divided into thin slices.
The points that belong to each slice are enclosed by
their convex hull (Rosenfeld and Kak, 1982) which is
then filled.
Some special cases must be taken into account:
when a horizontal plane cuts not only the trunk but
also the arms we would wish not a convexhull enclos-
ing the three shapes but one for each of them. This
is tackled by imposing limits to the point coordinates
which are considered: only those into a parallelepiped
(box) limited by certain proportions of body height
and width are considered. Using proportions assures
us that this limitation is valid for all individuals, since
the box does not need to be too tight to separate ap-
propriately the arms from the main body.
This method does not provides a global 3D con-
vex hull, neither a prefect fit because human body
A STATISTICAL APPROACH TO BUILD 3D PROTOTYPES FROM A 3D ANTHROPOMETRIC SURVEY OF THE
SPANISH FEMALE POPULATION
371

sections are not always convex. Nevertheless, more
accurate methods to reconstruct the shape would have
need many ad-hoc adjustments and would have been
too prone to error with a so wide spectrum of cases.
We think that approximationby height-section convex
hull is enough for the purpose of this work.
Once the 3D matrix of voxels is available, each
shape is rotated to place the origin of coordinates at
the center of mass of each shape and to make its prin-
cipal inertia axis coincide with the canonical axis of
coordinates. Volumes are supposed to be homoge-
neous and the inertia matrix is calculated and diag-
onalized. The diagonalizing change of basis is taken
as the 3D rotation to be applied to each voxel of the
shape. Also, the minimal enclosing parallelepiped
whose faces are parallel to the coordinate planes (en-
closing box) is calculated after the rotation. This will
be used to know the minimal box that encloses all the
shapes which in turn will be used to dimension the
matrix to hold the result of the mean shape.
The last step in our data ”preprocessing” is to
obtain the 2D cross sections of each 3D aligned
shape. Six anatomical fixed points are identified on
the women’s body surface and a pre-stated number of
2D cross sections are extracted between each pair of
them for all women.
The different cross sections will be considered as
realizations of random compact sets (Stoyan et al.,
1995; Matheron, 1975; Cressie, 1993). So we will
have a random compact set corresponding to each
level, and the sample mean of these cross sections
will give us a natural way to define each prototype.
The 3D reconstruction of these 2D means would lead
us to obtain the desired prototype.
Different definitions of the mean set of a ran-
dom compact set can be found in the literature, the
most important ones being the Aumann mean (Stoyan
and Stoyan, 1994), the Vorob’ev mean (Stoyan and
Stoyan, 1994) and the Baddeley-Molchanov mean
(Baddeley and Molchanov, 1998), with the Baddeley-
Molchanov mean being the most flexible one. A brief
review of the Baddeley-Molchanovdefinition of mean
set is given below.
Let Φ be a random compact set on ℜ
2
. Let F
′
be the space of non-empty closed sets with hit-miss
topology (see (Matheron, 1975)) and let d : ℜ
2
×
F
′
→ ℜ be a generalized distance function i.e. a
lower semi-continuous function with respect to the
first argument and measurable with respect to the sec-
ond argument in such a way that the two following re-
quirements are fulfilled: (i) If F
1
⊂ F
2
then d(x, F
1
) ≥
d(x, F
2
) for all x in ℜ
2
, and (ii) F = {x : d(x, F) ≤ 0}.
Let m be a metric (or pseudo-metric) on the fam-
ily of distance functions and let m
W
be the restric-
tion of m to W (a certain compact set, here a win-
dow). Suppose that d(x, Φ) is integrable for all x
and we define the mean distance function d
∗
(x) =
Ed(x, Φ). Let Φ(ε) = {x ∈ W : d
∗
(x) ≤ ε} with ε ∈ ℜ
and let ε
∗
= argmin
ε
m
W
(Φ(ε),d
∗
). The Baddeley-
Molchanov mean of Φ, E
bm
Φ, is the set Φ(ε
∗
).
Let Φ
i
with i = 1, . . ., n be a random sample of the
random set Φ, i.e. a collection of independent and
identically distributed (as Φ) random sets. The esti-
mation of E
bm
Φ results from the empirical distance
average defined as
ˆ
d
∗
(x) =
1
n
n
∑
i=1
d(x, Φ
i
). (1)
In our case we have m samples of m random sets
Φ
j
j = 1, . . . , m, corresponding to each cross section
of the body of the woman, and the procedure to com-
pute the m sample mean sets E
bm
Φ
j
, j = 1, . . . , m
would be very complex and would require a lot of
computation.
Alternatively, Lewis et al. in (Lewis et al., 1999)
propose a different empirical approximation to the
Baddeley-Molchanov mean set. They suggest to use
another ”discrepancy criteria” when choosing the op-
timal threshold, namely the ε
∗
that minimizes
1
n
n
∑
i=1
kA(Φ
i
) − A(
¯
Φ(ε))k,
where A(Φ) denotes the area of Φ. The optimal
threshold ε
∗
is then the value that makes more sim-
ilar the area of
¯
Φ(ε
∗
) to the average of the areas. This
value can be easily determined from the histogram of
¯
d. They call this procedure area-matching. This is the
one we use for our application.
As mentioned previously, one of the main advan-
tages of the Baddeley-Molchanov mean is that it de-
pends on the chosen distance function, d. Thus we
can get different kinds of mean sets using the most ap-
propriate distance function for each application. Bad-
deley and Molchanov give a list of examples with dif-
ferent distance functions. In our application we use
the Euclidean distance function defined as:
d(x, Φ) = inf{ρ(x, y), y ∈ Φ},
where ρ denotes the Euclidean distance in ℜ
2
. It is
used because it is the simplest and most natural in our
context.
3 RESULTS
Our main aim is to show a methodology to get proto-
types for the different sizes, so, as an illustration, we
ICPRAM 2012 - International Conference on Pattern Recognition Applications and Methods
372
have segmented our data set in different groups, get-
ting a prototype for each of them. Pregnant women,
those who are breast feeding at the time, who have
undergone any type of cosmetic surgery (breast aug-
mentation, liposuction, breast reduction, etc), who are
younger of 20 or older than 65 , are deleted from the
data set for this study. According with the European
regulation, the European sizing system is built by tak-
ing into account girth and height measurement ranges.
So nine sizes are usually defined for the bust measure-
ment and another nine sizes for the height (Table 1).
Table 1: Standard size coding according with the bust and
height dimensions (in cm).
Code 1 2 3
Bust [74-82) [82-90) [90-98)
Height [154-158) [158 - 162) [162 - 166)
Code 4 5 6
Bust [98-106) [106-118) [118-131)
Height [166 - 170) [170 - 174) [174 - 178)
Code 7 8 9
Bust [131-143) [143-155) [155-167)
Height [178 - 182) [182 - 186) [186-190)
Instead of segmenting the population according
with the 81 possible combinations of these bust and
height codes, we segment the population in a lower
quantity of groups, maintaining the nine groups for
the bust measurement, by defining just three height
groups (Table2)
Table 2: Height groups (in cm).
Code 1 2 3
Height <162 [162 - 174) ≥ 174
As bust and height are the corporal dimensions
used to segment the population, in order to get ac-
curate prototypes, instead of working with the whole
body, a region of interest comprising the trunk of the
women, is isolated for our study, and prototypes will
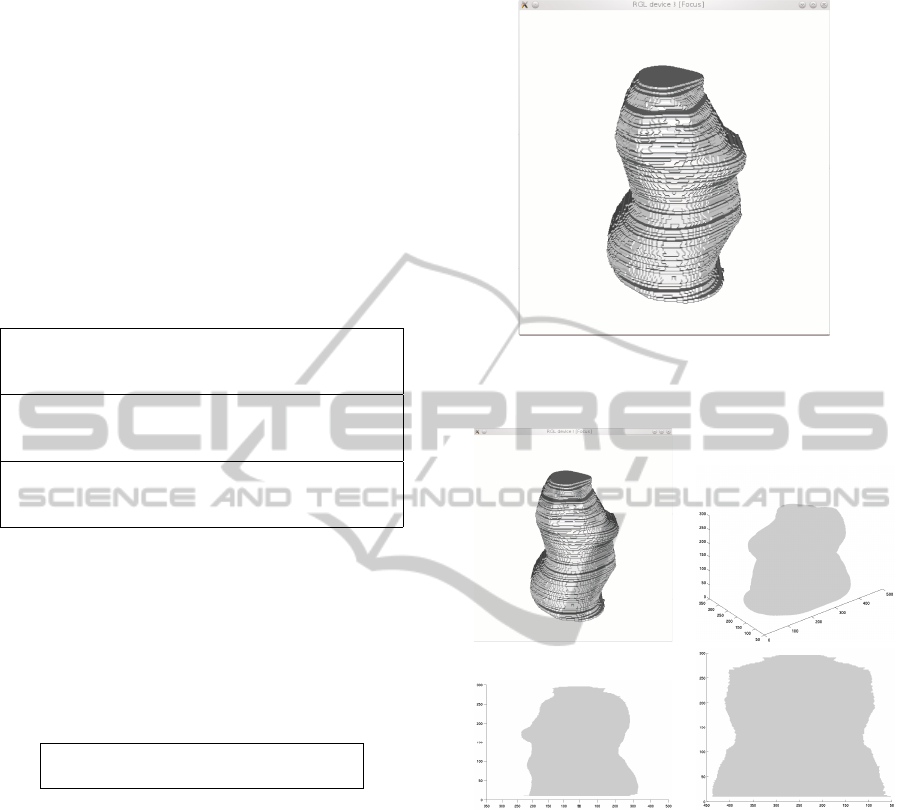
be built to fit this region. Fig 1 shows, as an exam-
ple the prototype built for those women whose bust
ranges between 74 and 82 cm, and whose height is
under 162 cm. In fig 2 different views of the same
prototype are also shown.
4 CONCLUSIONS
A new statistical methodology has been developed to
build prototypes from 3D anthropometric data. From
a 3D cloud of points, a 3D image of a 3D shape has
been built and registered to get homogeneous vol-
umes. Once a group of women sharing similar anthro-
Figure 1: Prototype for the segment of women with a bust
measurement ranging between 74 and 82 cm, and whose
height is under 162 cm.
Figure 2: Different views of a prototype.
pometric measurements is selected, their 3D ”mean
shape” is a valuable information for apparel industry.
Our contribution in this work has been to build this 3D
”mean shape”. From 2D cross sections of these 3D
aligned shapes, we have computed the sample (Bad-
deley - Molchanov) mean of each homological sec-
tion. The 3D reconstruction of these 2D means allows
us to obtain the desired prototype. In our opinion, to
average the 2D homologous sections has allowed us
to build prototypes that reproduce in a quite accurate
way the shape (and proportions)of the woman’s body.
Our aim for future works is to work directly with the
3D volumes to obtain 3D ”mean shapes”.
A STATISTICAL APPROACH TO BUILD 3D PROTOTYPES FROM A 3D ANTHROPOMETRIC SURVEY OF THE
SPANISH FEMALE POPULATION
373

ACKNOWLEDGEMENTS
This paper has been partially supported by grants GV/
2011/004, DPI2008-06691, TIN2009-14392-C02-01
and TIN2009-14392-C02-02. We would like also
to thank the Biomechanics Institute of Valencia for
providing us the data set, and to the ”Ministerio de
Sanidad y Consumo” for having promoted and co-
ordinated the ”Anthropometric Study of the Female
Population in Spain”.
REFERENCES
Baddeley, A. and Molchanov, I. (1998). Averaging of ran-
dom sets based on their distance functions. Journal of
Mathematical Imaging and Vision, 8:79–92.
Bagherzadeh, R., Latifi, M., and Faramarzi, A. (2010). Em-
ploying a three-stage data mining procedure to de-
velop sizing system. World Applied Sciences Journal,
8(8):923–929.
Bye, E., LaBat, K., McKinney, E., and Kim, D.-E. (2008).
Optimized pattern grading. International Journal of
Clothing Science and Technology, 20(2):79–92.
Chen, Y., Zeng, X., Happiette, M., Bruniaux, P., Ngb, R.,
and Yu, W. (2009). Optimisation of garment de-
sign using fuzzy logic and sensory evaluation tech-
niques. Engineering Applications of Artificial Intel-
ligence, 22:272–282.
Chunga, M., Lina, H., and Wang, M. (2007). The develop-
ment of sizing systems for taiwanese elementary- and
high-school students. International Journal of Indus-
trial Ergonomics, 37:707–716.
Cressie, N. (1993). Statistics for spatial data. Wiley Se-
ries in Probability and Mathematical Statistics. (pages
753-775).
Fan, J., Yu, W., and Hunter, L. (2004). Clothing apperance
and fitt. Science and technology. Woodhead Publish-
ing in Textiles.
Faust, M.-E. and Carrier, S. (2010). Women’s wear sizing:
a new labelling system. Journal of Fashion Marketing
and Management, 14(1):88–126.
Gupta, D. and Gangadhar, B. (2004). A statistical model
for developing body size charts for garments. Inter-
national Journal of Clothing Science and Technology,
16(5):458–469.
Haslera, N., Stolla, C., Rosenhahnb, B., Thormhlena, T.,
and Seidela, H. (2009). Estimating body shape of
dressed humans. Computers & Graphics. IEEE In-
ternational Conference on Shape Modelling and Ap-
plications 2009, 33:211–216.
Hsu, C.-H. (2009). Developing accurate industrial stan-
dards to facilitate production in apparel manufactur-
ing based on anthropometric data. Human Factors and
Ergonomics in Manufacturing, 19(3):199–211.
Hsu, C.-H. and Wang, M.-J. J. (2005). Using decision tree-
based data mining to establish a sizing system for the
manufacture of garments. The International Journal
of Advanced Manufacturing Technology, 26:669–674.
Lewis, T., Owens, R., and Baddeley, A. (1999). Averaging
feature maps. Pattern Recognition, 32:1615–1630.
Luximon, A., Zhang, Y., Luximon, Y., and Xiao, M. (2011).
Sizing and grading for wearable products. Computer-
Aided Design.
Matheron, G. (1975). Random Sets and Integral Geometry.
J. Wiley & Sons, New York. (pages 54-155).
McCulloch, C., Paal, B., and Ashdown, S. (1998). An op-
timization approach to apparel sizing. Journal of the
Operational Research Society, 49:492–499.
Ng, R. and Ashdown, S.P. and Chan, A. (2007). Intelligent
size table generation. Proceedings of the Asian Tex-
tile Conference (ATC), 9th Asian Textile Conference,
Taiwan.
Rosenfeld, A. and Kak, A. (1982). Digital Picture Process-
ing. Academic Press, Inc., Second Edition.
Salusso-Deonier, C., DeLong, M., Martin, F., and Krohn,
K. (1985-1986). A multivariate method of classifying
body form variation for women’s apparel. Clothing
and Textiles Research Journal, 4(1):38–45.
Simmons, K. and C.Istook (2003). Body measurement tech-
niques: Comparing 3d body-scanning and anthropo-
metric methods for apparel applications. Journal of
Fashion Marketing and Management, 7.
Sim´o, A., de Ves, E., and Ayala, G. (2004). Resuming
shapes with applications. Journal of Mathematical
Imaging and Vision, 20:209–222.
Smith, D. C. (2007). Process, fit and appearance analysis of
three-dimensional to two-dimensional automatic pat-
tern unwrapping technology. Thesis submitted to the
Graduate Faculty of North Carolina State University.
Stoyan, D., Kendall, W., and Mecke, J. (1995). Stochastic
Geometry and its applications. Chichester John Wiley
& Sons, Second Edition. (pages 65-95).
Stoyan, D. and Stoyan, H. (1994). Fractals, Random Shapes
and Point Fields. Methods of Geometrical Statistics.
Wiley.
Tryfos, P. (1986). An integer programming approach to the
apparel sizing problem. The Journal of the Opera-
tional Research Society, 37(10):1001–1006.
Zheng, R., Yu, W., and Fan, J. (2007). Development of
a new chinese bra sizing system based on breast an-
thropometric measurements. International Journal of
Industrial Ergonomics, 37:697–705.
ICPRAM 2012 - International Conference on Pattern Recognition Applications and Methods
374
