
Size Measures for Large Web Service Systems
Teh Phoey Lee
1
and Geoffrey Muchiri Muketha
2
1
School of Information Technology, Faculty of Business and Information Science,
UCSI University, Kuala Lumpur, Malaysia
2
Department of Computer Science, Masinde Muliro University of Science and Technology, Kakamega, Kenya
Keywords: Business Processes, Size Measures, Web Service Systems, Theoretical Validation.
Abstract: Web service systems grow larger with age whenever organizations add new services to existing systems. As
is the case with other types of software, very large Web service systems are difficult to understand and
maintain and are therefore undesirable. A couple of measures have been proposed in literature that can be
used to analyze the size attribute of Web service systems with the goal of aiding designers and managers in
the management of such software. However, these measures target only simple to medium-sized services,
and are not effective for very large cross-enterprise services. In this paper, we propose some size measures
for evaluating the size of Web service systems irrespective of their granularity, thereby providing useful
information to business process managers. We have validated the measures theoretically using Briand’s
measurement framework.
1 INTRODUCTION
Web service systems are an important tool that
enables interoperability between today’s Web-based
organizations that need to conduct business
transactions with their partners across different
platforms. Several Web services composition
languages have been proposed such as the popular
Business Process Execution Language (BPEL)
(Modafferi and Conforti, 2006;
Zheng et al., 2007).
BPEL is built on top of the Web Services
Description Language (WSDL) and therefore, all
BPEL processes are also implemented as services
(Michelson, 2005). The research work presented in
this paper is applicable to all orchestration-based
Web service systems such as those implemented
with BPEL language.
Due to Web services composition routines where
new services are added each time new functionality
is needed, the resulting systems can grow very large
with age (Cardoso, 2008). Many researchers agree
that very large systems are difficult to understand
and to maintain (Cardoso, 2008; Munoz et al., 2010;
Rolon et al., 2008). Furthermore, existing language
technologies such as BPEL are ill equipped to
manage very large Web service systems due to their
lack of flexibility and lack of strong modularity
features (Charfi and Mezini, 2004). Managers of
Web service systems created with such languages
are therefore very much concerned about their
quality.
In an effort to address the above issues, several
authors have proposed a measurement-based
solution. Software measures provide managers with
information on potentially risky systems, which in
turn helps them to make a decision on what to do
with such systems. Some of the size measures that
have been proposed either in the Web services or
business process area include the number of
activities (NOA) (Cardoso et al., 2006; Gruhn and
Laue, 2006), number of basic activities (NOBA) and
number of structured activities (NOSA) (Muketha et
al., 2010), and number of nodes in a graph
(Mendling and Neumann, 2007). While these
measures are good for evaluating simple to medium-
sized services that are atomic in nature, they are
inadequate for measuring Web service systems that
span across several enterprises and that consist of
several interacting atomic services. There is a need
for scalable size measures that can measure the size
of Web service systems irrespective of their
granularity.
In this paper, we propose a size measure for large
Web service systems. The measure implements a
simple approach where low level services (simple
services) are measured first, and then a summation
of their separate values is computed as the size of
453
Phoey Lee T. and Muketha G..
Size Measures for Large Web Service Systems.
DOI: 10.5220/0003948804530458
In Proceedings of the 7th International Conference on Software Paradigm Trends (ICSOFT-2012), pages 453-458
ISBN: 978-989-8565-19-8
Copyright
c
2012 SCITEPRESS (Science and Technology Publications, Lda.)

medium level services. The high level measure is
computed in a like manner i.e. as a summation of all
the values of the services at lower levels. The
proposed measure has been validated theoretically
using Briand’s generic measurement framework
(Briand et al., 1996) and the results are presented.
The rest of this paper is organized as follows.
Section 2 presents related work, Section 3 describes
Web service systems, Section 4 presents the
proposed measures, Section 5 presents results, and
Section 6 presents the conclusions.
2 RELATED WORK
A couple of size measures have been proposed that
can be used for Web services systems.
Cardoso et al. (2006) and Gruhn and Laue (2006)
have separately proposed the number of activities
(NOA) measure as a business process equivalent of
the lines of code size metric for software. Other
similar measures proposed by Cardoso et al. (2006)
include the number of activities and control-flows
and the number of activities, joins and splits.
In (Muketha et al., 2010), two size measures for
business processes called number of basic activities
(NOBA) and number of structured activities
(NOSA) are also proposed.
Another related size measure that is relevant to
Web service systems such as number of services
(NS) may also be found in (Rud et al., 2006) and
(Zhang and Li, 2009).
The NS can be useful in choreography-based
systems, but may be inadequate where orchestration-
based systems are involved. Other measures
mentioned in this section are limited in that they
target only simple to medium-sized atomic services,
but not large Web service systems.
3 WEB SERVICE SYSTEMS
Web service systems grow naturally out of a need by
organizations to add more functionality to existing
systems. Two main architectures for building Web
service systems are orchestration and choreography.
In both cases, several related services are composed
into a larger system.
Choreography refers to the conversations
between the various Web services in a peer-to-peer
style while orchestration refers to one service being
designated as the controlling service. Orchestration
is an environment where a controlling service
invokes all other services needed in order to execute
a business function for a specified customer. A
detailed discussion on these two architectures can be
found in the work of Daniel and Pernici (2006).
According to Cardoso (2008), Web services are
simple applications performing one function.
However, this definition is insufficient to shed light
on exactly what a Web service is or even what its
capabilities are. Several types of services have been
identified based on their functionality. For instance,
Michelson (1995) states that services may take the
form of request/reply, worker, agent, aggregator, or
a process. Table 1 describes these types of services
that may be found in a typical orchestration-based
Web services system.
Table 1: Types of services found in an orchestration-based
Web services system.
Service
Description
Request/reply
Retrieves information (but may also
modify the information) before
forwarding the result to the requestor
Worker
Performs specific function (e.g.
calculation)
Monitor
Observes something and then gives a
report on its findings based on some
monitoring rules
Agent
Similar to a monitor (i.e. observes
something based on some monitoring
rules). In addition, it
acts on its
findings.
Intermediary
Intercepts a service a message and
then performs a value
-
added function
on it after which it forwards it t
o its
original intended destination
Aggregator
Combines results from other services
Process
A long-running service that controls
other services needed to fulfil
a
particular business goal.
As mentioned earlier, orchestration-based service
systems always have one controlling service (CS)
designated as the process. Such systems are long-
grained, and have been known to grow quite large
and complex with time as new services are added to
the existing system. As is the case with other types
of software systems, high complexity affects the
external quality of the system, something that is
undesirable. In this paper, we identify three
granularity levels of Web service systems. These
include:
Low granularity level
Medium granularity level
High granularity level
ICSOFT 2012 - 7th International Conference on Software Paradigm Trends
454
The low granularity level consists of atomic
instances of services as described in Table 1. These
services may be hosted in a single node or they may
be residing in different nodes. In addition, these
services might have been created using several
different programming languages, especially the
workers that may be required to perform certain
functions such as math calculations. Since our focus
is on BPEL services systems, the implementation
details of atomic service within each system are
therefore transparent.
At the medium granularity level, the Web service
system may cut across an enterprise. All types of
services described in Table 1 might be present.
However, these services are seen as elements of one
large Web service system, and interacting together.
One of the services is designated as the controlling
service (CS), also called process, which means it has
the logic needed to control all interactions that may
be required by the system.
Figure 1 shows a medium granularity service
(MGS). Figure 1(a) represents the process, and
Figure 1(b) represents a monitor service. In Figure 1,
white-shaded circles represent activity within a
service, directed arrows indicate internal control-
flow within a service, and directed dash-line arrows
indicate control-flow between one service and
another.
Figure 1: A system model representing a medium
granularity service (MGS).
High granularity services (HGS) are very large
systems that may span across several enterprises.
These systems have a similar architecture to those at
the medium level, except that they are colossal in
nature. This means that quality challenges are much
higher here than those in the smaller systems. To
illustrate this point, the CS of a HGS treats MGS as
compound services and therefore invokes them
alongside the regular atomic services. Furthermore,
the depth of invocations might go to several levels.
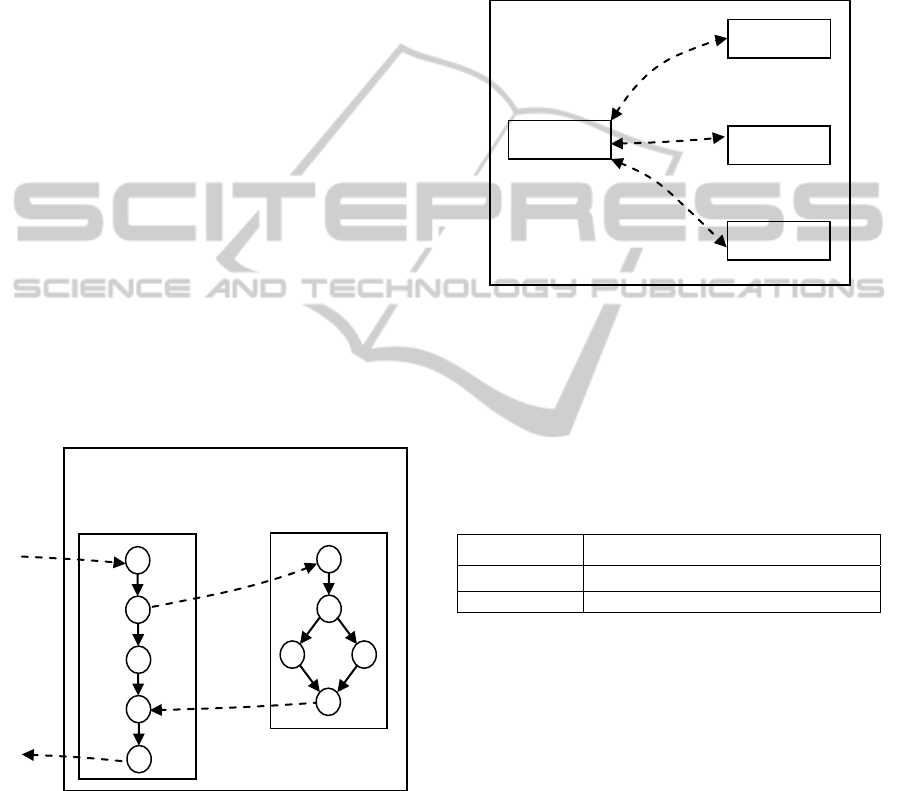
The example in Figure 2 shows a HGS system
containing four interacting services: a process, two
medium granularity services, and one low
granularity service (a monitor service). For
simplicity purposes, all interacting services are
represented as rectangles in the figure.
Figure 2: A system model representing high granularity
service (HGS).
Table 2 describes the two additional types of
compound services found at the medium and high
granularity level of large Web services system i.e.
i.e. MGS and HGS.
Table 2: Types of compound services found in large Web
services systems.
Service
Description
MGS
Medium granularity service.
HGS
High granularity service
To the best of our knowledge, most existing
business process measures are actually model-level
(i.e. target only models of atomic business
processes). Since large enterprise-wide and cross-
enterprise Web service systems present a new
measurement problem, we propose some size
measures for such systems in the next section.
4 PROPOSED MEASURES
The following sections present the proposed size
measures. The measures are based on common
intuition that combining two or more components
results in a larger component. This approach is also
supported in literature by several authors such as
Briand et al. (1996) who discusses on module
(b) Request/reply
service
(a) Process
Client
request
Client
reply
Request
Reply
MGS2
MGS1
Monitor
Process
Size Measures for Large Web Service Systems
455

additivity. Our methodology, therefore, is to identify
a suitable size measure for low-level granularity
measurement of business processes. After measuring
all the services interacting in a system, then we
obtain their summation as a measurement result for
the next level system.
As an example, we use the NOBA measure to
calculate the size of a service by simply counting the
number of basic activities in it. Thus, the size of the
Figure 1(a) is 5 since the process has got five
activities in it i.e. NOBA (Process) = 5. Similarly,
the size of the Figure 1(b) is 5 since the
request/reply service has got 5 basic activities in it
i.e. NOBA (request/reply service) = 5.
4.1 Number of Basic Activities in
System (NOBAS)
The medium granularity service (MGS) is a system
composed of all services interacting together to
achieve a common goal. To evaluate MGS, we
obtain a summation of the number of basic activities
of all services in the system using the formula shown
in Eq. 1.
n
s
sNOBAMGSNOBAS
1
)()(
(1)
Where s is a service of any of the types described
in Table 1 and n is the number of services in the
system.
For example, we calculate the number of basic
activities in the MGS system in Figure 1 as follows:
NOBAS = NOBA(process) +
NOBA(request/reply) =5 + 5 = 10.
HGS systems are extensions of MGS systems. In
a HGS, all MGSs are treated as regular services and
invoked alongside simple atomic services.
Consequently, the same formula for MGS can apply
as shown in Eq. 2.
n
s
sNOBAHGSNOBAS
1
)()(
(2)
Where s is a service of any of the types described
in Table 1 and Table 2 and n is the number of atomic
services in the system.
4.2 Number of Control-flows in System
(NOCS)
The number of control-flows in the system is an
extension of the number of structured activities in a
business process (NOSA) (Muketha et al., 2010).
While this existing metric factored only those
control-flows that are present in a business process
model, we propose to count all control-flows in a
system. Such a measure will be more useful to
managers rather than designers of individual
processes.
To count the number of control-flows in a system
(either MGS or HGS), we simply obtain a
summation of the control-flows in all atomic
services in the system as shown in Eq. 3.
n
s
sNOSANOCS
1
)(
(3)
Where s is a service of any of the types described
in Table 2 and n is the number of services in the
system.
As an example, number of control-flows in the
system in Figure 1 may be computed as follows:
NOCS = NOSA(process) + NOSA(request/reply
service) = 1 + 2 = 3.
4.3 Number of Invocations in System
(NOIS)
The number of invocations in the system is a count
of the total number of times the client and/or the
process invokes its partners. It also involves cases
where services invoke other services before replying
to the client is involved. Invocations introduce more
complexity to the system that other interactions such
as replying.
To count the number of invocations in the
system, we use the formula in Eq. 4.
|| InvNOIS
(4)
Where the length of Inv is the set of all
invocation links in the system.
As an example, the number of invocations in the
system in Figure 1 is 2 i.e. client request and the
request from process to the request/reply service.
4.4 Total System Size (TSS)
The TSS is computed as the summation number of
basic activities in system, the number of control-
flows in the system and the number of invocations in
the system. Invocations are considered in the size
they are a type of control-flow. Thus, this measure
seeks to capture the sum of all elements in the
system as well as their interactions as shown in Eq.
5.
ICSOFT 2012 - 7th International Conference on Software Paradigm Trends
456

NOISNOCSNOBASTSS
(5)
As an example, the TSS of the system in Figure
1 may be computed as follows:
TSS = 10+3 + 2 = 15.
4.5 System Control-flow Density (SCD)
The density of control-flows in a system has been
linked to programmer style, where for instance, one
programmer may write a long program with few
control-flows while another may have more. For this
reason, the overall size as indicated by NOBAS is
not necessarily indicative of complexity. SCD is a
measure of the degree of control-flows in relation to
the total system size. We calculate the SCD of a
system as shown in Eq. 6.
NOBASNOCSSCD /
(6)
As an example, the SID in the system in Figure 1
is computed as follows:
SCD = (1+2)/10 = 0.3.
4.6 System Invocation Density (SID)
It is important to know the relative number of
invocations in the system in addition to knowing the
total invocations. SID is a measure of the degree of
invocations in relation to the total system size. We
calculate the SID of a system as shown in Eq. 7.
NOBASNOISSID /
(7)
As an example, the SID in the system in Figure 1
is computed as follows:
SID = 2/10 = 0.2.
5 RESULTS
All newly defined measures need to be validated
both theoretically and empirically. The size
measures proposed in this paper has been validated
theoretically based on Briand’s framework (Briand
et al., 1996), and the results are presented in this
section.
Briand’s framework proposed five metrics
validation categorizes, namely, size, length,
complexity and coupling and cohesion (Briand et al.,
1996). Since our measure is a size measure, we used
the three size properties in Briand’s framework to
validate it.
Size 1: Non-negativity. The size of a Web
service system cannot be negative, but can be null if
the system has got no services in it i.e. NOBAS
(HGS) ≥ 0. Similarly, NOCS (HGS) ≥ 0, and NOIS
(HGS) ≥ 0, and TSS (HGS) ≥ 0. In addition, the
density measures are evaluated under size properties
since they are derived from size measures. Thus,
SCD (HGS) ≥ 0 and SID (HGS) ≥ 0 since non
negative but possibly null values of their base
measures leads to a value of zero.
Size 2: Null value. The size of a Web service
system is null if system is empty i.e. if it has got no
service nodes in it, then NOBAS (HGS) = 0.
Similarly, NOCS (HGS) = 0, and NOIS (HGS) = 0,
and TSS (HGS) = 0, and SCD (HGS) = 0, and SID
(HGS) ≥ 0.
Size 3: Module additivity. The size of a Web
service system is equal to the sum of the sizes of two
of its modules. For example in Figure 2 the size of
the HGS system is equal to the sum of the sizes of
the process, MGS1, MGS2, and monitor services.
Clearly, the proposed measures satisfy this property
since measurement is based on summations of
atomic services within the system.
The fact that our metrics satisfy all three size
properties as proposed in Briand’s measurement
framework is an indicator of sound structural
definition of the proposed measures. Table 3
presents a summary of these results.
Table 3: Summary of Theoretical Results.
Measure
Size 1
Size 2
Size 3
NOBAS
Yes
Yes
Yes
NOCS
Yes
Yes
Yes
NOIS
Yes
Yes
Yes
TSS
Yes
Yes
Yes
SCD
Yes
Yes
Yes
SID
Yes
Yes
Yes
Yes = satisfied property
The proposed measures focus on orchestration-
based Web service systems. Although a BPEL
environment is assumed for all the examples given,
the proposed measures could also apply to other
orchestration-based programming environments.
Generally, large values of the measures should
be taken as a pointer that the system being evaluated
is risky and error-prone. We have not established a
threshold for the measure, because extensive
empirical studies are needed first before this can be
possible. However, our approach to measure based
on service granularity levels is a first step towards
evaluating very large systems. For instance, systems
that are in the high granularity level should be taken
as being in the risk-level category.
Size Measures for Large Web Service Systems
457

6 CONCLUSIONS
In this paper, we have proposed size measures for
large Web service systems. We have provided
several examples in order to show how the measures
might be calculated. We have also validated the
measures theoretically using Briand’s measurement
framework. Theoretical results show that the
proposed measure satisfied all three size properties
from Briand’s framework, which implies that it is a
structurally sound measure.
Future work is to conduct empirical studies in
order to analyze the value of the proposed measures
in relation to external quality characteristics for Web
services such as maintainability.
REFERENCES
Briand L. C., Morasca S. and Basilli V. R. 1996 Property-
Based Software Engineering Measurement. IEEE
Transactions on Software Engineering, Vol. 22,
pp.68-86.
Cardoso J., 2008. Business Process Control-Flow
Complexity: Metric, Evaluation, and Validation.
International Journal of Web Services Research, Vol.
5, pp.49-76.
Daniel F., and Pernici B. 2006. Insights into Web Service
Orchestration and Choreography.International Journal
of E-Business Research, Vol. 2, 2006, pp.58-77.
Cardoso J., Mendling J., Neumann G., and Reijers H.A.,
2006. A Discourse on Complexity of Process Models
(Survey Paper), LNCS, Vol. 4103, pp.115-126.
Charfi A., and Mezini M. 2004.Aspect-Oriented Web
Services Composition with AO4BPEL”, LNCS, Vol.
3250, pp.168–182.
Gruhn V., and Laue R. 2006. Adopting the Complexity
Measure for Business Process Models”, 5th IEEE
International Conference on Cognitive
Informatics,pp.236-241.
Mendling J., and Neumann G., 2007 Error Metrics for
Business Process Models.19th International
Conference on Advanced Information Systems
Engineering (CAISE’07), pp.53-56.
Michelson B., 2005. Business Process Execution
Language (BPEL) Primer: Understanding an
Important Component of SOA and Integration
Strategies.http://www.psgroup.com
Modafferi S., and Conforti E. 2006. Methods for Enabling
Recovery Actions in WS-BPEL. LNCS. Vol. 4275,
pp.219-236.
Muketha G. M., Ghani A.A.A., Selamat M.H. and Atan
R., 2010. Complexity Metrics for Executable Business
Processes”, Information Technology Journal, Vol. 9,
pp.1317-1326.
Munoz L., Mazon J., and Trujillo J. 2010.A Family of
Experiments to Validate Measures for UML Activity
Diagrams of ETL Processes in Data
Warehouses.Information and Software Technology,
Vol. 52, pp.1188-1203.
Rolon E., Cardoso J., Garcia F., Ruiz F., and Piattini M.
2008.Analysis and Validation of Control-Flow
Complexity Measures with BPMN Process
Models.LNBIP, Vol. 29, pp.58-70.
Rud D.,Schmietendorf A., and Dumke R., 2006. Product
Metrics for Service-Oriented Infrastructures, In A.
Abran, M. Bundschuh, G. Büren, and R. Dumke,
eds.,Applied Software Measurement. Proc. of the
International Workshop on Software Metrics and
DASMA Software MetrikKongress (IWSM/MetriKon
2006).MagdeburgerSchriftenzumEmpirischen
Software Engineering, Potsdam, Germany, Hasso-
Plattner-Institut, Shaker Verlag, November, pp.161-
174.
Zhang Q., and Li X., 2009. Complexity Metrics for
Service Oriented Systems.Second International
Symposium on Knowledge Acquisition and Modeling,
IEEE, pp.375-378.
Zheng Y., Zhou J., and Krause P. 2007. Analysis of BPEL
Data Dependencies. 33rd EUROMICRO Conference
on Software Engineering and Advanced Applications.
IEEE
. pp.351-358.
ICSOFT 2012 - 7th International Conference on Software Paradigm Trends
458
