
A Classification Method of Open-ended Questionnaires using
Category-based Dictionary from Sampled Documents
Keiichi Hamada
1
, Masanori Akiyoshi
2
, Masaki Samejima
1
and Hiroaki Oiso
3
1
Department of Information Science and Technology, Osaka University, 2-1 Yamadaoka, Suita, Osaka, Japan
2
Faculty of Applied Information Science, Hiroshima Institute of Technology, 2-1-1 Miyake saeki-ku, Hiroshima, Japan
3
Codetoys K. K, 8F Dojima building, 2-6-8 Nishitenma, Kita-ku, Osaka, Japan
Keywords:
Open-ended Questionnaires, Typical Words Involvement Degrees, Co-occurrence Pattern.
Abstract:
This paper addresses a classification method of open-ended questionnaires using a category-based dictio-
nary. Different from other classification methods, our proposed method introduces a category-based dictio-
nary which is generated from a small set of categorized samples. This category-based dictionary is used to
judge questionnaire categories with t f-id f(term frequency inverted document frequency) and co
t f-id f(co-
occurrence t f-id f). Experimental questionnaires about a university lecture show that 71% of these question-
naires are classified accurately.
1 INTRODUCTION
Recently, various types of questionnaires (e.g. close-
ended, open-ended) are collected to improve contents
or services. In open-ended questionnaires, people
write opinions in their own words that are expected
to involve significant information. Analysts classify
the questionnaires into categories for grasping which
types of opinions are useful. However, analysts spend
a lot of time for reading the questionnaires in order to
classify them. In order to classify them into categories
efficiently, this paper addresses an efficient classifica-
tion of open-ended questionnaires.
One of the document classification methods is
text mining(Berry, 2003) which analyzes and clas-
sifies large amounts of text data (e.g. news arti-
cles(Atkinson and Van der Goot, 2009), patent doc-
uments(Tseng et al., 2007)). SVM(Support Vector
Machine) and clustering are also the popular machine
learning techniques that are useful for questionnaire
classification by a number of questionnaires(Zhang
and Lee, 2003)(Chim and Deng, 2008). However, the
questionnaires include grammatical errors and typos,
and are not accumulated for the classification, while
make it difficult to apply the text mining and the ma-
chine learning classifier.
t f -id f(term frequency inverted document fre-
quency) (Salton and Buckley, 1988) that indicates
characteristics of words is a successful approach to
document classification(Ramos, 2002). It is pos-
sible to find characteristic words in each category
by t f-id f. Documents can be classified by empha-
sizing the characteristic words in comparing doc-
uments. But some classification methods using
t f -id f(Trieschnigg et al., 2009) need tuning param-
eters to be determined manually for every targets,
which are difficult to decide based on question-
naires that are not accumulated. In addition, text
mining techniques using co-occurrence patterns have
been proposed for supporting document classifica-
tion (e.g. a keyword extraction algorithm using a
set of co-occurrence between each term and frequent
terms(Matsuo and Ishizuka, 2004)).
Based on our investigation on contents of ques-
tionnaires in each category, we found that there are
characteristic words and co-occurrence patterns. So,
we propose the classification method using t f-id f
which considers words and co-occurrence patterns. In
order to reflect the characteristics of the categories to
t f -id f, the proposed method uses samples of ques-
tionnaires categorized by analysts in advance and cal-
culates “typical words involvement degree” between
an inputted questionnaire and each category based on
the samples. The questionnaire is classified into some
categories that have high typical words involvement
degrees with the questionnaire.
193
Hamada K., Akiyoshi M., Samejima M. and Oiso H..
A Classification Method of Open-ended Questionnaires using Category-based Dictionary from Sampled Documents.
DOI: 10.5220/0003971601930198
In Proceedings of the 14th International Conference on Enterprise Information Systems (ICEIS-2012), pages 193-198
ISBN: 978-989-8565-12-9
Copyright
c
2012 SCITEPRESS (Science and Technology Publications, Lda.)

Category based
dictionary
Category classification
sample
Unclassified
questionnaire
・・・・・・・・
Unknown
questionnaire
Category
classification
・・・・・・・・
Questionnaire
data
Manual
registration
Cat Cat
Manual
registration
Automatic
registration
Important words
DB
refer
Judgement of typical
words involvement
refer
Sampling
Word tf-idf
〇〇
1.0
△△
0.7
…
…
Co-occurrence
pattern
co_tf-idf
〇〇, △△
1.0
〇〇, ××
0.6
…
…
Cat Cat
Cat
Figure 1: Outline of analysis support system.
2 CLASSIFICATION SUPPORT
SYSTEM
2.1 System Overview
Figure 1 shows the outline of the classification sup-
port system. In advance, analysts pick up parts of
questionnaire data, and classify the sentences of the
questionnaires into categories Cat
i
. These sentences
are defined as “category classification samples”. The
goal of this research is to classify questionnairesusing
as few “category classification samples” as possible,
because there are not many questionnaires and a few
“category classification samples” make analysts easy
to classify to categories they expect.
For the classification, this system uses only noun,
verb, and adjective that indicate the contents of the
questionnaires. The questionnaires are classified by
using similarity between “category classification sam-
ples” and the questionnaires.
Because each sentence may have different con-
tents in the questionnaire, this system does not clas-
sify the questionnaire, but a sentence in the question-
naire. In case that sentences in a questionnaire have
contents of different categories(e.g. Cat
1
and Cat
2
),
the questionnaire is classified into the categories(e.g.
Cat
1
and Cat
2
).
Being inputted to the system, a questionnaire is
separated to sentences for the above reason. And the
system removes words in “general DB” which is a
database of stop words(e.g. do, be).
In order to classify questionnaires with high accu-
racy, we need to define how to decide the similarity.
2.2 Approach
The typical method to decide similarities is to find
common words in “category classification samples”.
But, the common words in these samples do not indi-
cate characteristics of words. So, questionnaires are
often classified wrongly.
Because analysts classify questionnaires based on
the meaning of the categories, the questionnaires are
similar to each other in the same category. Accord-
ing to investigate questionnaires, it is considered that
there are some features of questionnaires as below.
• A questionnaire includes typical words which are
words or synonyms included in other question-
naires in the same category. And, co-occurrence
patterns consisting of the typical words appear in
a questionnaire.
• Some categories have important words that char-
acterize the categories.
We define “typical words involvement degree” as
the similarity to classify questionnaires based on the
above features. This degree is an index based on how
many typical words and co-occurrence patterns ap-
pears in a questionnaire. Also, this degree is calcu-
lated by “category-based dictionary” that consists of
typical degrees of words and co-occurrence patterns.
And “important words DB” which is a database of
words that analysts consider to characterize a cate-
gory. “Category-based dictionary” is constructed by
category classification samples, and “important words
DB” is manually constructed by analysts.
3 JUDGMENT OF TYPICAL
WORDS INVOLVEMENT
DEGREES
3.1 Construction of “Category-based
Dictionary”
As we mentioned before, a sentence in a question-
naire often includes typical words and co-occurrence
patterns. It is necessary to calculate typical degrees
of words and co-occurrence patterns. As for the con-
struction of “category-based dictionary”, t f −id f and
co t f-id f(co-occurrencet f-id f) are used as these de-
grees as shown in (1), (2), and Table 1.
t f -id f(w
j
) = t f(w
j
) × log
N
d f(w
j
)
(1)
co t f-id f(w
k
, w
l
) =
t f
co
(w
k
, w
l
) × log
N
d f
co
(w
k
, w
l
)
(2)
ICEIS2012-14thInternationalConferenceonEnterpriseInformationSystems
194
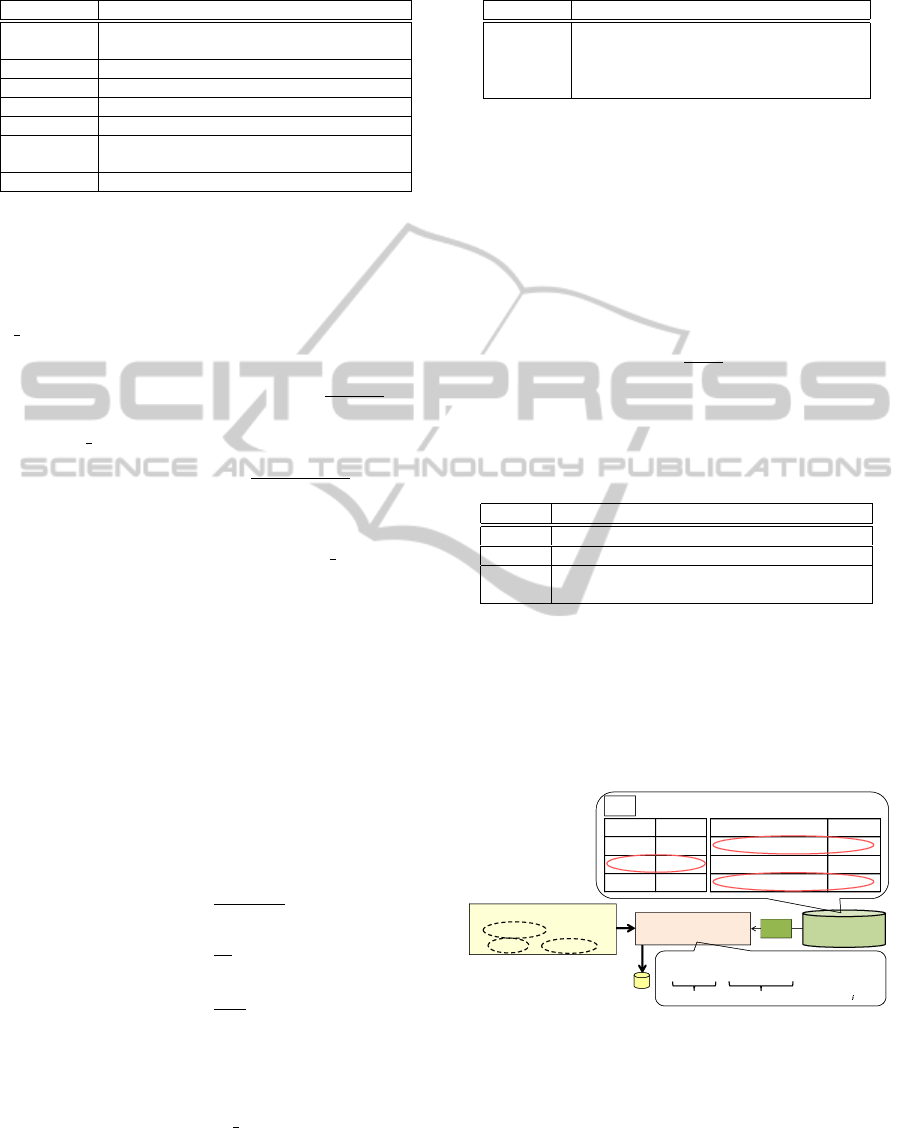
Table 1: Definition and condition of symbols.
Symbol Definition/Condition
j, k, l 1 ≤ j, k, l ≤ Const (Const is the number of
words in “category classification samples”)
w
j
a word
t f(w
j
) the number of occurrences for w
j
in a category
N the number of all categories
d f (w
j
) the number of categories w
j
appears
t f
co
(w
k
, w
l
) the number of occurrences which w
k
and w
l
appear together in a category
d f
co
(w
k
, w
l
) the number of categories w
k
and w
l
appears
“Important words DB” is used for reflecting im-
portant words in typical words to typical degrees.
When a word is in a set “X” of words in “im-
portant words DB”, importance degrees of typical
words(C
1
,C
2
≥ 1) are weighted to t f − id f and
co t f-id f as shown in (3), (4).
t f -id f(w
j
) = C
1
× t f(w
j
) × log
N
d f(w
j
)
(3)
co t f-id f(w
k
, w
l
) =
C
2
× t f
co
(w
k
, w
l
) × log
N
d f
co
(w
k
, w
l
)
(4)
s.t. w
j
∈ X, w
k
or w
l
∈ X
Finally, because t f − id f and co t f-id f in
“category-based dictionary” may not be normalized,
we make them normalize into a range of 0 and 1 for
each category.
3.2 Calculation of Typical Words
Involvement Degrees
“Typical words involvement degree” should be based
on both typical words and co-occurrence patterns. So,
typical words involvement degree R for a category is
decided by an average of R
t
and R
cot
as shown in (5)
- (9), and Table 2.
R =
R
t
+ R
cot
2
(5)
R
t
=
R
′
t
n
t
(6)
R
cot
=
R
′
cot
n
cot
(7)
R
′
t
=
∑
1≤m≤n
t
t f -id f(w
m
) (8)
R
′
cot
=
∑
1≤p<q≤n
t
co t f-id f(w
p
, w
q
) (9)
Table 2: Definition of symbols.
Symbol Definition
n
t
and n
cot
the number of common words and com-
mon co-occurrence patterns between
“category-based dictionary” and the
sentence
3.3 Judgment by Typical Words
Involvement Degree and It’s
Example
A questionnaire is classified into the target category
by judging whether typical words involvement degree
R is higher than the threshold value S
i
as shown in
(10), (11), and Table 3.
S
i
=
sum
i
num
i
(10)
sum
i
=
∑
O
r
∈Cat
i
R
O
r
(11)
Table 3: Definition of symbols.
Symbol Definition
num
i
the number of sentences in Cat
i
O
r
the sentence r
R
O
r
typical words involvement degree R for the
sentence r
Figure 2 shows an example of typical words in-
volvement judgment. This target sentence includes
word “History” and co-occurence pattern “Calculator,
History” and “Calculator, Knowledge”. The typical
words involvement degree R for Cat
i
is 0.6965 which
is higher than S
i
= 0.5. Thus, the questionnaire in-
cluding this target sentence is classified to Cat
i
.
Category based
dictionary
Judgement of typical
words involvement
refer
Word tf-idf
Once 1.0
History 0.636
Difficult 0.144
Co-occurrence pattern co_tf-idf
Calculator, History 1.0
Calculator, Difficult 0.836
Calculator, Knowledge 0.514
Cat
i
Cat
i
A target sentence
In this lecture, I got many
knowledge about the
history of calculator.
Typical words involvement degree R
= {0.636 / 1 + (1 + 0.514) / 2} / 2 ≓ 0.6965 > 0.5
Rt
Rcot
(S = 0.5)
Figure 2: An example of typical words involvement judg-
ment.
3.4 Automatic Acquisition Method of
Importance Degrees C
1
,C
2
The system needs to determine C
1
and C
2
automat-
ically based on relations between category classifi-
AClassificationMethodofOpen-endedQuestionnairesusingCategory-basedDictionaryfromSampledDocuments
195
cation samples and “category-based dictionary”, be-
cause it is difficult for analysts to determine C
1
and
C
2
in advance.
A correct sentence which is classified into a tar-
get category in category classification samples should
havea high typical words involvementdegree because
the sentence has common words with the target cate-
gory. However, an incorrect sentence which is not
classified into the target category should have a low
typical words involvement degree because the sen-
tence lacks many related words to the topic. In ad-
dition, it should have low standard deviation of typ-
ical words involvement degrees for correct sentences
because typical words involvement degrees of the cor-
rect sentences are similar each other.
This system determines suitable C
1
,C
2
under the
conditions that (1) a correct sentence has higher typ-
ical words involvement degree than that every incor-
rect sentence has, and (2) the standard deviation of
typical words involvement degrees for correct sen-
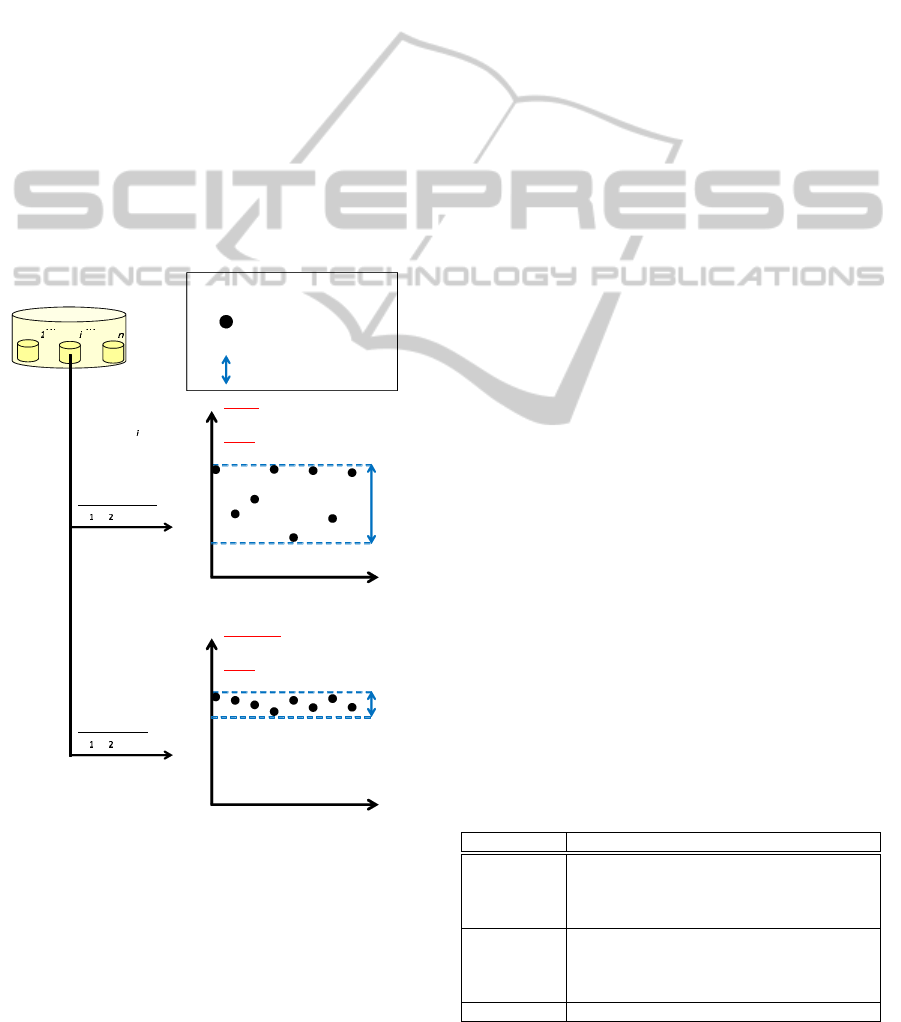
tences is as low as possible as shown in Figure 3.
Inappropriate
(C , C )
The feature of
category classification
sample Cat
Typical words
involvement degrees
・Mixed situation as to
correct and incorrect sentences
・
Large standard deviation as to
correct sentences
Category classification
sample
×
××
×
×
××
×
×
××
×
×
××
×
×
××
×
×
××
×
×
××
×
×
××
×
Appropriate
(C , C )
Typical words
involvement degrees
Category classification
sample
×
××
×
×
××
×
×
××
×
×
××
×
×
××
×
×
××
×
×
××
×
×
××
×
(C1, C2):A pair of importance
degree of typical words
: Correct sentence
: Incorrect sentence
: Standard deviation for
correct sentences
×
××
×
・Separated situation as to
correct and incorrect sentences
・
Small standard deviation as to
correct sentences
Category classification
sample
Cat CatCat
Figure 3: Desirable situation as to correct and incorrect
opinions in category classification sample.
Based on this, the automatic acquisition algorithm
is as follows.
1. For each combination C
1
and C
2
, calculate the
number of incorrect sentences as number, that
have higher typical words involvement degree
than the minimum of correct sentences in the con-
dition of 1.0 ≤ C
1
≤ C
max
C1.0 ≤ C
2
≤ C
max
.
2. Create class P including the combination C
1
and
C
2
which has lowest number.
3. For each combination of C
1
and C
2
in P, calcu-
late the standard deviation as sd, of typical words
involvement for correct sentences.
4. Determine the combination of C
1
and C
2
that lead
the lowest sd.
4 EVALUATION
4.1 Results of Experiment
We executed an experiment to evaluate effectiveness
of our proposed method. The target questionnaires
data are questionnaires on “Give what you learned or
what you feel about calculators’ history” in a univer-
sity lecture. The number of questionnaires is 165 with
an average of 3.0 sentences per a questionnaire and
with an average of 8.3 words per a sentence. We pro-
vided 10 categories in advance, and each extraction
has 20 questionnaires as “category classification sam-
ples” that each category has at least two sentences. An
average of sentences including category classification
samples per an extraction is 67.0. In this experiment,
we calculated the average of results for 5 times of ex-
tractions. Evaluation criteria are the recall rate, preci-
sion rate, and F measure as shown in Table4.
For separating a sentence to words, we used mor-
phological analysis “Japanese morphological analy-
sis” in Yahoo!Japan Developer Network. In addition,
we defined C
max
= 10.0 in automatic acquisition of
importance degrees C
1
and C
2
.
We compared the effectiveness by the proposed
method to ones by other methods: the method of clus-
tering and the method of SVM. In the SVM, the num-
bers of occurrences for the top five frequently-used
words are used as vector elements.
Table 4: Definition of evaluation criteria.
Criteria Definition
recall rate recall = [
∑
i
the number of classified question-
naires correctly using a method for Cat
i
] / [
∑
i
the number of classified questionnaires manu-
ally for Cat
i
]
precision rate precision = [
∑
i
the number of classified ques-
tionnaires correctly using a method for Cat
i
]
/ [
∑
i
the number of classified questionnaires
manually for Cat
i
]
F measure [2× recall × precision] / [recall + precision]
ICEIS2012-14thInternationalConferenceonEnterpriseInformationSystems
196
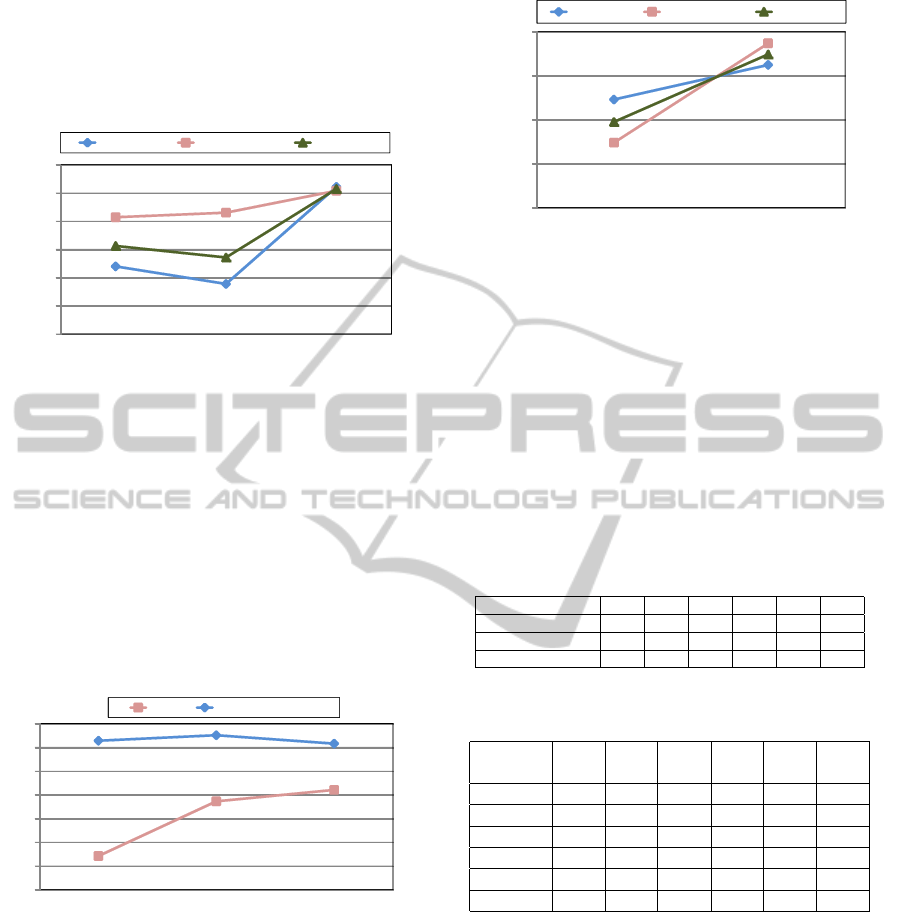
Figure 4 shows that our proposed method is the
best classification accuracy of the three methods. The
accuracy allows analysts to understand the number of
questionnaires in each category and the contents of
categories reading “category classification samples”.
Clustering SVM Proposed method
20
30
40
50
60
70
80
Recall rate, Precision rate,
F measure(%)
Recall rate Precision rate F measure
Figure 4: Result of classification experiment.
4.2 Discussion
Figure 5 shows F measures in increasing the number
of category classification when the number of sam-
ples is changed from 20 to 100.
Even if category classification samples are in-
creased, the accuracy of the proposed method is better
than the method of SVM. So, it is confirmed that the
proposed method does not depend on the number of
category classification samples. Thus, our proposed
method can classify questionnaires at a reduced cost.
20 samples 50 samples 100 samples
40
45
50
55
60
65
70
75
F measure(%)
SVM Proposed method
Figure 5: Result of classification experiment by using in-
creased category classification sample.
In order to verify the adequacy of important
words, we compared our proposed method to the
method without important words as C
1
= C
2
= 1.0.
Figure 6 shows the result for Data Set “A”(F measure
= 72.4%) which has the best F measure in 5 data sets
using our proposed method. Figure 6 shows that re-
call rate is increased by 4%, precision rate is increased
by 11%, F measure is increased by 8%.
Table 5 showsC
1
and C
2
for each category includ-
ing more than 20 questionnaires and F measure by
our proposed method. C
1
and C
2
are decided to 1.0
Without
important words
With
important words
55
60
65
70
75
Recall rate, Precision rate,
F measure(%)
Recall rate Precision rate F measure
Figure 6: Result of comparison with/without important
words.
in Category 4 because it does not have any important
words. Table 6 shows the result of sensitivity analysis
of changes in C
1
and C
2
for Category 6.
Table 6 shows that the F measure by our proposed
method is 5% lower than that one by using the best
C
1
and C
2
in Category 6. Thus, we can prove impor-
tant words are effective, and it is possible to improve
classification accuracy by the improvement of the au-
tomatic acquisition method of C
1
and C
2
.
Table 5: C
1
and C
2
for each category and F measure.
Category Number 1 2 3 4 5 6
C
1
6.8 2.0 1.0 1.0 10.0 3.0
C
2
1.0 3.4 1.2 1.0 10.0 1.0
F measure(%) 76.6 67.9 82.5 55.4 85.1 75.0
Table 6: F measure(%) in category 6.
H
H
H
H
H
C
1
C
2
1 3 5 7 9 10
1 68.1 76.0 76.0 76.0 76.0 76.0
3 75.0 80.0 78.6 77.2 77.2 77.2
5 75.0 78.6 77.2 77.2 77.2 77.2
7 75.0 78.6 77.2 77.2 77.2 77.2
9 75.0 77.2 77.2 77.2 76.7 76.7
10 75.0 77.2 77.2 77.2 76.7 76.7
Figure 7 shows the results for each category in
Data Set “A” and Data Set “B”(F measure = 68.6%).
Table 7 shows the number of manually classified
questionnaires for each category that includes more
than 20 questionnaires. Both of these results show
that the classification accuracy differs in each cate-
gory. The F measure for Category 5 in both data sets
is about 85%, but Category 4 is about 50%. This dif-
ference depends on whether the category’s content is
clear or not. Table 8 and 9 show the sentences in-
cluded in Category 4 and 5, respectively. The sen-
tences in categories which have clear contents e.g.
Category 5 includes clear words that characterize the
category, and these clear words have a high value of
AClassificationMethodofOpen-endedQuestionnairesusingCategory-basedDictionaryfromSampledDocuments
197

40
50
60
70
80
90
1 2 3 4 5 6
F measure(%)
Data set ``A'' Data set ``B''
Figure 7: Result of classification experiment for 2 category
classification sample patterns.
t f -id f and co t f-id f. So, the sentences with clear
contents can be classified accurately. On the other
hand, in categories which is confused contents such
as Category 4, the system can not identify words that
characterize the category, and the words appear in
other categories. Thus it is difficult to classify in these
categories.
Table 7: The number of correctly categorized opinions for
each category.
Category Number 1 2 3 4 5 6
Data set “A” 89 53 46 39 25 22
Data set “B” 89 60 36 43 21 30
Table 8: Examples of category 4 “Dangerousness and how
to deal with information society”.
I would like to learn how to deal with overflooding
information.
But such information is not always right.
But I do not know whether it is good to depend on
information in the web.
Table 9: Example of category 5 “Electronic tag technol-
ogy”.
And it is nice to know electronic tag is used in book
stores’ security system.
I understood that electronic tags are used every-
where.
I think there will be no more cash registers in the
future because electronic tags are used for in all
goods.
5 CONCLUSIONS
This paper addressed the classification method of
open-ended questionnaire using category-based dic-
tionary from category classification samples. Our
proposed method uses typical words involvement de-
gree which is an index that measures the number of
typical words and co-occurrence patterns that charac-
terize a category. By applying our proposed method
to questionnaires about a university lecture, 71% of
these questionnaires are classified accurately. As a
result of experiments, the clearer the contents are, the
more accurate the proposed method can classify the
questionnaires.
REFERENCES
Atkinson, M. and Van der Goot, E. (2009). Near real time
information mining in multilingual news. In Proceed-
ings of the 18th international conference on World
wide web, WWW ’09, pages 1153–1154, New York,
NY, USA. ACM.
Berry, M. (2003). Survey of Text Mining : Clustering, Clas-
sification, and Retrieval. Springer.
Chim, H. and Deng, X. (2008). Efficient phrase-based doc-
ument similarity for clustering. IEEE Transactions on
Knowledge and Data Engineering, 20:1217–1229.
Matsuo, Y. and Ishizuka, M. (2004). Keyword extraction
from a single document using word co-occurrence sta-
tistical information. International Journal on Artifi-
cial Intelligence Tools, 13(1):157–169.
Ramos, J. (2002). Using TF-IDF to Determine Word Rele-
vance in Document Queries. Technical report, Depart-
ment of Computer Science, Rutgers University, 23515
BPO Way, Piscataway, NJ, 08855e.
Salton, G. and Buckley, C. (1988). Term-weighting ap-
proaches in automatic text retrieval. Information pro-
cessing and management, 24(5):513–523.
Trieschnigg, D., Pezik, P., Lee, V., de Jong, F., Kraaij,
W., and Rebholz-Schuhmann, D. (2009). MeSH Up:
effective MeSH text classification for improved doc-
ument retrieval. Bioinformatics (Oxford, England),
25(11):1412–1418.
Tseng, Y.-H., Lin, C.-J., and Lin, Y.-I. (2007). Text mining
techniques for patent analysis. Inf. Process. Manage.,
43:1216–1247.
Zhang, D. and Lee, W. S. (2003). Question classification
using support vector machines. In Proceedings of the
26th annual international ACM SIGIR conference on
Research and development in informaion retrieval, SI-
GIR ’03, pages 26–32, New York, NY, USA. ACM.
ICEIS2012-14thInternationalConferenceonEnterpriseInformationSystems
198
