
Risk Prediction of a Behavior-based Adhesion Control Network for
Online Safety Analysis of Wall-climbing Robots
Daniel Schmidt and Karsten Berns
Robotics Research Lab, Department of Computer Sciences, University of Kaiserslautern, 67663 Kaiserslautern, Germany
Keywords:
Genetic Algorithm, Behavior-based, Risk Prediction, Climbing Robot.
Abstract:
Risk analysis in combination with terrain classification is a common approach in mobile robotics to adapt
robot control to surface conditions. But for climbing robots it is hard to specify, how the robotic system
and especially the adhesion is affected by different surfaces and environmental features. This paper will
introduce the climbing robot CROMSCI using negative pressure adhesion via multiple chambers, adaptive
inflatable sealings and an omnidirectional drive system. It presents the used behavior-based control network
which allows the balancing of adhesion force, but fails in extreme situations. Therefore, a risk prediction has
been developed which evaluates behavioral meta-data and allows an estimation of current hazards caused by
the environment. This prediction is used to perform evasive actions to prevent the robot from falling down.
1 INTRODUCTION
A general requirement for robots is safety. Com-
monly, mobile systems have to deal with macro ob-
stacles like persons, furniture, trees or holes depend-
ing on their field of application. In these cases the
results of a crash and requirements to avoid it can be
described well (Kelly and Stentz, 1998) and common
approaches of obstacle detection and avoidance can
be applied. A more difficult challenge is the adap-
tion to environmental features, which can either not
be detected in total or whose impact on the robot is
not known sufficiently. Some use methods of terrain
classification via simple metrics (Castelnove et al.,
2005) or learning methods(Stavens and Thrun, 2006),
others try to get more general information about the
traversability (Kim et al., 2006) of the surface. These
approaches have in common that they collect environ-
mental data, extract key features and derive informa-
tion which will influence robot navigation.
For wall-climbing robots safety is a main require-
ment. The problem of terrain analysis is manageable
if the climbing system uses legs with independent ad-
hesion units which can test the grip at each foot point
(Luk et al., 2001). Other robots use adhesion systems
like magnets (Shang et al., 2008) which are safe by
default. But for wheeled driving on concrete walls
via negative pressure adhesion a prediction of risks is
essential. Here, the robot is permanently exposed to a
drop-off if it is in motion. Unfortunately, not only the
foresighted detection of hazardous features is nearly
impossible due to missing sensor accuracy and/or lim-
ited payload. Also the impact of features like surface
roughness, sheathing defects, porous areas or micro
channels on the adhesion system can not be described
sufficiently (in contrast to macro features).
This paper presents a risk prediction method and
suitable measures to avoid them. Upcoming section 2
will introduce some fundamentals. Section 3 presents
the procedure of risk prediction, section 4 shows how
the needed parameters are determined via training.
The experimental results and safety measures are pre-
sented in section 5, conclusions follow in section 6.
2 FUNDAMENTALS
The research presented in this paper is aimed at the
climbing robot CROMSCI (Schmidt et al., 2011) but
works for similar systems, too. CROMSCI is designed
to be used for inspections of large concrete buildings
as depicted in figure 1. Requirements for this task
are a relatively high velocity even in vertical direc-
tion or overhead for a sufficient fast navigation be-
tween inspection points and the ability of carrying a
high payload in terms of inspection sensors. The most
innovative feature of CROMSCI is the negative pres-
sure system consisting of seven individual adhesion
chamberswhich allowa balancing of downforces. For
high maneuverability and fast continuous motion it is
118
Schmidt D. and Berns K..
Risk Prediction of a Behavior-based Adhesion Control Network for Online Safety Analysis of Wall-climbing Robots.
DOI: 10.5220/0003974701180123
In Proceedings of the 9th International Conference on Informatics in Control, Automation and Robotics (ICINCO-2012), pages 118-123
ISBN: 978-989-8565-21-1
Copyright
c
2012 SCITEPRESS (Science and Technology Publications, Lda.)

security
rope
vacuum
reservoir
wheel
domes
umbilical
cord
Figure 1: Climbing robot
CROMSCI at a concrete wall.
equipped with three unsprung steerable driven stan-
dard wheels. A load cell is integrated into each wheel
to measure forces and torques at the wheel’s contact
point. CROMSCI can be equipped with a movable ma-
nipulator arm to carry inspection sensors. For com-
munication and energy supply it is connected to a
ground station via an umbilical cord. Some key data
of the robot are a maximum velocity of 9.81 m/min,
80 cm diameter, a weight of 45 kg and an additional
payload of about 10kg.
The control software of CROMSCI makes use of
the behavior-based control architecture iB2C (Proet-
zsch et al., 2010) on all abstraction levels reaching
from closed-loop control up to high deliberative func-
tions. In general an iB2C behavior is an algorithmic
element which generates control data based on its in-
puts. All behaviors share a common meta data inter-
face for interaction. Two of these data ports deliver
information about the current state of the behavior
and are important in this context: activity ~a ∈ [0,1]
w
shows the real amountof action the behavior performs
whereas the target rating r ∈ [0,1] represents its sat-
isfaction with the current situation.
The adhesion control system itself consists of a
network of 47 of these behavior elements as published
in (Schmidt and Berns, 2011). The lower part of the
network consists of the chamber controllers which
perform the closed-loop pressure control. Their meta
values are presented exemplarily in equations 1 and 2.
The behavior’s activity a
CC
depends on the actual
valve area A
act
and its maximum A
max
(the larger the
valve opening the more active). The target rating r
CC
uses the control difference of desired p
des
and actual
chamber pressure p
act
compared to a maximum dif-
ference ∆p
max
and therefore is unhappy if the desired
pressure value can not be reached or if it is not acti-
vated (ι
CC
is an internal activation value).
a
CC
= ι
CC
·
A
act
A
max
(1)
r
CC
=
max
0,
min
1,
|p
act
− p
des
|
∆p
max
+ (1− ι
CC
)
(2)
In an outer control loop the downforce is adjusted.
The meta values of all behaviors are calculated in a
similar way as for the chamber controllers. Additional
behaviors analyze the robot state or inhibit chamber
controllers in cases of high leakages to prevent the
complete adhesion system from fail. Nevertheless,
the optimal downforce is not easy to determine be-
cause the robot neither should fall down nor get stuck.
Even if it is in the ideal range at about 2000N there
still exists the chance of the robot to slip or tilt which
could result in a drop off. Some additional measures
like a traction control system have already been devel-
oped to reduce these effects but can not prevent them
completely (Schmidt et al., 2011).
3 RISK PREDICTION
The basic control measures work in general, but are
not able to prevent the robot from a drop-off in cer-
tain situations. Although the robot is equipped with
a light-weighted Hokuyo laser ranger for obstacle
avoidance, these external sensor data have a relatively
low accuracy compared to the micro-features which
need to be detected for a foresighted evaluation of
the terrain. Therefore, internal sensors like the pres-
sure sensors have to be taken into account here. This
approach is possible because of the redundant multi-
ple chamber system which allows the failure of some
chambers for a short period of time without endan-
gering the system. In practice the front chambers in
driving direction are exposed to hazardous features
first which allows a judgement of the upcoming ter-
rain characteristics. First experiments have proven
that pressure values itself are not sufficient for risk
prediction. The idea is to evalute activity and target
rating values of the adhesion behaviors instead. Espe-
cially the different target ratings provide information
about the system state because they represent individ-
ual satisfaction values of controllers.
The intention is now to receive a risk value of
an evaluation function E(~a,~r) which is one or above
if the robot will drop off within the next seconds
(if no evasive action is performed). Of course, this
risk value should indicate a potential drop off early
enough to allow evasion actions. On the other hand it
must stay below one if the robot adhesion is not en-
dangered to avoid false positives.
E(~a,~r) =
n−1
∑
i=0
w
a
i
·a
i
+ w
sa
i
·s(a
i
)+ w
r
i
·r
i
+ w
sr
i
·s(r
i
)
(3)
The current approach uses a weighted sum (equa-
tion 3) E(~a,~r) : [0, 1]
4n
7→ R as evaluation function
RiskPredictionofaBehavior-basedAdhesionControlNetworkforOnlineSafetyAnalysisofWall-climbingRobots
119

based on the meta data of the n behaviors. At this
juncture activity and target rating values a
i
respective
r
i
of behavior i are used in combination with corre-
sponding weights w
a
i
and w
r
i
. In addition also low-
pass filtered meta values s(a
i
) and s(r
i
) with s(x) =
0.3·x+0.7·s
′
(x) and corresponding weights are taken
into account which reduces peaks in the evaluation
function. It is also possible to calculate and use other
values like average, median or variance in the same
way. Recent experiments have shown that these ad-
ditional values may allow a better prediction, but this
enhancement comes with two restrictions: At first one
needs to determine a lot of more weights, at second
there is a higher specialization to certain situations
and parameters like vehicle velocity. The main prob-
lem is now to determine the optimal weights ~w ∈ R
4n
.
It is obvious that this large number of possibilities can
not be set by hand. The next problem is that a forecast
of an adhesion failure is only possible if one knows in
which situations the system will fail.
Therefore, a learning method with training data
needs to be applied to find suitable weights. At first
one needs a measure if the robot fails in a situation
or not and determine important characteristics. The
identification of a drop off is done by an adhesion
score function S
A
(F
z
,x
F
,y
F
) : R
3
7→ [0, 1] which uses
two different indicators as given in equation 4:
S
A
(F
z
,x
F
,y
F
) =
max
S
A
F
(F
z
),S
A
P
(x
F
,y
F
)
(4)
The first indicator is the current downforce value
F
z
(equation 5) measured by the embedded load cells.
If F
z
is below threshold F
min
z
the robot falls down:
S
A
F
(F
z
) = 1−
max
0,
min
1,
F
z
− F
min
z
F
max
z
− F
min
z
(5)
The second measurement unit is the point of
downforce which describes the chance of robot tilt
(equation 6). If the distance of the downforce point
with coordinates x
F
and y
F
from the robot center is
too large (above a threshold d
max
) the robot drops off.
The used threshold values depend on system parame-
ters like weight, wheel distance or friction coefficient.
S
A
P
(x
F
,y
F
) =
max
0,
min
1,
q
x
2
F
+ y
2
F
d
max
(6)
Independent from the type of learning algorithm
one needs some experimental training data. To get
this data, the robot has to be faced with situations in
which the adhesion system reaches its limits and the
robot falls off (S
A
= 1) as well as situations which
are harmless or still manageable by the system (S
A
<
1). Each training set is a double array consisting of
a time value t ∈ {0,m − 1}, all meta data from the
considered behaviors and the adhesion score
1
S
A
(t)
at that timestep. Of course, the size m of the tables
varies from one dataset to another whereas the setup
of behaviors has to be fix.
In literature different learning and optimization
methods exist which can be used in general. There-
fore one needs to find a suitable approach to extract
the needed weight values out of the training data. Ar-
tifical neural networks e. g. are a classic method for
pattern recognition but will not fit in here because
of missing input-output samples. Another approach
is reinforcement learning which tries to optimize a
problem via trial-and-error. Nevertheless it is more
linked to a mapping from situations to actions than
for the given problem. Simulated annealing might be
an appropriate approach, but it does not seems to be a
good idea to follow and optimize only one solution in
the present case. Therefore, the principle of genetic
algorithms is applied to determine the best weights
(Gerdes et al., 2004). The idea is to update the evalu-
ation weights randomly until the desired performance
is achieved.
4 GENETIC ALGORITHM
As usual one needs a population P(s) of individu-
als at step s. Each individual has a chromosome c
with genes which can mutate randomly in a prede-
fined way to optimize the desired function. In this
case one individual consists of a vector of weights
~w = (w
a,0
,w
r,0
,w
sa,0
,...w
sr,n−1
) ∈ [−1, 1]
4n
which is
used for the weighted sum of n behaviors as shown
before. At the beginning of the process a set of indi-
viduals is created with random genes. In each opti-
mization step as illustrated in figure 2 the fitness F(c)
of all individuals is calculated which describes the
chance of an individual to survive. The next gener-
ation P
′
(s) is created by a selection of original indi-
viduals which are updated with certain probabilities
via genetic operations as described in section 4.2.
4.1 Evaluation of Individuals
Of course, the principle of behavior evaluation is not
limited to the given problem. However, the fitness
function is the most difficult part since it describes
the optimization problem and has to be set properly
to achieve the desired results. In this case an indi-
vidual is good if the evaluation function E (with the
1
From now on the results of functions will be shortened
like S
A
(t) = S
A
(F
z
(t), x
F
(t), y
F
(t)) for clarity.
ICINCO2012-9thInternationalConferenceonInformaticsinControl,AutomationandRobotics
120

Figure 2: One evolution step with current population, selec-
tion, mutation of survivors and the next generation.
weights) is a good prediction of the adhesion score S
A
in equation 4. As measuring unit, a rating function R
E
is used which compares the evaluation result of an in-
dividual with the adhesion score. At first, the weights
are used to calculate the evaluation value according
to equation 3 for each timestep t of one training set.
One receives a list of evaluation values E(t) over time
which have to be compared to the corresponding ad-
hesion score S
A
(t). The rating of weight evaluation
R
E
is done according to equation 7 and calculated for
each combination of individual and training set.
R
E
= −
m−1
∑
t=0
P
E∆
(t) −
k
∑
t=0
P
unw
E
(t) − M
unw
E
(7)
−
k+∆t
∑
t=k+1
P
des
E
1
(t) −
m−1
∑
t=k+∆t+1
P
des
E
2
(t) − M
des
E
This rating considers three aspects: At first, the
evaluation function E(t) should stay below the adhe-
sion rating S
A
(t), otherwise the rating value is dimin-
ished by a penalty P
E∆
according to equation 8. The
used functions and constants have been determined
carefully for an optimal and balanced rating function.
P
E∆
(t) =
((E(t) − S
A
(t)) · E(t))
3
, if E(t)>S
A
(t)
0 , else
(8)
The second aspect is the avoidance of unwanted
values which produce false alarms. This is split up
into a penalty based on the differences of evaluation
and adhesion rating P
unw
E
according to equation 9 and
a basic mallus M
unw
E
if at least one undesired value
exists (equation 10). S
haz
A
denotes a threshold for a
hazard which is set to 0.9, 10
10
and 10
9
are constants.
P
unw
E
(t) =
(E(t) − S
haz
A
) ·
max
E(t),S
A
(t)
3
·10
10
, if E(t)>S
haz
A
0 , else
(9)
M
unw
E
=
10
9
, if S
A
(t)<S
haz
A
∀t∈[0,k]∧∃E(t)≥S
haz
A
, t∈[0,k]
0 , else
(10)
The value k depends on the type of training set:
If the adhesion rating stayed below S
haz
A
the complete
dataset is processed here (equation 11), otherwise it
considers only the timespan to the timestep t
haz
at
which the adhesion rating reached a hazardous value
minus the double time ∆t. This describes the desired
timespan of the reaction time with ∆t ≤ t
react
≤ 2· ∆t.
k =
m− 1 , if S
A
(t)<S
haz
A
∀t∈[0,m−1]
t
haz
− 2· ∆t , else
(11)
In the same way a mallus and a penalty for miss-
ing desired values are applied, if the adhesion rating
S
A
of this data set is above the threshold at least once
(so that k < m− 1). The evaluation E(t) has to reach
1 within the range [k + 1, k + ∆t] for prediction, oth-
erwise mallus M
des
E
1
(equation 14) is added as well as
penalty P
des
E
1
in equation 12. Penalty P
des
E
2
from equa-
tion 13 tries to push the evaluation function above 1
over the remaining time steps until m− 1.
P
des
E
1
(t) =
(1− E(t))
3
· 10
10
, if E(t)<1∧E(t)<1∀t∈[k+1,k+∆t]
0 , else
(12)
P
des
E
2
(t) =
(1− E(t))
3
· 10
6
, if E(t)<1
0 , else
(13)
M
des
E
=
10
9
, if E(t)<1∀t∈[k+1,k+∆t]
0 , else
(14)
If p training sets are used the mean-square average
of the ratings is determined (equation 15):
R = −
v
u
u
t
1
p
·
p−1
∑
i=0
R
2
E
i
(15)
4.2 Fitness, Selection & Mutation
Based on the final rating value R the fitness F(c) of an
individual can be determined. Equation 16 shows this
calculation based on minimum and maximum values
for the rating value R
min
and R
max
(which can either
RiskPredictionofaBehavior-basedAdhesionControlNetworkforOnlineSafetyAnalysisofWall-climbingRobots
121
be set fix or dynamic based on lowest and highest ac-
tual rating values) and on a basic fitness F
bas
for all
|P| individuals of that population. The chance p(c)
of an individual c to survive depends on the ratio of
individual to population fitness (equation 16, right).
F(c) =
R(c)−R
min
R
max
−R
min
+
F
bas
|P|
1+
F
bas
|P|
, p(c) =
F(c)
∑
i∈P
F(i)
(16)
Since the exploration of the search space is most
important, crossover operations are not considered
here: “If optimality is sought, crossover may be dele-
terious” (Spears, 1993, page 231). In fact three dif-
ferent mutation types are used for adaption: A weight
can be updated with a small random offset. The used
probability p
off
m
is 0.75 that one weight of an indi-
vidual is adapted. Furthermore, an update with a
new random weight with probability p
rand
m
= 0.5 is
possible. Additionally all weights of an individual
can be changed with a random multiplication factor
f ∈ [0.9, 1.1]. The probability p
mul
m
that one individ-
ual is updated inside of the population is 0.1.
Since the values can skitter away it is useful to
keep the best individual inside of the population. On
the other side the population should get the chance
to expand in all directions. Therefore, this approach
additionally uses a kind of elitism function in a way
that there exists a certain chance that the best individ-
ual (that has been found in the past) will be injected
into the population again. Additionally, this chance
decreases over time if no better individual could be
generated to enlarge the evolution space and to reduce
the effect of local minima. The breakpoint R
bp
of the
learning procedure is reached if no rating R
E
i
of the
best individual gained a mallus M
unw
E
or M
des
E
. So far,
the algorithm is stopped manually.
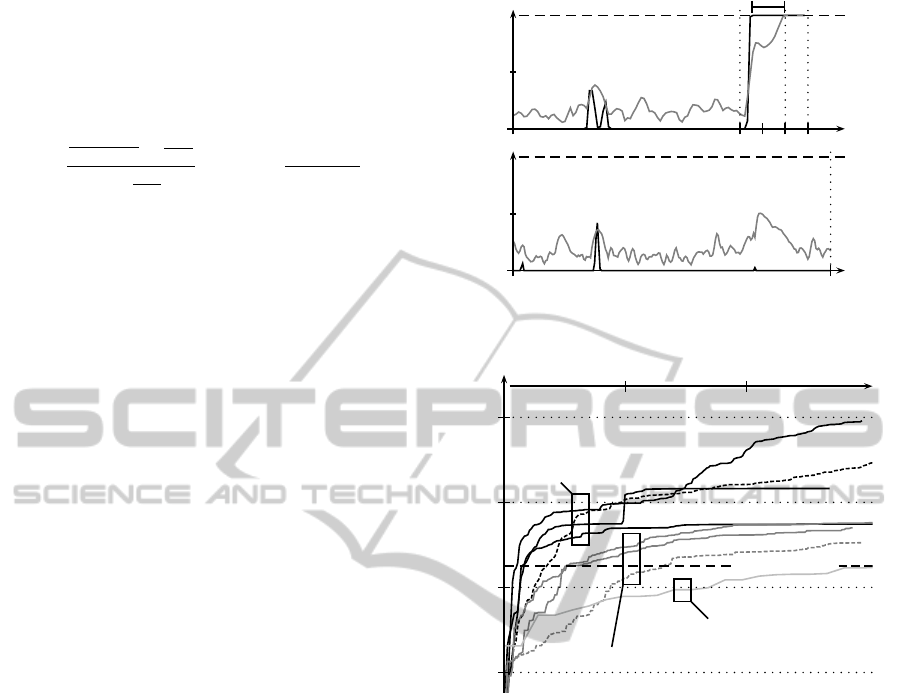
5 RESULTS AND MEASURES
Some exemplary results are given in figure 3. Here
the adhesion scores S
A
(gray) of two different data
sets and final evaluation values E (black) which are
limited to [0, 1] are shown. In the given experiment
10 training sets have been used to determine a set of
90 weights of 45 considered behavior values. In all
cases the robot was driven down a wall but at differ-
ent positions reaching from even and rough surfaces
to patches with deep grooves. The learning algorithm
using 100 individuals was able to train weights which
guarantee a certain reaction time t
react
and avoid false-
positives in the training sets. Figure 4 shows the in-
creasing evaluation values over time which are bet-
ter in cases of small populations (|P| = 100, black)
0.0
1.0
S
A
(t)
E(t)
t
react
t
k
∆t
∆t
t
haz
m-1
0.0
1.0
S
A
(t)
E(t)
t
k
Figure 3: Example for desired results after 1900 evolution
steps (approx. 1330s): If S
A
(t) reaches one E(t) should sig-
nal this beforehand (top).
-10
5
-10
7
R
bp
= −3.16 · 10
8
-10
9
-10
11
R
500 1000
t in [s]
|P | = 100
|P | = 1000
|P | = 10000
Figure 4: Enhancements of the rating value R of the best
individual over time with different population sizes |P|.
performing a faster evolution step compared to larger
populations. The dashed lines indicate experiments
without random multiplication (p
mul
m
= 0.0) with a
slower convergence at the beginning.
To evaluate the learning results the robot again
performs similar trajectories on the structured sur-
face with defects and cracks. Figure 5 shows reaction
times t
react
between detection (E(t) = 1) and drop off
(S
A
(t) = 1) while the robot tries to handle the deep
cracks. Again, evaluation E should signal a drop off
early enough to have enough time for counteractive
measures. The black bars indicate a more uniform
crack in contrast to a complex crack structure (gray
bars). In total, 31 test runs on a cracked structure
have been executed with only one false-negative, two
with a too short reaction time below 0.5s and five
runs with a reaction time larger than 3 s. Further ex-
periments have shown, that the behavioral situation
is completely different if the robot drives upwards so
another set of weights has to be trained for this case.
Beside the correct detection also the avoidance of
ICINCO2012-9thInternationalConferenceonInformaticsinControl,AutomationandRobotics
122

fn
0.5 1.0 1.5 2.0 2.5 3.0
4
2
#
t
react
∆t
2∆t
Figure 5: Reaction time t
react
in [s] and one false-negative
(fn) of examples while facing different cracks.
1.0
0.5
0.0
0.0 0.25
0.5 0.75 S
haz
A
1.0
E
max
S
max
A
◦•
fp
◦
◦
◦
◦
◦
◦
◦
◦
◦
◦
⋆
Figure 6: Maximum evaluation and rating values on differ-
ent rough terrains, ⋆ marks tolerated false-positives (fp).
false-positives is important. Therefore, the reaction
on rough terrain with defects has been tested which
do not lead necessarily to a drop-off. Figure 6 shows
12 test runs with only one false-positive (black circle)
and two detections (E
max
= 1, marked with ⋆) which
are tolerated because of S
max
A
> S
haz
A
. In practice, the
evaluation system has to be trained once and can be
applied to similar situations and setups.
Each detection of safety-critical situations is use-
less without counteractive measures. So far, a re-
versed replay of the robot trajectory is implemented.
The responsible behavior has been embedded into the
control system and is stimulated, if the evaluation
function E reaches a value of 1. In this case, the cur-
rent driving operation is cancelled and the last com-
mands are countervailed. The idea is that the way was
not dangerous so far so the robot should driveback the
same trajectory until a safe position has been reached
and the adhesion system can recover.
6 CONCLUSIONS
This paper presented a risk prediction approach for
wall-climbing robots. Based on training data a ge-
netic algorithm is used to find suitable weights for a
general evaluation function which is used here to pre-
dict an upcoming drop-off. Experiments have proven
the functionality of the approach and the benefit for
robot safety. The next step is to adapt the prediction
system to be able to handle different situations (e.g.
driving up or down) which need to use differing sets
of weights since one-fit-all-weights do not exist.
REFERENCES
Castelnove, M., Arkin, R., and Collins, T. R. (2005). Re-
active speed control system based on terrain rough-
ness detection. In IEEE International Conference on
Robotics and Automation, volume 1, pages 891–896.
Gerdes, I., Klawonn, F., and Kruse, R. (2004). Evolution¨are
Algorithmen. Vieweg Verlag, Germany, 1. edition.
Kelly, A. and Stentz, A. (1998). Rough terrain autonomous
mobility - Part 1: A theoretical analysis of require-
ments. Autonomous Robots, 5(2):129–161.
Kim, D., Sun, J., Oh, S. M., Rehg, J. M., and Bobick, A. F.
(2006). Traversability classification using unsuper-
vised on-line visual learning for outdoor robot navi-
gation. In IEEE International Conference on Robotics
and Automation (ICRA) 2006, pages 518–525.
Luk, B. L., Cooke, D. S., and others (2001). Intelligent
Legged Climbing Service Robot For Remote Inspec-
tion And Maintenance In Hazardous Environments. In
8th Conference on Mechatronics and Machine Vision
in Practice, pages 252–256.
Proetzsch, M., Luksch, T., and Berns, K. (2010). Develop-
ment of complex robotic systems using the behavior-
based control architecture iB2C. Robotics and Au-
tonomous Systems, 58(1):46–67.
Schmidt, D. and Berns, K. (2011). Behavior-based adhesion
control system for safe adherence of wall-climbing
robots. In 14th International Conference on Climb-
ing and Walking Robots (CLAWAR), pages 857–864.
Schmidt, D., Hillenbrand, C., and Berns, K. (2011). Om-
nidirectional locomotion and traction control of the
wheel-driven, wall-climbing robot, Cromsci. Robot-
ica Journal, 29(7):991–1003.
Shang, J., Bridge, B., Sattar, T., Mondal, S., and Brenner,
A. (2008). Development of a climbing robot for in-
spection of long weld lines. Industrial Robot: An In-
ternational Journal, 35(3):217–223.
Spears, W. M. (1993). Crossover or mutation. In Foun-
dations of Genetic Algorithms, volume 2, pages 221–
237.
Stavens, D. and Thrun, S. (2006). A self-supervised terrain
roughness estimator for off-road autonomous driving.
In Conference on Uncertainty in Artificial Intelligence
(UAI), pages 469–476.
RiskPredictionofaBehavior-basedAdhesionControlNetworkforOnlineSafetyAnalysisofWall-climbingRobots
123
