
Geographic Information System using ArcGIS 10
and Open Source MapWindow
Methodology and Comparative Study
Omar Al-Bayari, Balqies Sadoun, Jalal Al-Azizi and Samih Al Rawashdeh
Department of Surveying and Geomatics Engineering, AL-Balqa’ Applied University, Al-Salt, Jordan
Keywords: GIS, ArcGIS 10, Open Source MapWindow, GIS Client, Spatial Database System.
Abstract: Geographic Information System (GIS) is an IT system capable of capturing, storing, analyzing, and display-
ing geographically data. We present a comparison between ArcGIS 10 and MapWindow 4.0 in creating a
(GIS) for a study area to clarify the similarities and the differences. Upon the application of the GIS system
using the two mentioned different software tools, we will provide the methodology and a related compari-
son. The ESRI® ArcGIS is an integrated geographic information system (GIS) for managing a digital data-
base, working with maps and geographic information. It provides an infrastructure for making maps, analy-
sis, presentations of geographic information available for organizations, communities and openly on the
Web. MapWindow is free of charge, extensible geographic information System (GIS) that can be used as an
open-source alternative to desktop GIS to develop and distribute custom spatial data analysis tools. It is a
"Programmable Geographic Information System" that supports manipulation, analysis, and viewing of geo-
spatial data and associated attribute data in several standard GIS data formats. It is also considered a map-
ping tool, a GIS modeling system, and a GIS application programming interface (API); all in one conven-
ient redistributable package. It was developed by MapWindow Open Source Team to address the need for a
GIS programming tool that could be used in engineering research, without requiring end users to purchase a
complete GIS system, or become GIS experts.
We had used MapWindow in many applications and always proved efficient. We found Open Source
MapWindow GIS as efficient as the commercial GIS system for important applications (Mapping, Naviga-
tion, Tracking etc.) in addition to its being free of charge. We had been using it in our applications and re-
search work such as: OSGIS for BAU and in Navigation and Tracking to be used by interested users on the
web.
1 INTRODUCTION
Easy access to spatial data for a wide range of users
in governmental organizations and large companies
led to great development in the implementation of
Spatial Data Infrastructures (SDI) (Rajabifard and
Williamson, 2001), (Crompvoets et al., 2004).
Hundreds of new spatial portals and systems for
spatial data dissemination have been built worldwide
lately (GeoConnections, 2009). Building an SDI
requires a range of software tools that depend on
geospatial data provider, service provider, or data
user. To support these ongoing implementation
efforts, free and open source projects have started.
Reviews of Free and Open Source Software for GIS
(FOSS4GIS) and its utility have become more
common, as the free software solutions start to
replace proprietary software (Reid and Martin,
2001). Categories of GIS software have been
identified by Steiniger (Steiniger and Weibel, 2009),
(Steiniger and Hay, 1998), which include desktop
GIS, Spatial Database Management Systems (Spatial
DBMS), web map, server GIS, web GIS clients,
mobile GIS, and GIS libraries and extensions.
In the following we are comparing some of these
packages.
2 MapWindow
This is a mapping tool, a GIS modeling system, and
a GIS application programming interface (API)
which was developed by Dr. Daniel P. Ames and a
group of student programmers at Utah State
93
Sadoun B., Al-Bayari O., Al-Azizi J. and Al Rawashdeh S..
Geographic Information System using ArcGIS 10 and Open Source MapWindow - Methodology and Comparative Study.
DOI: 10.5220/0004167800930100
In Proceedings of the International Conference on Data Communication Networking, e-Business and Optical Communication Systems (ICE-B-2012),
pages 93-100
ISBN: 978-989-8565-23-5
Copyright
c
2012 SCITEPRESS (Science and Technology Publications, Lda.)

University (Appleman, 1998). It was developed to
address the need for a GIS programming tool that
could be used in engineering research and project
software, without requiring to purchase a complete
GIS system, or become a GIS expert. It is available
free of charge and can be sued to develop custom
spatial data analysis tools (http://www.map
window.org/). Developers can write Plug-ins to add
additional functionality such as models, special
viewers, hot-link, handlers, and data editors, and
pass these to users. It includes standard GIS data
visualization features, database functions such as
attribute table editing, shape file editing and data
converters. Dozens of Standard GIS formats are
supported, including Shape files, GeoTIFF, ESRI
format, ASCII and binary grids. It includes a
complete ActiveX component to instantly add GIS
capabilities to the user’s existing software product
(MapWinGIS; FOSS4G). Additional geo-processing
components are available for .NET-compatible
Languages. Components of MapWindow are:
-The Main Application: This is the central interface
where, the user may view data elements such as
Shape files and Grids and the Core Components
-The components which operate underneath. The
three main components are: (a) MapWinGISwhcih
is an ActiveX control which may be placed into
any project in any programming language that
supports ActiveX. This is the main map
component - if the user wants to write a program
that displayed shape data, for example, the user
could use this control for the display portion of the
user’s program. (b) MapWin Interfaces: This is
also called the "Plug-in Interface", this is a dll file
which will allow the user to write the user’s own
plug-ins to the main application. This may be done
from any programming Language which supports
the creation and use of Microsoft .NET 2.0
Dynamic Link Libraries (dlls). (c)
MapWinGeoProc: This is a .NET library of
geoprocessing functions, including tools for
managing projections, clipping and buffering. This
Library is under very active development with new
capabilities appearing Often.
3 ArcGIS 10
The ESRI® ArcGIS System is an integrated
geographic Information system (GIS) consisting of:
(a) Arc GIS Desktop software which is an integrated
suite of Advanced GIS applications
(b) Arc SDE® gateway which is an interface for
managing Geodatabases in a database management
system (DBMS)
(c) Arc IMS® software which is an Internet-based
GIS for distributing Data and services.
Arc GIS provides a framework for implementing
GIS for single user or for many users. It can be
extended with additional software, such as Arc Pad®
for Windows® CE devices.
Components of ArcGIS desktop are:
1.ArcMap: This is the GIS application used for all
map-based tasks including cartography, map
analysis, and editing. In this tool, the user basically
works with maps. Arc Map permits viewing a map, a
geographic data and a layout view to implement
advanced GIS tasks.
2. Arc catalog: This is an application to organize
and manage all GIS data, with browsing tools to find
geographic information, managing metadata and to
define the schema structure for the geographic data
layers.
3. Arc toolbox: Arc Toolbox is a simple application
containing many GIS tools used for geoprocessing
tasks (GIS Fundamentals).
ArcGIS Desktop License Levels:
ArcGIS allows better data analysis, relationship
definition, pattern recognition and optimal informed
decision making. It is available in three license
levels: basic, standard, or advanced (formerly
ArcView, ArcEditor, or ArcInfo). They share the
core applications, user interface, and development
environment, but each provides more GIS
functionality
ArcInfo is the highest level of licensing and
functionality. It is a full featured GIS system with
access to all functions. It includes advanced data
analysis and modeling, feature management and
processing and data conversion for CAD, raster,
DBASE, and coverage formats
(http://en.wikipedia.org/).
ArcEditor is a standard ArcGIS level of licensing
and functionality. It provides the standard and basic
ArcGIS functions such as complete GIS data editing
capabilities, automate quality control, and use of
raster-to-vector conversion.
ArcView is the basic ArcGIS level of licensing and
functionality. It is a powerful toolkit for mapping,
reporting, and map-based analysis such as visual
modeling, and spatial analysis of a process or
workflow, creation of interactive maps from files,
database, and online sources, and generation of
reports and charts.
ArcReader is a free application to view and use
maps created with ArcMap and the optional ArcGIS
ICE-B 2012 - International Conference on e-Business
94
Publisher extension. ArcReader works on maps in
PMF format. Because Arc Reader is free, any user
can install it easily.
4 STUDY AREA AND
METHODOLOGY
For application and comparison purposes we used
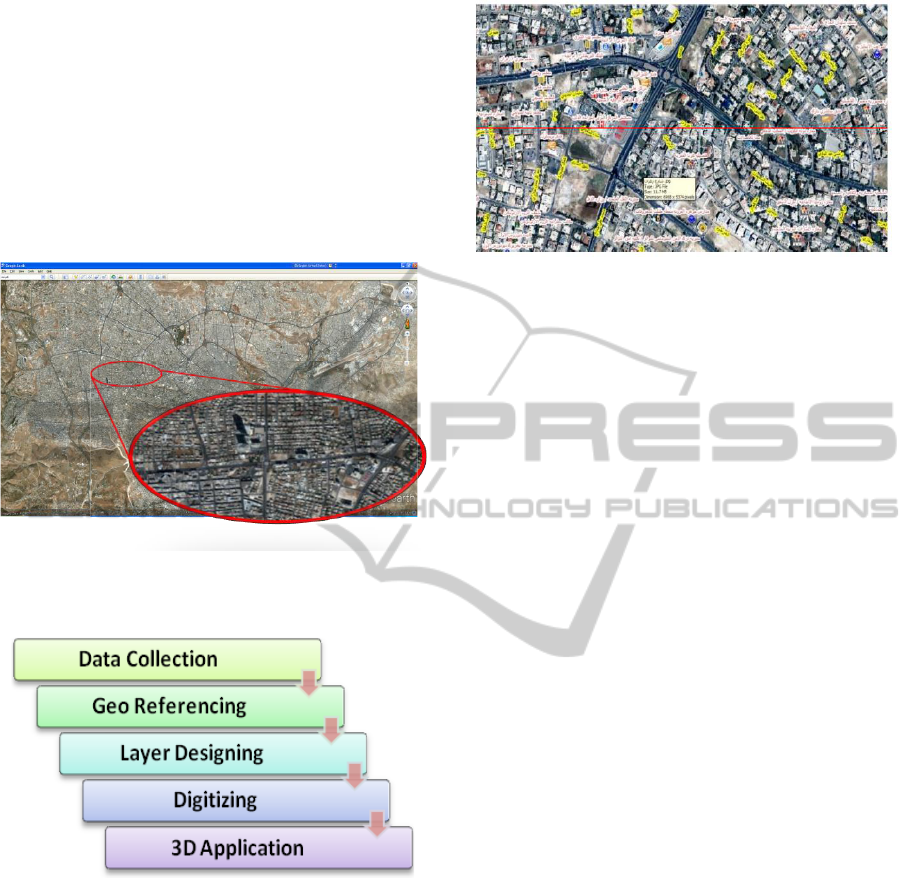
the Zahran Street area in Amman; see Figure 1.
Figure 1: Amman Image and Zahran Street.
Figure 2 presents the flowchart of the methodology
to create a GIS for the study area using ArcGIS 10.
Figure 2: Flowchart of GIS Processing using ArcGIS 10.
- Data Collection: We collected data from Satellite
images with coverage for Zahran Street area in
Amman, Jordan (Google Earth); see Figure 3.
Google Earth Program is a virtual global map and
geographic information program which maps the
Earth's surface by the superimposition of images of
varying resolution obtained from satellite imagery,
aerial photography and GIS 3D globe
(http://en.wikipedia.org/). The internal coordinate
system of Google Earth is geographic coordinates
(latitude/longitude) on the World Geodetic System
of 1984 (WGS84) datum. It uses digital elevation
model (DEM). The Google Earth Program is used
for creating clip in JPG file to get the needed
Figure 3: Image Clip for Zahran Area (Google Earth).
information such as buildings, streets, and hotels;
see Figure 3.
- Projection: This is the process of translating real
3D world data to flat 2D view using a systematic
mathematical transformation. We used Jordan
Transverse Mercator (JTM) coordinate system (the
modified Universal Transverse Mercator -UTM).
- Georeferencing: This deals with is assigning map
coordinates and spatial location. It is also associating
geographic data to a known coordinate system so
that it can be viewed, queried, and analyzed with
other geographic data. After applying the suitable
projection upon the images, we applied the
georeferencing process.
- Database Design: Upon adding a dataset to
ArcMap, a layer is created. Each layer represents
geographic data which relates the spatial data to the
attribute data in order to achieve a brief view of the
area. Many layers were created such as roads,
buildings, land parcels, schools, mosques,
embassies, banks, museums, churches, restaurants,
among others. Creating layers in Arc Catalog needs
the selection of multiple proprieties such as layer
name, type, the used projection, number of column,
and data type.
- Digitizing: This is the process of converting
features into a digital format to create new data; see
Figures 4 and 5.
- Other applications using ArcMap Include:
x The Hyperlink tool where you can access
documents or Web pages related to features.
x Converting AutoCAD File to Geodatabase:
We generated our contour map using AutoDisk
Land Develop 2004 then we transferred it to
shape file in ArcGIS 10 using ArcCatalog
(Figure 6). Next, we createed a TIN in ArcMap.
Triangulated Irregular Network (TIN): This is a
digital data structure used in GIS for the
representation of a surface. It comprises a triangular
network
of vertices, which represent the physical
re 1: Amman Image and Zahran Street.
Geographic Information System using ArcGIS 10 and Open Source MapWindow - Methodology and Comparative Study
95
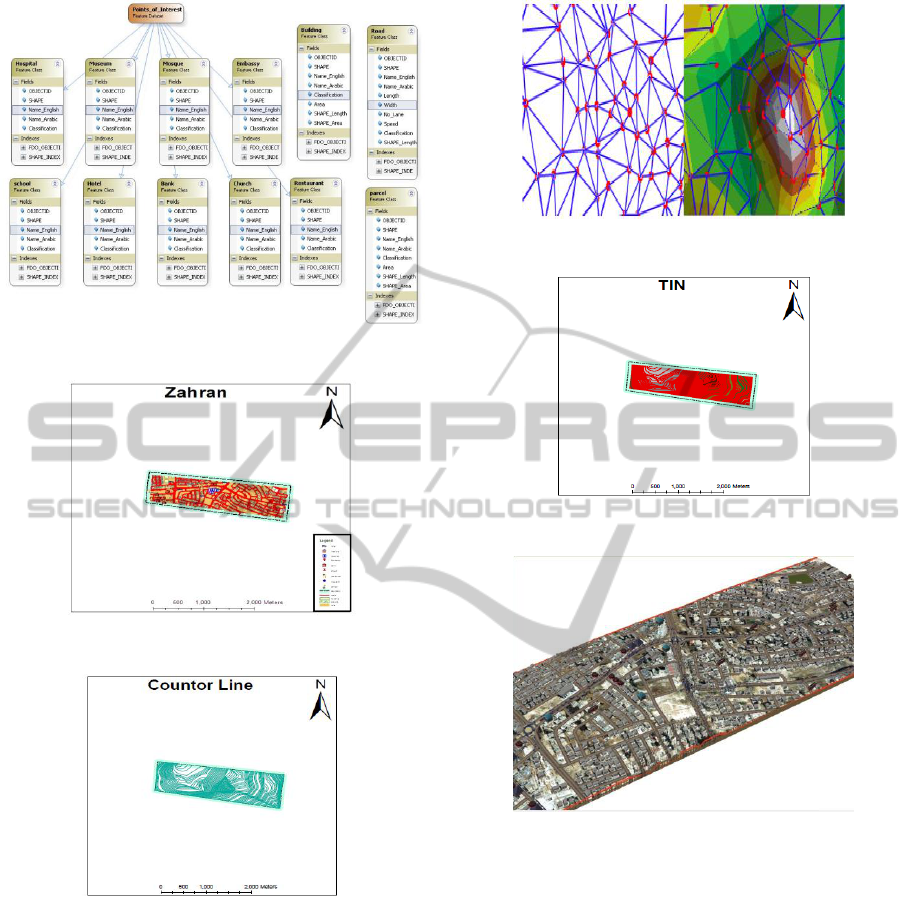
Figure 4: Database Design Process.
Figure 5: Digitizing of Zahran Street.
Figure 6: The Contour Map.
land surface or sea bottom (mass points), with
associated coordinates in three dimensions
connected by edges to form a triangular tessellation;
see Figures 7 and 8.
TINs are often derived from the elevation data of a
raster digital elevation model (DEM). An advantage
of using a TIN over a raster DEM in mapping and
analysis is that the points of a TIN are distributed
variably based on an algorithm that determines
which points are most needed to have an accurate
representation of the terrain (Figure 8). Data input is
therefore flexible and fewer points need to be stored
Figure 7: Nodes, Edges, and Faces of a TIN.
Figure 8: A TIN Layer.
Figure 9: A 3D Model View.
than in a raster DEM, with regularly distributed
points.
Creating 3D Scene: ArcScene is a 3D visualization
application that allows viewing the GIS data in 3D
form (Figure 9). The purpose is to provide 3D fly-
through, to overlay many layers of data in a 3D
environment, and every layer of these in the 3D
view can be handled differently.
MapWindow OSGIS: Data Processing contains the
package of layers designing, digitizing, georefer-
encing and projection as in the flowchart shown in
Figure 10. For the same application area, we created
another GIS system using MapWindow software.
ICE-B 2012 - International Conference on e-Business
96
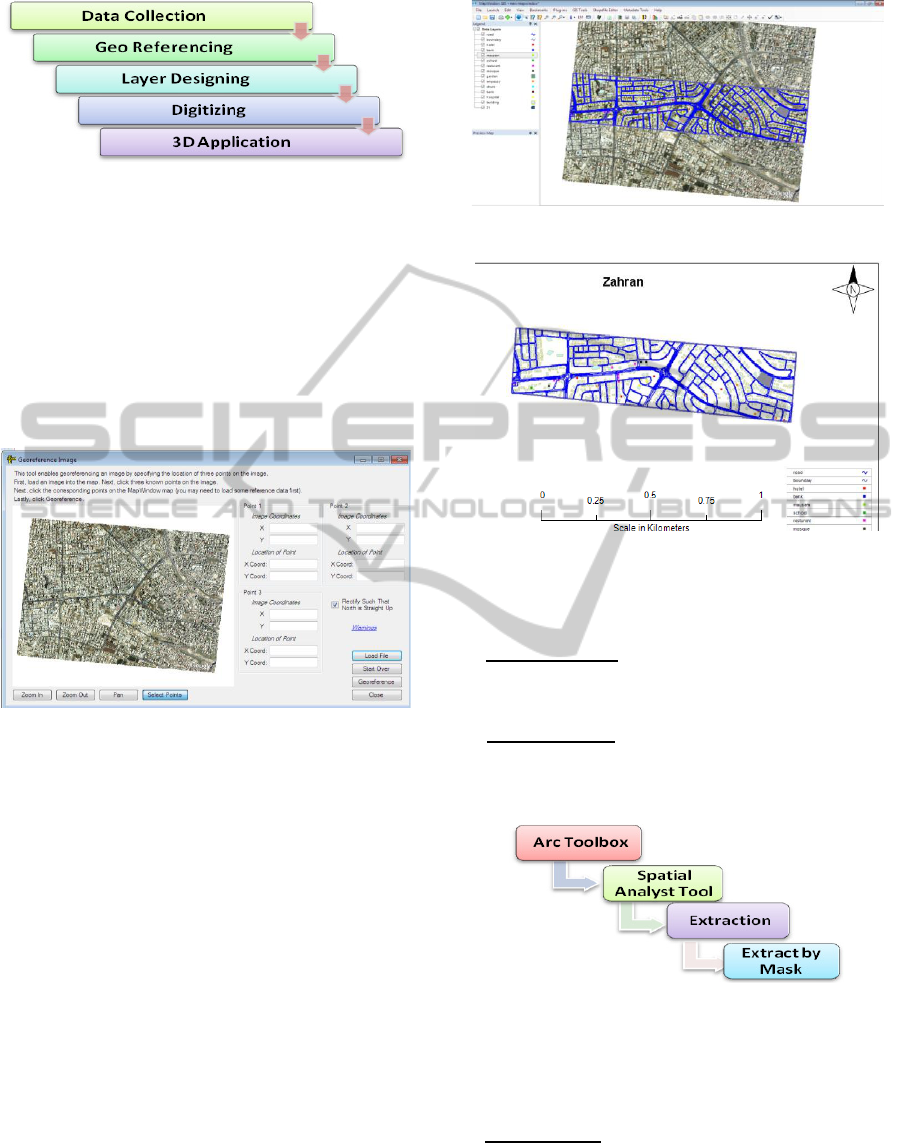
Figure 10: Flowchart of GIS using MapWindow 4.0.
- Data Collection: Satellite Images with coverage
for the same area, the Zahran Street area, were taken
from Google Earth Program (JPG file). Using
Mapwindow, we got the same clip for the study area.
- Georeferencing: The correct location and shape of
features need a framework for defining real-world
locations, using established coordinate system, such
as Cartesian coordinate system (before or after
digitizing; see Figure 11).
Figure 11: Mapwindow Georeferenceing.
- Projection: We used the JTM projection in meters
to apply the same projection on the images that was
taken from Google Earth pro. After applying the
suitable projection upon the images, we applied the
georeference on them, both X and Y coordinates are
georeferenced with projected coordinate system. By
inputting the coordinates, three points are needed
(Figure 11). After georeferencing and assigning
projection to the image we could add rectifying
image to Map Window.
- Layer Designing: Map Window creates shape files
by adding shape file editor. Locate the “where do
you want to save the shape file?” and locate the
shape file type. Automatically shape file will be
added on project. Before starting edit shape file, we
need to assign projection to shape file by GIS tools
(Figure 12). The final screen after editing all shape
files can be seen in Figure 13.
Figure 12: Final Screen after Editing Shape Files.
Figure 13: Final map.
Comparison between ArcGIS 10 and
MapWindow 4.0:
a) Georeferencing:
- ArcGIS 10 requires four points or more while
MapWindow needs only three points.
b) Clip extraction:
- ArcGIS 10 extracts the cells of a raster that
correspond to the areas defined by a mask; see
Figure 14.
Figure 14: Extraction Steps in ArcGIS 10.
- MapWindow cannot perform extraction. In our
project, we build shape file (boundary) to define the
limits of the work area (Figure 15).
c) Geodatabase:
- In ArcMap 10, we built geodatabase from Arc
Catalog (Figure 16). It provides a catalog window to
organize and manage various types of geographic
information for ArcGIS Desktop. The kinds of
information
that can be organized and managed in
Geographic Information System using ArcGIS 10 and Open Source MapWindow - Methodology and Comparative Study
97
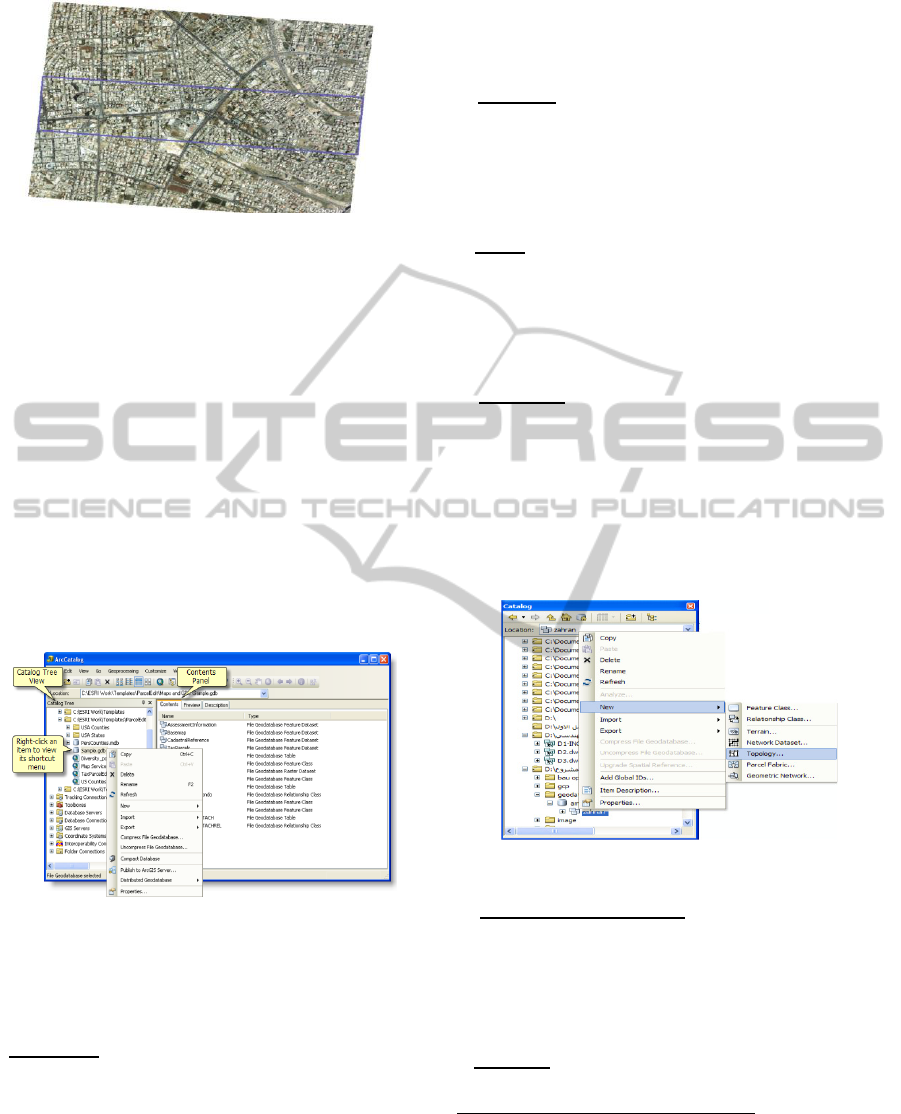
Figure 15: Limits of the Work Area.
ArcCatalog include Geodatabases, raster files, map
documents, globe documents, 3D scene documents,
and layer files, Geoprocessing toolboxes, models,
and Python scripts, GIS services published using
ArcGIS servers, standards-based metadata for these
GIS information items and much more. ArcCatalog
organizes these contents into a tree view that allow
the user to organize the GIS datasets and ArcGIS
documents in order to search and find information
items, and manage them. Arc Catalog is used to
Organize the GIS contents, manage geodatabase
schemas, search for and add content to ArcGIS
applications, document contents, manage GIS
servers, and manage standards-based metadata. All
layers in the geodatabase have the same coordinates
and projection.
Figure 16: Geodata base building in ArcCatalog.
In MapWindow, we cannot build a geodatabase, but
we can build shape file and for every shape file we
must determine the projection.
d) Digitizing:
In ArcMap 10: In order to start digitizing, the user
needs to open the Editor Toolbar and start an editing
session. There are several options for making the
edit more efficient.
In MapWindow: In order to start editing the shape
files, the user needs to select the shape file editor
from the plug-in, then select the shape file that the
user needs to edit from legend and then the user
should press from the toolbar and start editing. To
finish the editing process, the user just needs to right
click.
e) Symbols:
In ArcMap 10, the user can use the default symbol
or change some basic properties such as color and
size or modify any of the properties and create own
symbols.
In MapWindow, we can change color and size only.
f) Snap:
In ArcMap 10, Snapping allows the user to create
features that connect to each other so the edits are
more accurate.
In MapWindow: From shapefile Editor, the user
needs to snap to all layers.
g) Topology:
In ArcMap 10: In general, topology is a set of rules
which define the relationship between points, lines,
and polygons. This can enable us to add a topology,
point to new, and then click topology generation
within right-click of the feature dataset to which you
want topology ; see Figure 17.
In MapWindow, the user cannot perform topology
operations.
Figure 17: Topology in ArcMap10.
h) Inputting the Attributes:
In ArcMap 10, by right clicking on layer, the user
can select open attribute Table (you must open the
editor by select start editing).
In MapWindow, the user needs to open attribute
table but do not need to open the editor.
i) Layouts:
In ArcMap 10, from the layout view, the user can
work with the map layout elements, such as titles,
north arrows, and scale bars, along with the data
frame, all of which are arranged on a page (Figure
19).
In MapWindow, the user cannot perform layout
without the select print option; see Figure 19.
ICE-B 2012 - International Conference on e-Business
98
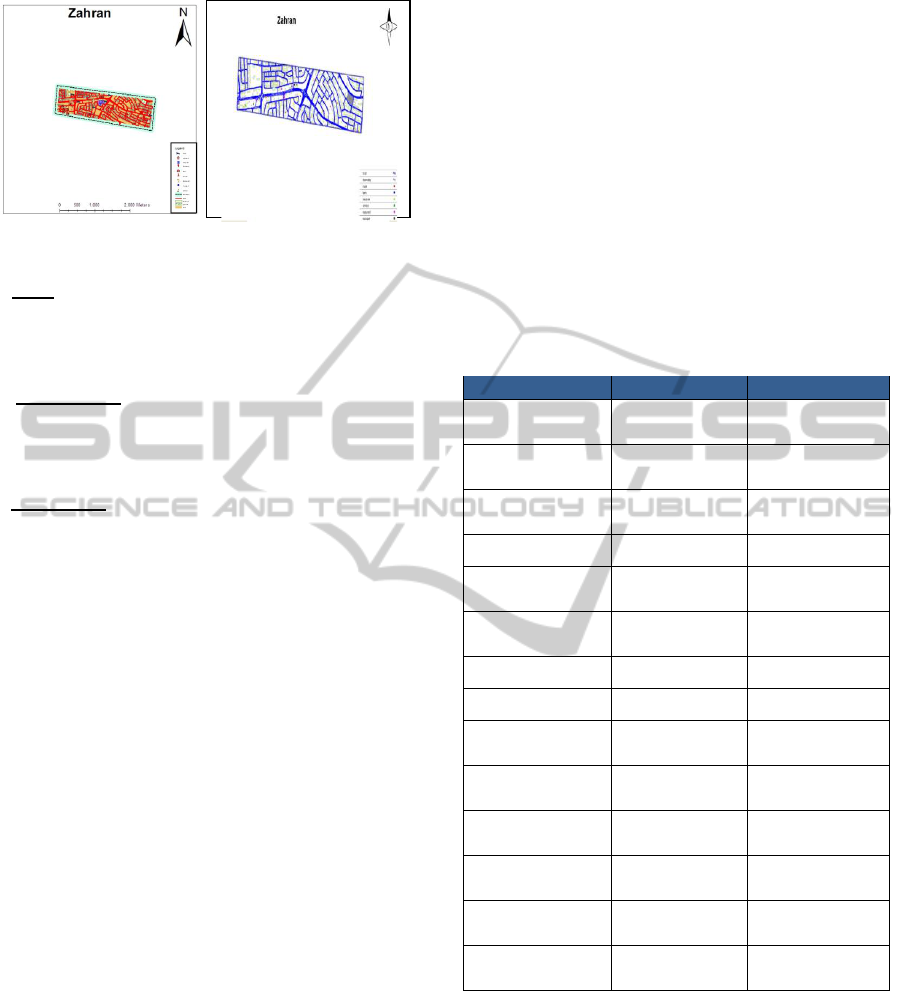
Figure 19: Layout in ArcMap 10 and MapWindow.
j) TIN:
In ArcMap 10, the user can generate TIN from 3D
Analyst toolbar; see Figures 6 and 7. While in
MapWindow, the user cannot generate TIN layers.
k) 3D Analyses:
In ArcMap 10, the user can generate 3D model using
Arc Scene (Figure 8), while in MapWindow, he
cannot generate a 3D model.
l) Hyperlinks:
In ArcMap 10, the user can do hyperlinks, while in
Mapindow, hyperlinks do not exist.
5 SUMMARY AND
CONCLUSIONS
To sum up, we can make the following comments
and points:
- OSGIS was developed to address the need for a
GIS programming tool, without the need to
purchase a complete GIS system, or become a GIS
expert.
- OSGIS is an alternative to desktop GIS that can
be used as information system to distribute data to
others and to develop custom spatial data analysis
tools.
- OSGIS proved to be perfectly functional for
many important applications such as mapping,
navigation, tracking, among others.
- Users could use MTS as a platform and build a
specialized application that can do the needed
functions in order to distribute or sell directly to
end users.
- OSGIS is a mapping tool, a GIS modeling
system, and a GIS application programming
interface (API) all in one convenient redistributable
package.
- Developers can write Plug-ins to add additional
functionality such as models, special viewers, hot-
link, Handlers, and data editors and pass these
along to users.
- Dozens of Standard GIS formats are supported,
including Shape files, GeoTIFF, ESRI format,
ASCII and binary grids. Moreover, it includes a
complete ActiveX component, which may be used
to instantly add GIS capabilities to the user’s
existing software product. Additional geo-
processing components are available for .NET-
compatible Languages.
In conclusion, we are presenting an overall
comparison between Arc GIS 10 and Map Window
software tools; see Table 1.
Table 1: Comparison Between ArcGIS 10 and Map Win-
dow software tools.
Item
ArcGIS
MapWindow
Cost
Expensive
Free (open-
source)
Georeference
(4) points at
least
Needs only 3
points
Extraction
Extraction by
arctoolbox
you cannot do
Extraction
Database
geodatabase
shape file
Digitizing
start
editing
We can do
digitizing
Symbols
Change color ,
size and shape
Change color
and size only
End Digitizing
stop editing
right click
Snapping
Automatic
Automatic
Topology
you can do
topology
you cannot do
topology
Input the
attribute
can input the
attribute
can input the
attribute
layout
from layout
view
from
print
TIN
you can do
TIN
you cannot do
TIN
3D
you
can
do 3D
you cannot do
3D
Hyperlinks
you can do
hyperlink
you cannot do
hyperlink
REFERENCES
A. Rajabifard and I. P. Williamson, “Spatial Data infra-
structures: Concepts, SDI Hierarchy and Future Direc-
tions”, Proceedings of Geomatics 2001, Australia,
2001.
J. Crompvoets, A. Bregt, A. Rajabifard and I. P. William-
son, “Assessing the Worldwide Developments of Na-
tional Spatial Data Clearinghouses”, International
Geographic Information System using ArcGIS 10 and Open Source MapWindow - Methodology and Comparative Study
99

Journal of Geograph Inf Sci, Vol. 18, pp. 665-689,
2004.
GeoConnections, “Status Report to the United Nations:
Canadian Geospatial Data Infrastructure, Ottawa: Nat-
ural Resources, Canada, 2009.
J. Reid, F. Martin, “The Open Source Movement and Its
Potential in Implementing Spatial Data Infrastruc-
tures”, Proceedings of the International Symposium on
Spatial Data Infrastructure, Melbourne, Australia,
2001. Available from: http://www.geo.unizh.ch/ pub-
lications/sstein/pubothers/reid_ martin_ foss_ for_
sdi_ 2001.pdf
S. Steiniger, R. Weibel,” GIS Software– A Description in
1000 Words, 2009. Available from: http:// www.geo.
unizh.ch/publications/sstein/gissoftware_steiniger2008
.pdf
S. Steiniger, G. J. Hay, Free and Open Source Geographic
Information Tools for Landscape Ecology, Ecol Inf
Journal, Vol. 4, pp. 183-195, 2009.
D. Appleman,”Developing COM/ ActiveX Component
with Visual Basic 6, First Edition, SAMS, United
States, 1998.
http://www.mapwindow.org/.
MapWinGIS Reference Manual: A Function Gnent, Lu-
lu.com, Morrisville, North Carolina.
An Extensible, Interface-Based, Open Source GIS Para-
digm: MapWindow 6.0 Developer Tools for the Mi-
crosoft Windows Platform. Free and Open Source
Software for Geoinformatics (FOSS4G), Cape Town,
South Africa.
GIS Fundamentals; a First Text on Geographic Infor-
mation Systems, 3rd Edition. Eider Press, New York.
http://www.esri.com/software/arcgis/about/gis-for-
me.html.
http://en.wikipedia.org/wiki/ArcInfo
http://en.wikipedia.org/wiki/Google_Earth
ICE-B 2012 - International Conference on e-Business
100
