
Interactive Visual Intervention Planning
Interactive Visualization for Intervention Planning in Particle Accelerator
Environments with Ionizing Radiation
Thomas Fabry
1
, Christian Braesch
2
and Bruno Feral
1
1
CERN, Geneva, Switzerland
2
SYMME, Universit
´
e de Savoie, Polytech Annecy-Chamb
´
ery, Chamb
´
ery, France
Keywords:
Interactive Data Visualization, Volume Rendering, Ionizing Radiation, Intervention Planning.
Abstract:
Intervention planning is crucial for maintenance operations in particle accelerator environments with ionizing
radiation, during which the radiation dose contracted by maintenance workers should be reduced to a mini-
mum. In this context, we discuss the visualization aspects of a new software tool, which integrates interactive
exploration of a scene depicting an accelerator facility augmented with residual radiation level simulations,
with the visualization of intervention data such as the followed trajectory and maintenance tasks. The visual-
ization of each of these aspects has its effect on the final predicted contracted radiation dose. In this context,
we explore the possible benefits of a user study, with the goal of enhancing the visual conditions in which the
intervention planner using the software tool is minimizing the radiation dose.
1 INTRODUCTION
Particle physics is a branch of modern physics that
studies the smallest known constituents of matter.
Particle physics research necessitates large and com-
plex scientific instruments: particle accelerators and
detectors (Wille, 2001; Myers, 2012). Accelerators
boost beams of particles to high energies before they
are made to collide with each other or with station-
ary targets. Detectors observe and record the results
of these collisions. The circulation and collisions of
high energy beams in the accelerators and detectors
have an undesirable consequence, namely the radio-
logical activation of some of the components of these
facilities.
The complexity of particle accelerators and de-
tectors lead to the frequent necessity of maintenance
operations. To protect maintenance personnel from
ionizing radiation during interventions in its parti-
cle accelerators and detectors, the so-called ALARP
or ALARA approach (As Low As Reasonably Pos-
sible or Achievable (UKA, 2012; Grupen, 2010)) is
mostly used, which consists of justifying, optimizing
and limiting the dose received by all those who need
to work on activated components.
A core issue during the planning of a maintenance
intervention in a facility with ionizing radiation is the
minimization of the equivalent dose contracted by the
maintenance workers during the intervention. This
optimization cannot easily be automated, since the
practical feasibility of working conditions during the
intervention tasks requires human assessment based
on experience. The visual conditions in which the in-
tervention planner can perform the optimization are
important, and the several layers of data involved in
the planning process, i.e. the facility geometry, the
radiation levels and the intervention trajectory, there-
fore need to be appropriately visualized.
In this context, we develop a tool that brings state-
of-the-art visualization techniques, similar to the ones
found in medical imaging for example, to intervention
planning to optimize human interventions in infras-
tructures in emitting ionizing radiation. We also sub-
mit the visualization method used in the developed
tool to a user test to evaluate the effectiveness of the
visualization and its perception by the user.
In the remainder of this article, first, we describe
the important concepts of the planning of an interven-
tion in an environment with ionizing radiation in sec-
tion 2. Second, we discuss how visualization plays
an important role in this application and what the re-
quirements are for the application, and propose a soft-
ware tool for this purpose in section 3. Next, we dis-
cuss and explore the benefits of a user test for the
interactive visualization and intervention planning in
section 4, and finally conclude the article in section 5.
585
Fabry T., Braesch C. and Feral B..
Interactive Visual Intervention Planning - Interactive Visualization for Intervention Planning in Particle Accelerator Environments with Ionizing Radiation.
DOI: 10.5220/0004212505850592
In Proceedings of the International Conference on Computer Graphics Theory and Applications and International Conference on Information
Visualization Theory and Applications (IVAPP-2013), pages 585-592
ISBN: 978-989-8565-46-4
Copyright
c
2013 SCITEPRESS (Science and Technology Publications, Lda.)

2 PLANNING OF
AN INTERVENTION IN
AN ENVIRONMENT WITH
IONIZING RADIATION
2.1 Quantifying Ionizing Radiation
Ionizing radiation is radiation that has the power to
liberate an electron from an atom or molecule, thus
producing ions (atoms or molecules with an electric
charge). Because ions are chemically reactive, they
can cause biological damage when produced in living
tissue. Ionizing radiation can result in e.g. radiation
sickness and cancer, but also has practical uses in re-
search, medicine, and other areas. Sources of ionizing
radiation are ubiquitous, such as cosmic rays and nat-
urally occurring radioactive materials, but ionizing ra-
diation can also be created, with artificially created ra-
dioisotopes, X-ray tubes or particle accelerators, etc.
Ionizing radiation exists in various forms. The
particles of which ionizing radiation consists must
have a sufficiently high energy and interact with
the atoms of a target. These particles can be pho-
tons (electromagnetic radiation), electrons, positrons,
muons, protons, alpha particles, heavy atomic nuclei
or neutrons.
Workers that perform maintenance in an envi-
ronment with ionizing radiation contract a radiation
dose D. The unit of radiation dose is the gray (Gy),
which quantifies the amount of radiation energy ab-
sorbed by a kilogram of matter and is equivalent to
J/kg.
Different types of radiation cause different levels
of damage to living tissue. This issue is addressed by
the equivalent dose H, which is calculated by multi-
plying the radiation dose D with a weighting factor Q
that is defined based on the radiation type. The unit
of equivalent dose is the sievert (Sv). The effective
dose equivalent H
eff
is the equivalent of H for partial
body irradiation (Cossairt, 1999; Grupen, 2010).
2.2 Intervention Planning Concepts
An intervention I is a set of tasks T
k
that need to
be completed by the maintenance worker, each with a
specific description and an estimated duration τ
k
:
I = {T
k
; k = 0,1,. ..,K}. (1)
Task T
0
corresponds to the entrance of the facility by
the worker; task T
K
corresponds to the exit of the fa-
cility.
A trajectory T consists of a series of locations
m
i
, with i = 0,1,.. .,N. At each location m
i
, a main-
tenance worker will spend an amount of time denoted
by t
i
. The path between two consecutive locations
m
i
and m
i+1
is denoted by S
i
, with i = 0, 1, ... ,N − 1.
Each path S
i
is taken by the maintenance worker at a
velocity v
i
.
The planner of an intervention will decide on a
trajectory T with an intervention I in mind, thus con-
structing a map between I and T . As a result:
∀ T
k
∈ I : T
k
is assigned to a location m
i
and t
i
= τ
k
,
∀ m
i
∈ T and 6 ∃ T
k
assigned to location m
i
: t
i
= 0,
with K ≤ N.
The equivalent dose H contracted by the mainte-
nance worker performing an intervention I mapped
on a trajectory T is calculated as the sum of the ra-
diation received at the locations m
i
and the radiation
received over the paths S
i
between the locations:
H(I ,T ) =
N
∑
i=0
t
i
˙
H(m
i
) +
N−1
∑
i=0
Z
m
i+1
m
i
v
−1
i
˙
H(s)ds, (2)
where s is a point on the path S
i
. The radiation rates
˙
H are available from simulations of the activation of
the facility equipment or from manual measurements
performed previously in the irradiated facility.
A trajectory is optimal when the equivalent dose
H is minimal, respecting the constraints that all tasks
require a minimal execution time and that the veloc-
ities v
i
have to stay within the abilities of the main-
tenance worker. Some aspects of the trajectory op-
timization could be automated: the locations m
i
can
be placed such that the total amount of received ra-
diation is minimized. However, other aspects require
human assessment based on experience, such as prac-
tical considerations on the location from where a task
is executed, or the velocity with which a specific part
of the trajectory can be taken.
3 VISUALIZATION
FOR INTERACTIVE
INTERVENTION PLANNING
3.1 Approach
To make sure that the optimization of the radiation
dose coming with the human intervention in infras-
tructures emitting ionizing radiation can be performed
in the best possible conditions, the visualization of the
particle accelerator and detector facilities, the radia-
tion levels and the intervention data plays an impor-
tant role.
Radiation level simulations are a tool that are
much used to assess the radiological conditions of ac-
celerator facilities where maintenance interventions
IVAPP2013-InternationalConferenceonInformationVisualizationTheoryandApplications
586
will be necessary. The FLUKA package is a tool
that can be used for the simulation of radiation lev-
els and other radiological quantities after operation
of accelerator and detector infrastructure (FLU, 2012;
Battistoni et al., 2007; Fass
`
o et al., 2005). The re-
sults of these simulations are most often visualized
using the FLUKA Advanced Interface (FLAIR) (Vla-
choudis, 2009) in a 2D way (see figure 1 for an exam-
ple of a FLAIR visualization of a radiation level simu-
lation), and this is also what is typically used for com-
munication between Radiation Protection experts and
other persons involved in maintenance operation plan-
ning at accelerator facilities (Vollaire and Widorski,
2011). Other software programs have been developed
to allow visualization of FLUKA simulation results,
such as SimpleGeo (Theis, 2012; Theis et al., 2006).
SimpleGeo is an interactive solid modeler, which is
made for implementing geometries for particle trans-
port problems based on Constructive Solid Geome-
try (CSG). Together with the DaVis3D plugin (DaV,
2012), SimpleGeo allows interactive visualization of
two-dimensional cuts of FLUKA voxel geometries.
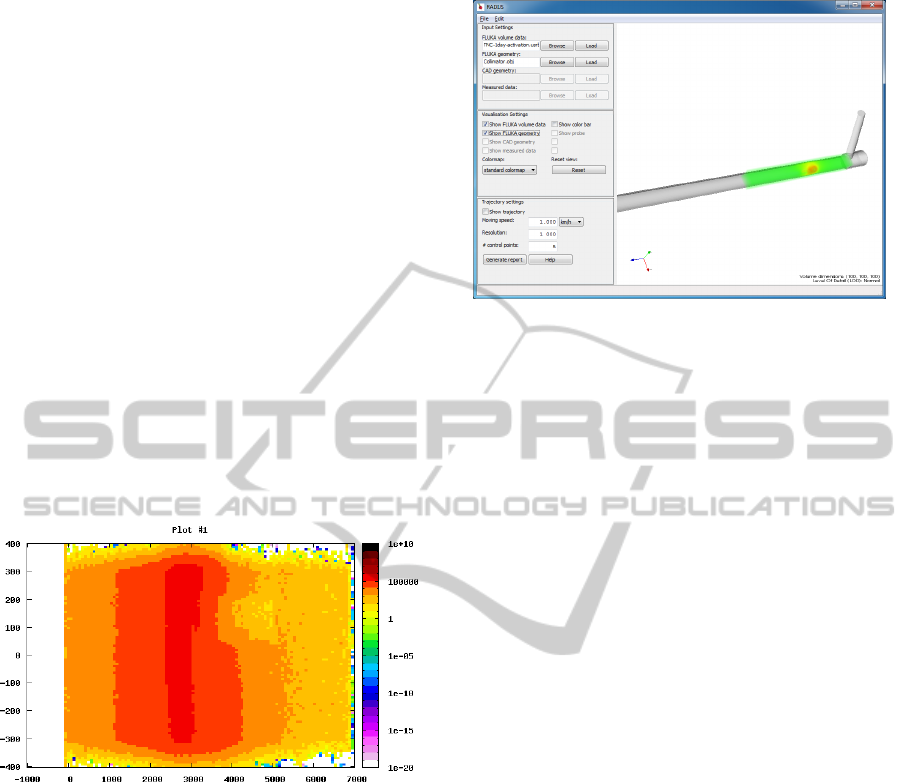
Figure 1: A typical FLAIR visualization of radiation levels.
There is however no tool that can enhance the in-
tervention that is advanced enough to help interven-
tion planners and, intuitive enough to be interesting
for the maintenance workers, has 3D display possi-
blilities for both the models of the facilities and the
FLUKA simulation data, offers the possibility to per-
form interactive visual inspection of the radiation lev-
els, construct trajectories, and can calculate the result-
ing radiation dose contracted during a planned inter-
vention.
We opted to develop intervention planning soft-
ware in Python (pyt, 2012), and to use The Visualiza-
tion Toolkit (Schroeder et al., 2006) for the visualiza-
tion aspects of the intervention planning. For the de-
velopment of the graphical user interface (GUI), we
chose to make use of wxPython (Rappin and Dunn,
2006). Because major attention has to be paid to the
requirement of an intuitive graphical user interface al-
lowing fast and flexible visualization, trajectory cre-
Figure 2: A screenshot of the software’s Graphical User
Interface, showing the volume rendering of a radiation dose
simulation in the TNC tunnel at CERN. The geometry of
the cavern is shown as well and is partly translucent to be
able to have an overall view on the situation.
ation, and reporting, the user interface (UI) is as much
as possible decoupled from the back-end of the soft-
ware.
Figure 2 shows a screenshot of the GUI of the tool
that was developed, illustrating the volume rendering
of the example radiation dose rates in the TNC tunnel
at CERN (Charitonidis et al., 2011).
In summary, the intervention planning software
requires appropriate visualization of the facility ge-
ometry, the radiation levels and the trajectory infor-
mation, as well as tools for interaction with them.
In addition, the software has to provide an interface
where the total radiation dose can be assessed and the
resulting trajectory is summarized. We thus devel-
oped a new software tool to be in line with the needs
that are detailed in the following subsections.
3.2 Interactive Visualization of
the Facility Geometry and
the Radiation Levels
The intervention planner software offers an interface
for the user where he can select the file containing the
geometry of the facility as well as the file containing
the applicable radiation levels. To get a good insight
into the work conditions in the facility, several tools
are available to interact with the geometries and to
assess the radiation levels at specific points.
Due to the nature of FLUKA simulation data, fre-
quently used at CERN, and the requirement of a clear
visualization of the working conditions, volume ren-
dering is the natural choice to visualize the facility ge-
ometry and the radiation levels. We consider volume
rendering to be a very intuitive volume visualization
technique, compared to e.g. volume slicing. Volume
InteractiveVisualInterventionPlanning-InteractiveVisualizationforInterventionPlanninginParticleAccelerator
EnvironmentswithIonizingRadiation
587
rendering has been around for many years (Levoy,
1988; Drebin et al., 1988). Recently, the development
and improvement of off-the-shelve GPUs has led to
the proposition of several interactive advanced volu-
metric illumination models (Ritschel, 2007).
3.3 Interactive Visualization of
the Trajectory Information
The trajectory is represented by a three-dimensional
cardinal spline. Splines are an ideal mathematical
representation of the trajectory, since they are piece-
wise defined and possess a high degree of smoothness
at the points where their polynomial pieces connect,
i.e. at the locations m
i
. In addition, splines are very
intuitive to work with and allow to design and control
complex curves.
The number of locations is easily adjustable by the
user through the GUI, and the locations can be dis-
placed by the user to shape the spline into the trajec-
tory that the maintenance worker will follow. To illus-
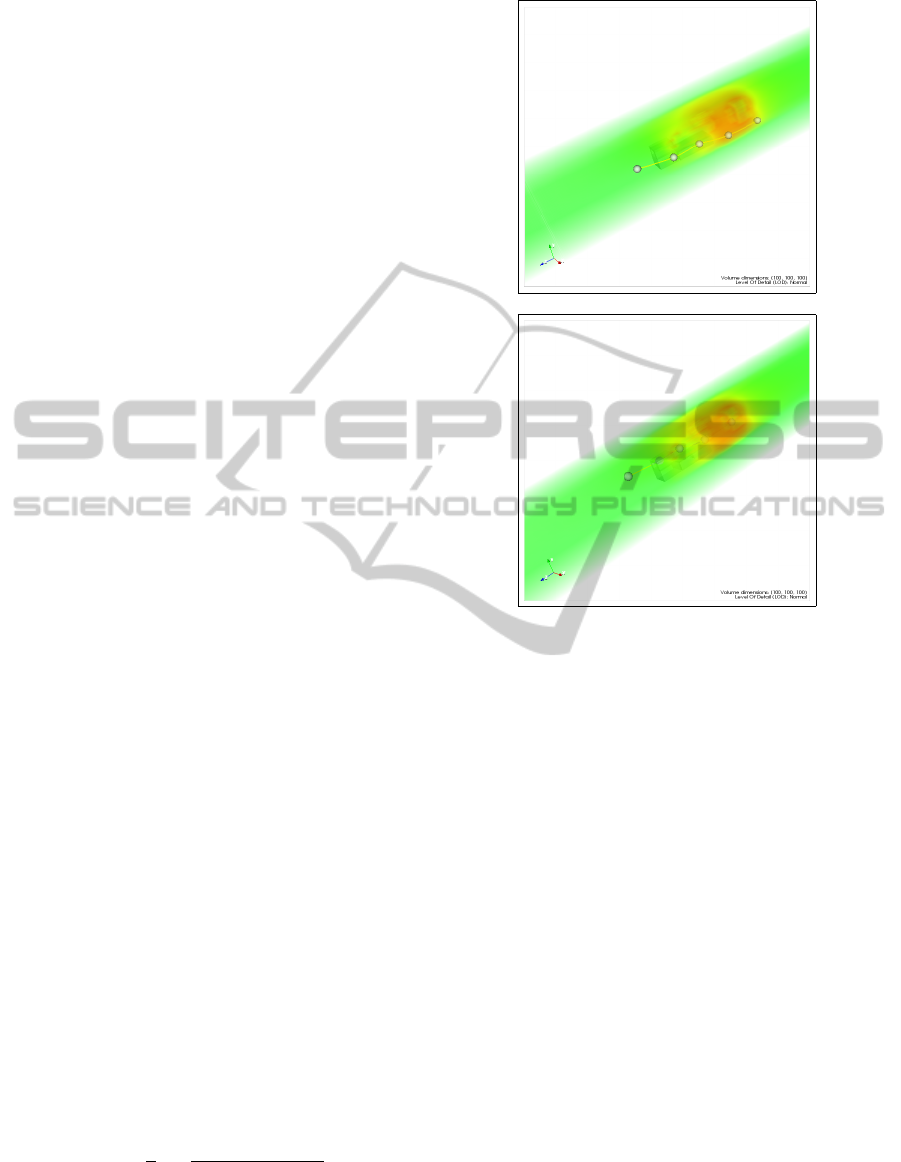
trate the importance of trajectory optimization, Fig-
ure 3 shows two possible trajectories through the TNC
tunnel. The dose contracted during the trajectory vi-
sualized in Fig. 3(a) proves to be 25% higher than
the dose contracted when following the trajectory in
Fig. 3(b). These hypothetical trajectories are merely
an illustration of the principle but indicate that small
changes in an intervention can lead to much smaller
exposure: in this case passing at the right side of an
activated piece of equipment leads to a considirable
reduction in dose. The volume rendered data is com-
ing from a realistic simulation of the dose levels in an
existing facility.
3.4 Calculation of the Equivalent Dose
and Trajectory Report
The core of the application is the calculation of the
equivalent dose H received by a worker over a user-
defined trajectory T through the simulation volume,
as defined in Section 2.2. To calculate H, the tra-
jectory spline is discretized into n segments, creating
a series of consecutive points s
j
on the spline, with
j = 0,1,. .., n. The number of discretization steps
can be controlled by the user; the default value is
n = 1000. Using the trapezoidal rule, equation (2)
can now be calculated as:
ˆ
H =
N
∑
i=0
t
i
˙
H(m
i
) +
1
v
n
∑
j=0
˙
H(s
j
) +
˙
H(s
j+1
)
2
ks
j
s
j+1
k.
(3)
Increasing the value of n has a positive influence
on the accuracy of
ˆ
h. However, one should keep in
(a)
(b)
Figure 3: Two possible trajectories for a maintenance inter-
vention in the TNC tunnel at CERN. The equivalent dose
contracted during the trajectory depicted in (a) proves to be
25% higher than the dose contracted during the trajectory
depicted in (b).
mind that the overall accuracy of equation (3) also de-
pends on the accuracy of the radiation rates
˙
h, which
are obtained from simulations or from (sparse) man-
ual measurements, both with limited accuracy.
At the end of an intervention planning, the soft-
ware offers the possibility to generate a trajectory re-
port. This report lists the sources of the trajectory
planning (input files, units, . . . ); the trajectory infor-
mation and the results of the planning (computed re-
ceived dose, trajectory length, . . . ).
4 USER TEST
Since the use of a 3D visualization tool for the plan-
ning of interventions in facilities emitting ionizing ra-
diation is not implemented yet in the facilities it is
designed for, a user test is needed to prove that the
application is useful to the intervention planner. The
main goals of the user test we are proposing are, first,
to qualitatively prove the usefulness of the 3D visu-
IVAPP2013-InternationalConferenceonInformationVisualizationTheoryandApplications
588

alization for the user, and second to make way for a
larger user test, using more quantitative variables, in
order to discover the optimal settings for the 3D vi-
sualization. We also set a secondary goal, namely the
quantitative comparison of two different color maps
for the volume rendering visualization of the radiation
level simulations. We evaluate this using the quantita-
tive measures that are subject of the optimization dur-
ing the planning of the maintenance operations. The
appropriate use of color visualization is seen as a very
important, and one of the most fundamental subjects
in visualization (Silva et al., 2007). We thus want to
test whether the choice of the colormap has indeed an
important effect on the user experience, and if it has
an effect on the optimization process that the user is
performing in this application.
In scientific visualization literature, many publica-
tions of user tests and user test designs can be found.
However, these user tests deal almost exclusively with
the effectiveness of one visualization method on the
user perception, without incorporating the context of
a concrete application. For instance, many user stud-
ies can be found on the influence of different illumi-
nation models on 3D visualization on user perception
of static computer-generated images (Wanger, 1992;
Gribble and Parker, 2005; Ropinski et al., 2010; Lin-
demann and Ropinski, 2011;
ˇ
Solt
´
eszov
´
a et al., 2011).
In contrast to this, our user test design is conceived to
take the interactive context of the trajectory planning
application into account. Furthermore, the user test
will also contribute to abate the relative scarceness of
volume rendering applications user studies. Indeed,
perceptual studies are scarcer in volume rendering ap-
plications than in surface rendering applications (Lin-
demann and Ropinski, 2011).
4.1 Material and Methods
As the user test is mainly a feasibility test for the de-
veloped software concept, the most important vari-
able that was recorded was the qualitative apprecia-
tion of the user on the usability of the tool. This was
done by asking for comments after the user test in-
stance was performed. The other recorded variables
were:
• H
rec
: the computed expected integrated equivalent
radiation dose received by the radiation worker
when he would run this trajectory at a constant
speed,
• l
rec
: the length of the trajectory that was con-
structed by the user and
• n
rec
: the number of control points the user used to
construct the trajectory.
In addition to this, the full session information is
recorded: all of the variables that are needed to re-
produce the view the user had at the end of his ses-
sion, including visualization, camera and interaction
parameters.
These parameters are recorded as the result of the
user test: a controlled possible real-life scenario of
a planning of an intervention. The user was shown
real-life simulation of example radiation dose rates in
the TNC tunnel at CERN. The TNC tunnel is part
of the infrastructure where the HiRadMat facility is
located (Efthymiopoulos et al., 2011). The HiRad-
Mat facility will be used to investigate the impact of
high energy particle beams on different materials.The
residual radiation dose rates originate from a FLUKA
simulation of beam impact on beam equipment for
the Large Hadron Collider (LHC) (Charitonidis et al.,
2011). The radiation doses were shown using the
GPU ray casting volume rendering algorithm as im-
plemented in VTK (Schroeder et al., 2006; VTK,
2011). This volume rendering was overlayed on a
transparent visualization of the geometry of the tun-
nel, as conceived and used for the FLUKA simula-
tion.
For the secondary goal of the user test, two color
maps were shown to the user: the standard, much-
used and much-contested rainbow color map (Bor-
land and Taylor II, 2007) and a continuous diverging
color map claimed to be well suited to scientific vi-
sualization (Moreland, 2009). The order of the color
maps in the user tests was randomized to mitigate the
effect of familiarity the user might get the second time
he perfoms the manual trajectory optimization. The
qualitative of the colormap is measured according to
the three recorded variables discussed above.
The scenario of the test is a scheme where a main-
tenance worker has to enter the facility through a
given entrance location, go to a given location to per-
forme a maintenance operation on a particular piece
of equipment, and leave the facility through a given
exit location. To let the user simulate this, the lo-
cations of the entrance, maintenance and exit points
where given as fixed points on a dummy trajectory.
This dummy trajectory had a number of control points
that the user can move in order to alter the trajectory.
In addition, the user is given the possibility to sup-
press or add control points in order to be able to make
a more detailed trajectory (see figure 4). In every user
session, the user had to perform these actions twice,
using a visualization with different color maps.
In this context, the user was asked to construct a
trajectory that he thinks is optimal, in terms of radi-
ation the maintenance worker would undergo, given
the constraints and the visualization of the simulated
InteractiveVisualInterventionPlanning-InteractiveVisualizationforInterventionPlanninginParticleAccelerator
EnvironmentswithIonizingRadiation
589
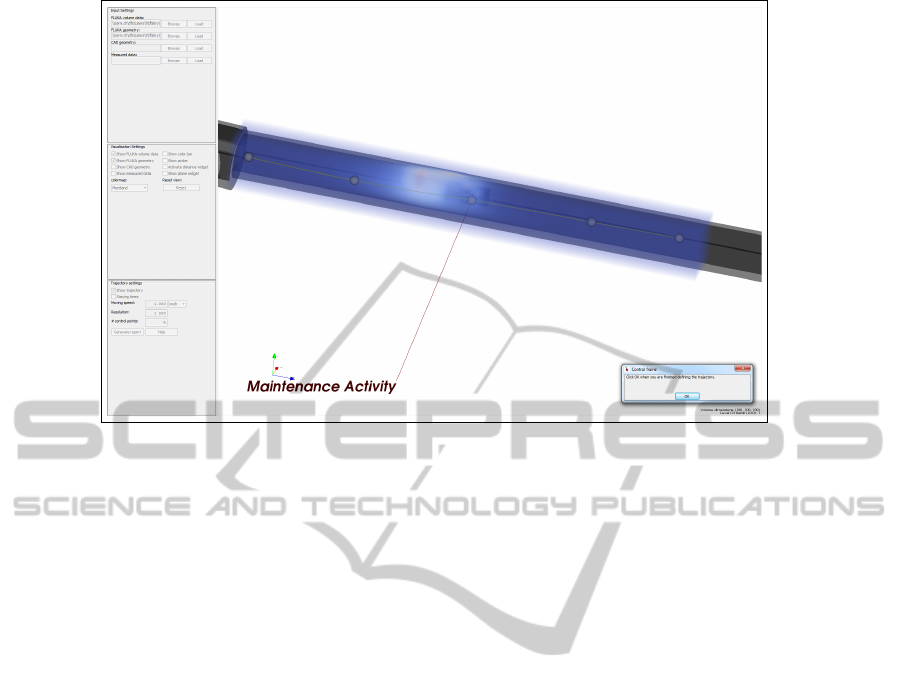
Figure 4: The interface shown to the user performing the user test. The begin and end points and the control point marked
”Maintenance Activity” are fixed. The user can alter the given trajectory by displacing the remaining control points, as well
as any additional control points that he can add.
radiation dose rates. In order for the test to be as
controlled as possible, most of the software user con-
trolled settings/features were disabled. The user was
given no real-time feedback in terms of resulting dose
of the planned trajectory.
The user test was performed 10 times, by 7 dif-
ferent subjects. All of the subjects were more or less
familiar with the type of facilities that our research
is being done for, but only one of them was famil-
iar with the particular facility used for the user test.
3 subjects did the user test twice. None of the sub-
jects is professionally involved in maintenance plan-
ning, what gives us the possibity to assess if it will
be feasible to use this tool not only in the interven-
tion planning but also to give the maintenance work-
ers an idea of the tasks they will have to perform and
the relation of these tasks to the relative radiation lev-
els they lead to. Furthermore, the fact that the user
test subjects are not professionally involved in main-
tenance planning will allow us to have stronger indi-
cations on the user-friendlyness of the software. The
interval between two tests performed by the same user
was always more than 2 weeks.
4.2 Results
As for the qualitative feasibility test, all of the sub-
jects were convinced of the potential of the given
tool. None of them had comments on the visualiza-
tion. There were some comments on the controls of
the 3D navigation. These comments are very interest-
ing and will be dealt with for the next version of the
user test. They are however directly not relevant to
the results of this paper.
As for the quantitative discriminatory test between
the two color map, box plots of the measured vari-
ables, per color map, can be found in figure 5. We
performed paired two-tailed t-tests on the three mea-
sured variables. The results found are:
• a t-value of p(9) = 0.821, p = 0.43 for the
computed expected integrated equivalent radia-
tion dose received by the radiation worker when
he would run this trajectory at a constant speed,
meaning that the computed expected integrated
equivalent radiation doses are not significantly
different for the trajectory plannings with the dif-
ferent color maps;
• a t-value of p(9) = 0.609, p = 0.56 for the length
of the trajectory that was constructed by the user,
meaning that the trajectory lengths are not signif-
icantly different for the trajectory plannings with
the different color maps and
• a t-value of p(9) = 0.137, p = 0.89 for the number
of control points the user used to construct the tra-
jectory, meaning that the number of control points
the user preferred to make the trajectory are not
significantly different for the different color maps.
4.3 Discussion
From the results of the user tests, we cannot con-
clude that there is a significant difference between the
two color maps. We can thus conclude that for this
particular test, the color map is not of large impor-
IVAPP2013-InternationalConferenceonInformationVisualizationTheoryandApplications
590
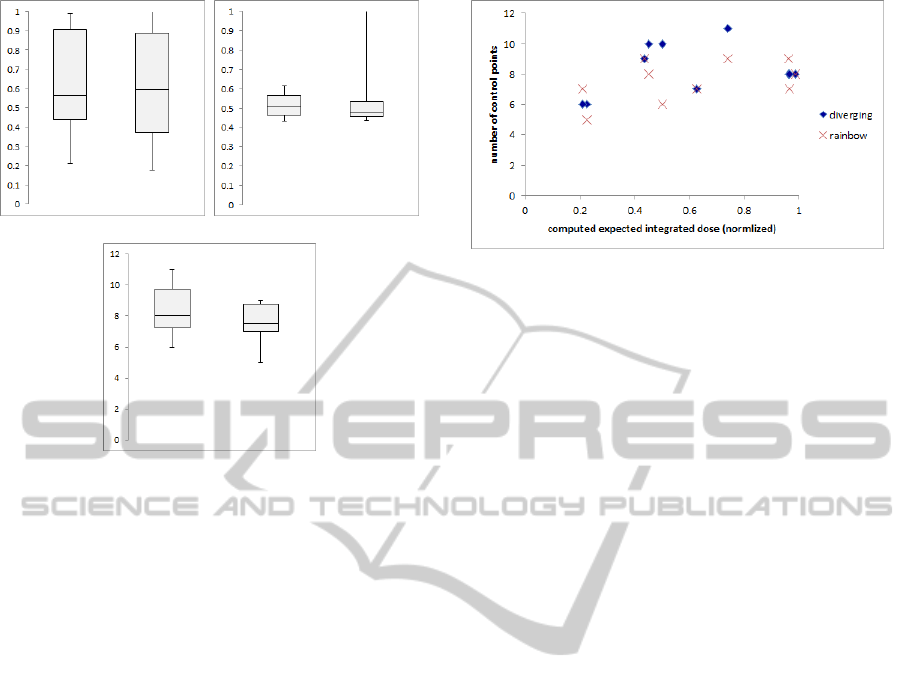
(a) (b)
(c)
Figure 5: Boxplot of the measured variables: 5(a) the com-
puted expected integrated equivalent dose (normalized),
5(b) the length of the constructed trajectory (normalized)
and 5(c) the number of control points used in the trajectory.
On the left the results of the user test, the data visualised
using the continuous diverging color map, for the data on
the right the rainbow color map was used.
tance for obtaining good results in operation planning
in facilities emitting ionizing radiation. The result is
however of limited strength, because of the relatively
small sample of users and the very small number of
scenarios. While we could have obtained more con-
clusive result with more users, we think that the main
improvement in the user test can be made with letting
the user optimize operation in more different facilities
and scenarios.
The Student t-test for the number of control points
is however leading to a p-value of 0.89, so that we can
almost, with a significance level of α = 0.1, exclude
that the user prefers more or less control points with
one or the other color map. This could have been a
sign that the user is better able to minimize the ra-
diation dose over the trajectory with one color map.
This means that we can almost reject the hypothe-
sis that the user uses more control points to specify
the trajectory in the case of the continuous diverging
color map, because he considers to be better able to
constuct a detailed trajectory in this case. This con-
clusion is however also not evident when we plot the
normalized computed expected integrated equivalent
dose against the number of control points used per
user test instance (see figure 6). More user tests are
needed to confirm this hypothesis.
Figure 6: The number of control points plotted against the
normalized computed expected integrated equivalent dose
per user test instance.
In general, relying on the qualitative results of the
user test, we can conclude from this test that the de-
veloped tool is well-suited for the intended purpose.
The user comments are very positive and make the
way for an extensive user test. Every user acknowl-
edged the possibility to better plan maintenance inter-
ventions using this tool.
For the color map part of the user test, we can-
not conclude that the continuous diverging color map
is outperforming the rainbow color map, which was
expected before the test. This can be caused by the
relatively small number of user tests performed, or it
can mean that the color map is not a critical factor in
this application. Both outcomes are potentially inter-
esting, but will have to be confirmed in a future, more
extensive, test.
5 CONCLUSIONS
AND OUTLOOK
Particle accelerators and detectors used in particle
physics research are subject to ionizing radiation and
their components can become activated. To protect
the maintenance personnel from ionizing radiation
during interventions, the radiation dose received by
the workers during an intervention has to be mini-
mized. Our goal is to provide interactive visualization
means to plan an intervention which enables mini-
mization of the contracted radiation dose, taking prac-
tical conditions concerning maintenance tasks into ac-
count. This optimization cannot easily be automated
and therefore requires human assessment. The visu-
alization of the several layers of data involved in the
planning process, i.e. the facility geometry, the radi-
ation levels and the trajectory, therefore needs to be
clear, intuitive and interactive.
In this work, we started with a description of the
important concepts of the planning of an intervention
InteractiveVisualInterventionPlanning-InteractiveVisualizationforInterventionPlanninginParticleAccelerator
EnvironmentswithIonizingRadiation
591

in an environment with ionizing radiation, and dis-
cussed how visualization plays an important role in
this application. We proposed a software tool for this
purpose in section 3, and discussed and explored the
possibilities of a user test for the interactive visualiza-
tion and intervention planning tool.
ACKNOWLEDGEMENTS
This research project has been supported by a Marie
Curie Early Initial Training Network Fellowship of
the European Community’s Seventh Framework Pro-
gramme under contract number (PITN-GA-2010-
264336-PURESAFE).
REFERENCES
(2011). VTK 5.8.0 Documentation. http://www.vtk.
org/doc/release/5.8/html.
(2012). The official FLUKA site. http://www.fluka.org.
(2012). Python Programming Language – Official Website.
http://www.python.org.
(2012). UK Health and Safety at Work etc. Act 1974.
http://www.legislation.gov.uk/ukpga/1974/37l.
(2012). Visualization of FLUKA Voxel
Geometries with DaVis3D. http://
theis.web.cern.ch/theis/simplegeo/voxels.htm.
Battistoni, G., Cerutti, F., Fass
`
o, A., Ferrari, A., Muraro,
S., Ranft, J., Roesler, S., and Sala, P. R. (2007). The
FLUKA code: description and benchmarking. AIP
Conference Proceedings, 896(1):31–49.
Borland, D. and Taylor II, R. M. (2007). Rainbow color map
(still) considered harmful. IEEE COMPUT GRAPH,
27:14–17.
Charitonidis, N., Efthymiopoulos, I., Theis, C., and
Vincke, H. (2011). Prompt, activation and back-
ground radiation studies for the hiradmat facility
of CERN/SPS. Technical Report CERN-DGS-2011-
039-RP-TN, CERN.
Cossairt, J. (1999). Radiation Physics for Personnel and
Environmental Protection.
Drebin, R. A., Carpenter, L., and Hanrahan, P. (1988). Vol-
ume rendering. SIGGRAPH Comput. Graph., 22:65-
74.
Efthymiopoulos, I., Hessler, C., Gaillard, H., Grenier, D.,
Meddahi, M., Trilhe, P., Pardons, A., Theis, C., Chari-
tonidis, N., Evrard, S., Vincke, H., and Lazzaroni, M.
(2011). HiRadMat: A New Irradiation Facility for
Material Testing at CERN. Technical Report CERN-
ATS-2011-232.
Fass
`
o, A., Ferrari, A., Ranft, J., and Sala, P. (2005).
Fluka: a multi-particle transport code. Technical Re-
port CERN-2005-10, INFN/TC 05/11, SLAC-R-773,
CERN, INFN, SLAC.
Gribble, C. P. and Parker, S. G. (2005). An experimental de-
sign for determining the effects of illumination mod-
els in particle visualization. In Proc. 2nd symposium
on Applied perception in graphics and visualization,
pages 175–175, New York, NY, U.S.A. ACM.
Grupen, C. (2010). Introduction to Radiation Protection.
Springer Berlin Heidelberg.
Levoy, M. (1988). Display of surfaces from volume data.
IEEE COMPUT GRAPH, 8(3):29 –37.
Lindemann, F. and Ropinski, T. (2011). About the influ-
ence of illumination models on image comprehension
in direct volume rendering. IEEE T VIS COMPUT
GR, 17(12):1922 –1931.
Moreland, K. (2009). Diverging color maps for scientific
visualization. In Proc. Int. Symposium on Advances in
Visual Computing: Part II, ISVC ’09, pages 92–103,
Berlin, Heidelberg. Springer-Verlag.
Myers, S. (2012). Review article: The engineering
needed for particle physics. Phil. Trans. R. Soc. A,
370(1973):3887–3923.
Rappin, N. and Dunn, R. (2006). wxPython in Action.
Ritschel, T. (2007). Fast GPU-based Visibility Computation
for Natural Illumination of Volume Data Sets. Pages
57–60.
Ropinski, T., D
¨
oring, C., and Rezk-Salama, C. (2010). In-
teractive volumetric lighting simulating scattering and
shadowing. In Proc. IEEE Pacific Visualization Sym-
posium, pages 169–176.
Schroeder, W., Martin, K., and Lorensen, B. (2006). The Vi-
sualization Toolkit. An Object-Oriented Approach To
3D Graphics. Kitware, 4 edition.
Silva, S., Madeira, J., and Santos, B. (2007). There is more
to color scales than meets the eye: A review on the use
of color in visualization. In Proc. Int. Conf. Informa-
tion Visualization, pages 943 –950.
Theis, C. (2012). SimpleGeo - solid modeling
for particle transport Monte Carlo simulations.
http://theis.web.cern.ch/theis/simplegeo.
Theis, C., Buchegger, K., Brugger, M., Forkel-Wirth, D.,
Roesler, S., and Vincke, H. (2006). Interactive three-
dimensional visualization and creation of geometries
for Monte Carlo calculations. NUCL INSTRUM
METH A, 562(2):827 – 829.
Vlachoudis, V. (2009). FLAIR: A Powerful But User
Friendly Graphical Interface For FLUKA. In Proc.
Int. Conf. on Mathematics, Computational Methods &
Reactor Physics.
Vollaire, J. and Widorski, M. (2011). Radiation Protec-
tion aspects of Linac4 commissioning & installation.
https://edms.cern.ch/document/1141968.
ˇ
Solt
´
eszov
´
a, V., Patel, D., and Viola, I. (2011). Chro-
matic shadows for improved perception. In Proc.
Non-photorealistic Animation and Rendering (NPAR
2011), pages 105–115.
Wanger, L. (1992). The effect of shadow quality on the per-
ception of spatial relationships in computer generated
imagery. In Proc. symp. on Interactive 3D graphics,
pages 39–42, New York, NY, U.S.A. ACM.
Wille, K. (2001). The Physics of Particle Accelerators: An
Introduction. Oxford University Press, U.S.A.
IVAPP2013-InternationalConferenceonInformationVisualizationTheoryandApplications
592
