
Custom Built Device for Spasticity Evaluation Associated to Spinal
Cord Injury
A Redundant Signal to Electrogoniometer in Pendulum Test
Renata Manzano Maria
1,2
, Karina Cristina Alonso
2
,
Eliza Regina Ferreira Braga Machado de Azevedo
2
, Renato Varoto
1
and Alberto Cliquet Jr.
1,2
1
Department of Electrical Engineering, University of São Paulo (USP), São Carlos, Brazil
2
Department of Orthopedics and Traumatology, University of Campinas (UNICAMP), Campinas, Brazil
Keywords: Spasticity, Pendulum Test, Biomedical Engineering, Electrogoniometer, Goniometry, Accelerometer, Spinal
Cord Injury, Clinical Evaluation.
Abstract: The proposal of this project was the development of a more objective system to evaluate spasticity,
dysfunction often presented by spinal cord injured people. As result, it will be possible to follow patient’s
progress in moments before and after any treatment, drawing comparisons through the acquired data. One
accelerometer was added to the original pendulum test, providing redundant and alternative signal to the
electrogoniometer, even in critical situations. Also, tests were performed in patients during treatments, what
confirmed the feasibility of the present system in this method of evaluation.
1 INTRODUCTION
There are many causes of spinal cord injuries.
Among them are: automobilist accidents, fire guns
and diving into shallow waters. Non-traumatic
causes, as nervous system diseases, can also lead to
injury.
When spinal cord injury occurs, communication
between the brain and body is affected,
consequently, conduction of motor and sensory
information is impaired.
1.1 Spinal Cord Injury Levels
Injury can be complete, when there is an absence of
sensory and motor function in the lowest sacral
segments; or incomplete, when there is preservation
of any sensory and/or motor function below the
neurological level that includes the lowest sacral
segments (Kirshblum et al., 2011).
Paraplegia refers to impairment or loss of motor
and/or sensory function in the thoracic, lumbar or
sacral (but not cervical) segments of the spinal cord,
consequent to the damage of neural elements within
the spinal canal. With paraplegia, upper limb
function is preserved, but, depending on the injury
level, trunk, lower limbs and pelvic organs may
present functional losses (Kirshblum et al., 2011).
Tetraplegia term refers to motor or sensory
dysfunctions of spinal cord cervical segments due to
damage of neural elements within the spinal canal.
Tetraplegia results in impairment of function in
upper limbs as well as typically in trunk, lower
limbs and pelvic organs (Kirshblum et al., 2011).
Certain time after the occurrence of the spinal
cord injury, movement disorders tend to appear,
what hinders these people’s lives and can induce
pain.
This study focus on one of these disorders: the
spasticity.
1.2 Muscle Tone and Spasticity
Each motoneuron, that originates from spinal cord,
innervates many muscle fibers. As the muscle fibers
do not contract themselves without the existence of a
real action potential to stimulate them (except in
some pathological situation), skeletal muscle tone is
totally dependent of nervous impulses originated
from spinal cord. Muscle tone is a state of partial
tension of the muscle at rest that allows the
contraction to start immediately after receiving a
nervous impulse, besides of defining the strength
with that the muscle resists to being strained. These
120
Manzano Maria R., Alonso K., Ferreira Braga Machado de Azevedo E., Varoto R. and Cliquet Jr. A..
Custom Built Device for Spasticity Evaluation Associated to Spinal Cord Injury - A Redundant Signal to Electrogoniometer in Pendulum Test.
DOI: 10.5220/0004234001200126
In Proceedings of the International Conference on Biomedical Electronics and Devices (BIODEVICES-2013), pages 120-126
ISBN: 978-989-8565-34-1
Copyright
c
2013 SCITEPRESS (Science and Technology Publications, Lda.)

impulses are controlled in part by impulses
transmitted by the encephalon to the correspondent
motoneurons and in part by impulses originated
from muscle fuses localized in the proper muscle
(Guyton, 1997).
The increase of muscle tone characterizes the
spasticity. In physical exam, spastic limbs present an
increased resistance to passive movement, which is
more accentuated with the increase of the amplitude
and speed imposed. The increased resistance to
stretching is greater at the beginning of the
movement, and decreases thereafter. (Leitão et al.,
2006).
As spasticity affects the quality of spinal cord
injured people’s lives, since it causes functional
difficulties, besides pain and contractures, some
specific treatments can decrease these effects in
some muscle groups. Treatment is often considered
essential to prevent deformities, improve function
and release stressing symptoms (Miyazaki et al.,
2008).
1.3 Rehabilitation
Some treatments are more used in rehabilitation
programs, aiming the reduction of patient incapacity.
Kinesiotherapy, Locomotor Treadmill Training,
Functional Electrical Stimulation, use of orthoses
and medication treatments are examples with
satisfactory results (Lianza et al., 2001).
According to Dietz (2008), complete spinal cord
injured individuals are beneficiated by gait training,
mainly by atrophy prevention and spasticity
reduction.
Patients can perform treadmill gait training
associated to neuromuscular electrical stimulation
(NMES). They are assisted by partial body weight
support (BWS) (30-50%, to allow heel strike), and
by physiotherapists that help them move their legs.
During treadmill gait (at 0.14-0.39 m/s), the 4-
channel electrical stimulator is also used to provide
NMES to aid the stance gait phase (through
quadriceps muscle activation) and the swing phase
(stimuli to the fibular nerve) (Carvalho et al., 2006;
Abreu et al., 2009).
1.4 Existent Evaluation Methods
The increase of new methods in spasticity treatment
has driven forward new mechanisms to quantify its
degree, measuring progression and success of these
methods. In fact, there is a trend towards more
objective measurements in order to make possible
more precise and exact analysis.
In spasticity assessment, quantitative and
qualitative indicators are used. They are used to
identify intensity and influence on functional
performance, being useful for indication of
therapeutic interventions and analysis of assessment
results (Leitão et al., 2006).
Scales are common clinical measures of muscle
tone, among them are Ashworth Scale, Modified
Ashworth Scale and Spasm Frequency Scale.
Besides the patient’s influence, scales are also a very
subject grading method and do not allow smaller
degrees identification.
The use of tonus as a resource to establish
neurological diagnoses is possible through pendulum
test that evaluates muscle tonus of the quadriceps.
Data obtained in this test present minimum
variability and high precision, require minimum
patient cooperation and, the most important, they
have significantly correlation with clinical results.
This test has been used to evaluate spasticity in
patients that presents hemiplegia, multiple sclerosis
and spinal cord injury and also to evaluate the
efficacy of antispastic drugs and muscle training
(Salmela et. al., 2002).
Electrogoniometers and tachometers were used
as instrumentations to pendulum test of spasticity
(Bajd and Vodovnik, 1984).
Procedure involving computerized video motion
analysis was applied as an alternative to goniometer
in pendulum tests (Stillman and McMeeken, 1995).
Linear accelerometers were used as an
alternative strategy to measure knee joint angle,
what allows unlimited movements of the patient
(Yakamoto et al., 2012).
Accelerometer was also combined to gyroscope
in the development of a motion sensor system, in
order to estimate joint moments in human dynamic
analysis (Liu et al., 2010).
Alternative tests are available also to upper limb,
as the use of a hand-held myotonometer for
measuring tone, elasticity and stiffness of the muscle
simultaneously, by applying a brief mechanical
impulse, followed by a quick release to the muscle
through acceleration probe (Chuang et al., 2012).
This project applies a common sensor (used in
motion analysis) to the original pendulum test: the
accelerometer. It provides information of thigh
tremor during the test execution.
As redundancy, one electrogoniometer is also
positioned in the patient to measure knee angle
during the balance.
CustomBuiltDeviceforSpasticityEvaluationAssociatedtoSpinalCordInjury-ARedundantSignaltoElectrogoniometer
inPendulumTest
121
2 DEVELOPMENT
2.1 Transducers
2.1.1 Accelerometer
A piezoelectric accelerometer was chosen to
quantify thigh tremor. The ACH-04-08-05
Accelerometer Analog Test PCB (Measurement
Specialties, Inc., Norristown, PA, USA) used in this
system, presents adequate features for this
application. This unit consists of the ACH-04-08-05
accelerometer with thermal shield, a low-power
operational amplifier, resistors and capacitors that
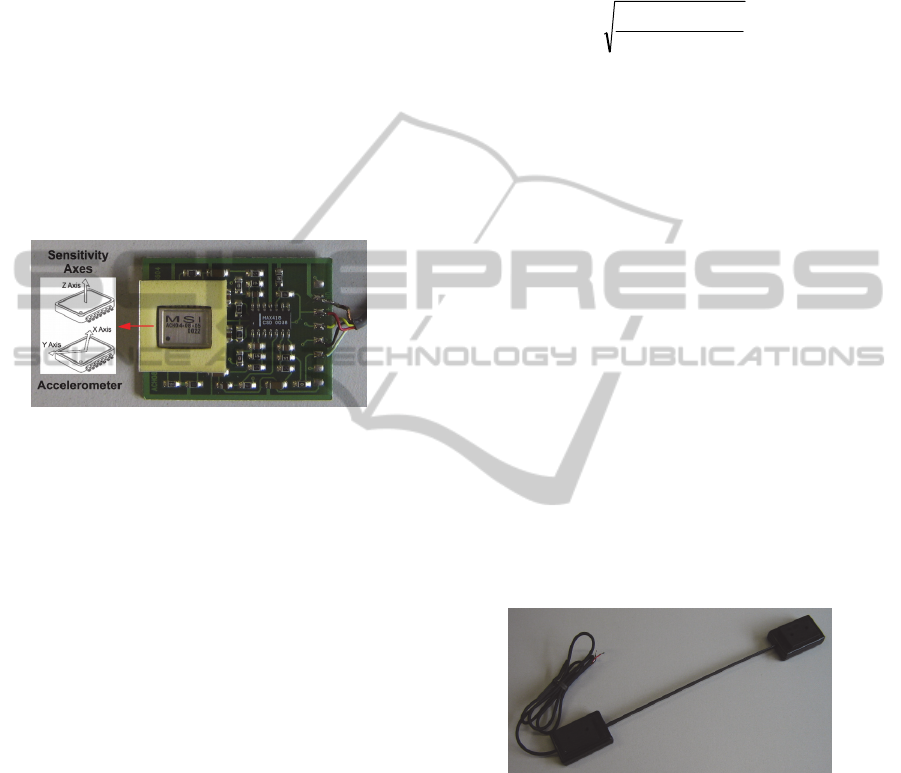
provide signal conditioning (Figure1) (Measurement
Specialties, Inc., 2001).
Figure 1: ACH-04-08-05 Accelerometer Analog Test
PCB.
The accelerometer contains three cantilever
beams composed of a metal substrate with a
piezoelectric polymer element affixed to one side.
The beams are oriented to simultaneously measure
acceleration in three orthogonal, linear axes (X, Y
and Z). The X and Y axes are at a 45
o
angle relative
to the accelerometer package. Each beam is
supported at one tip while the opposite tip is free to
flex in response to acceleration. This flexion strains
the piezoelectric material that generates a charge
proportional to the applied acceleration. The
accelerometer responds over a frequency range from
0.3 Hz to 5.0 kHz, as a result of the integrated
electronics and the damped sensing elements. The
sensitivity of axes is 1.8 mV/g (Measurement
Specialties, Inc., 1998); (Measurement Specialties,
Inc., 1999).
The ACH-04-08-05 Accelerometer Analog Test
PCB provides three simultaneous analog outputs,
one for each axis. Moreover, the circuit has a gain of
47.8, a high-pass filter (0.34 Hz) and a low-pass
filter (185 Hz). The entire circuit requires +5 V
power supply and drains 13 μA for all three axes
(Measurement Specialties, Inc., 1998);
(Measurement Specialties, Inc., 2001).
Tremors, as vibration signal, are usually
composed of many frequencies that occur
simultaneously. Vibration amplitude can be
quantified in many ways: peak-to-peak level, peak
level and root mean square (RMS). RMS value was
chosen as an indicator because it shows the mean
energy contained in the vibration movement. It is
calculated according to the equation 1.
N
x...xx
x
2
N
2
2
2
1
RMS
(1)
x
RMS
is the effective value of the vector analyzed,
x
1
...x
n
are its values and N is the vector size.
2.1.2 Electrogoniometer
Goniometry is one of the most used techniques by
cinemetry, which allows the assessment of joint
range of motion, and the description and
comprehension of adjacent segments movement,
providing a quantitative analysis about pathology
and functional capacity rehabilitation (Esteves et al.,
2007).
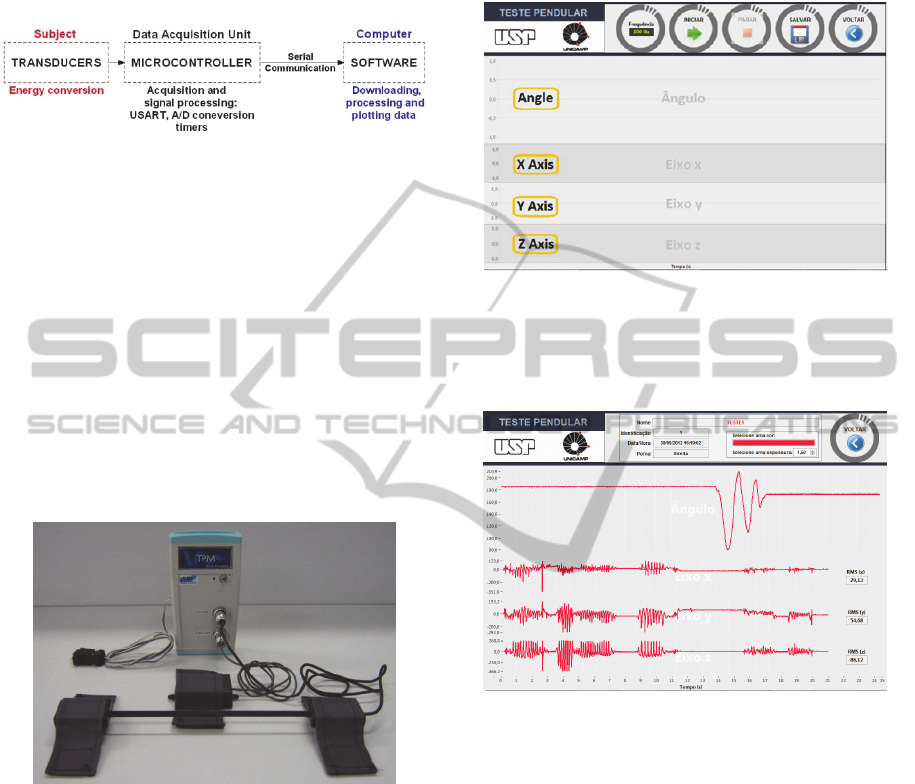
The S700 Joint Angle SHAPE SENSOR
(Measurand, Inc., Fredericton, NB, Canada) was
used to measure joint angle. This transducer has one
degree of freedom and it consists of two cases
attached to both tips of a 200 mm vinyl-covered
metal cantilever (Figure 2). The cantilever has
plastic optical fiber along the length on both sides,
and the fiber is treated on one side to lose light
proportional to bending. Thus, the angle between the
two cases determines the amount of light traveling
through the fiber.
Figure 2: Electrogoniometer Shape Sensor S700 Joint.
One case contains the electronic circuit that
converts the light signal from the sensor to an
electrical output. The transducer output is centered
on 2.5 V (sensor is straight, for +5 V power supply
and 5 mA of current draw) and it is linear and usable
without further processing. The output range is ±1.0
V for an angle range of ±90
o
. The other case is used
for mounting (Measurand, Inc., 2001).
2.2 Hardware
Hardware was built based on data acquisition
BIODEVICES2013-InternationalConferenceonBiomedicalElectronicsandDevices
122
through a microcontroller responsible also for
analog to digital signals conversion, as well as their
transmission to a computer through serial
communication.
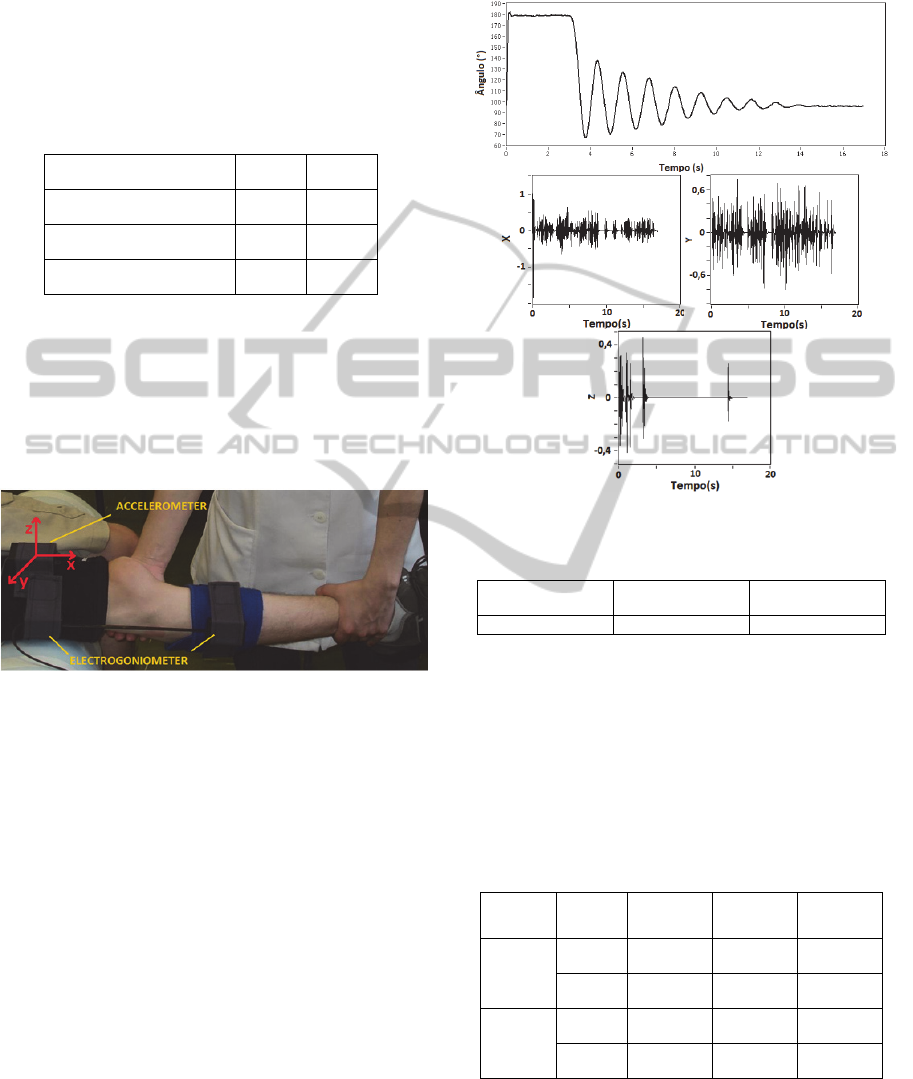
Figure 3: Global system diagram. Analog signal acquired
from the transducers is converted to digital signal by the
microcontroller and sent through serial communication to
the software in the computer.
Basically, the data acquisition unit consists of
PIC18F258 microcontroller (Microchip Technology,
Inc., Chandler, AZ, USA), MAX232 dual
driver/receiver (Texas Instruments, Inc., Dallas, TX,
USA), 9V battery as power supply with 5V voltage
regulator and support circuit for PIC (crystal and
capacitors).
An alternative way to the serial port
communication, not always available in many
computers, is the use of a USB-Serial converter
cable.
Figure 4: Complete system. Transducers, serial cable and
equipment.
2.3 Firmware and Software
The microcontroller acquires data from transducers,
realizes analog to digital conversion and sends these
data to computer via serial communication.
Libraries, corresponding to the PIC, USART, Timer,
A/D converter and delays, were defined in the
program of microcontroller; ports used and their I/O
functions were also set up, and timing and clearing
USART buffer functions were declared.
The software built to user interface was
developed in LabVIEW 8.6 (National Instruments,
Austin, TX, USA) platform, using graphical
programming called G language.
Figure 5 shows the data acquisition screen.
Transducers data are shown in real time during test.
Figure 5: Data acquisition screen.
The data is stored by an identification given to
the patient at the capture moment. Figure 6 shows
the screen where the user can see historical data.
Figure 6: Historical data screen.
The electrogoniometer can also be calibrated. To
this project, 180º corresponds to the leg completely
extended, and 90º to the end of the balance. A linear
equation is created using values acquired by the
system, making a relation to determine the angle.
Other way to calibrate is setting the coefficients
A and B of the equation. This mode is indicated
when the calibration equation of the transducer is
already known.
The accelerometer data are not converted to
engineering units because they are just used to
quantify the intensity of fractionated movement
patterns.
3 METHODS
Tests were performed at Laboratory of
CustomBuiltDeviceforSpasticityEvaluationAssociatedtoSpinalCordInjury-ARedundantSignaltoElectrogoniometer
inPendulumTest
123
Biomechanics and Rehabilitation of the Locomotor
System – UNICAMP, with spinal cord injured
patients (SCIs).
The SCIs volunteers are integrants of the
rehabilitation group that realizes treadmill gait
training with NMES. Tests were performed by two
patients (both legs), as presented in Table 1.
Table 1: SCIs volunteers characteristics.
Patient 1 2
Gender
Male Male
Neurological Lesion Level
C5 T3
Asia Scale
AIS C AIS A
The patient is positioned in supine position, in a
way that his leg may have free balance when
released. A triangular lumbar support (45°) is placed
under the patient to not induce spasticity.
As shown in Figure 7, the electrogoniometer is
positioned laterally to the patient’s leg and the
accelerometer, above the leg (quadriceps direction).
Figure 7: Sensors position.
At the beginning, the physiotherapist extends the
leg and released it, letting it falls freely until it stops.
Data are acquired and stored by the software.
Tests were performed three times consecutively
for each leg, before and after the treadmill gait
training with NMES.
4 RESULTS
For reference purpose, signals from healthy
volunteer were acquired (Figure 8). First graph
refers to the electrogoniometer signal, similar to a
damped pendulum movement during the balance,
presenting no abrupt signals or interruptions. Signals
from three axis of the accelerometer can be also
observed in Figure 8.
As a more quantitative way of interpretation,
RMS from each repetition is calculated. The mean of
the 3 axis are shown in Table 2. Values indicate few
thigh tremor during the balance.
Figure 8: Data from control patient.
Table 2: RMS values of reference signals.
0,16 0,16 0,07
SCIs test results are shown in Figure 9, before
training, and in Figure 10, after training.
Mean of the three repetitions (
RMSx
RMSy
, RMSz
)
of each leg was extracted in both
moments, before and after. Then the difference
between these two moments was calculated (Table
3).
Table 3: Differences of RMS mean values corresponding
to instants before and after treadmill gait training.
Patient Leg
∆
∆
∆
1
Left
2,22 1,23 2,44
Right
1,39 0,86 1,95
2
Left
18,63 10,86 8,03
Right
1,86 2,89 0,69
It is possible to observe that there is a
significantly decrease of RMS value in the three
axis signals of the accelerometer, when both instants
are compared.
BIODEVICES2013-InternationalConferenceonBiomedicalElectronicsandDevices
124
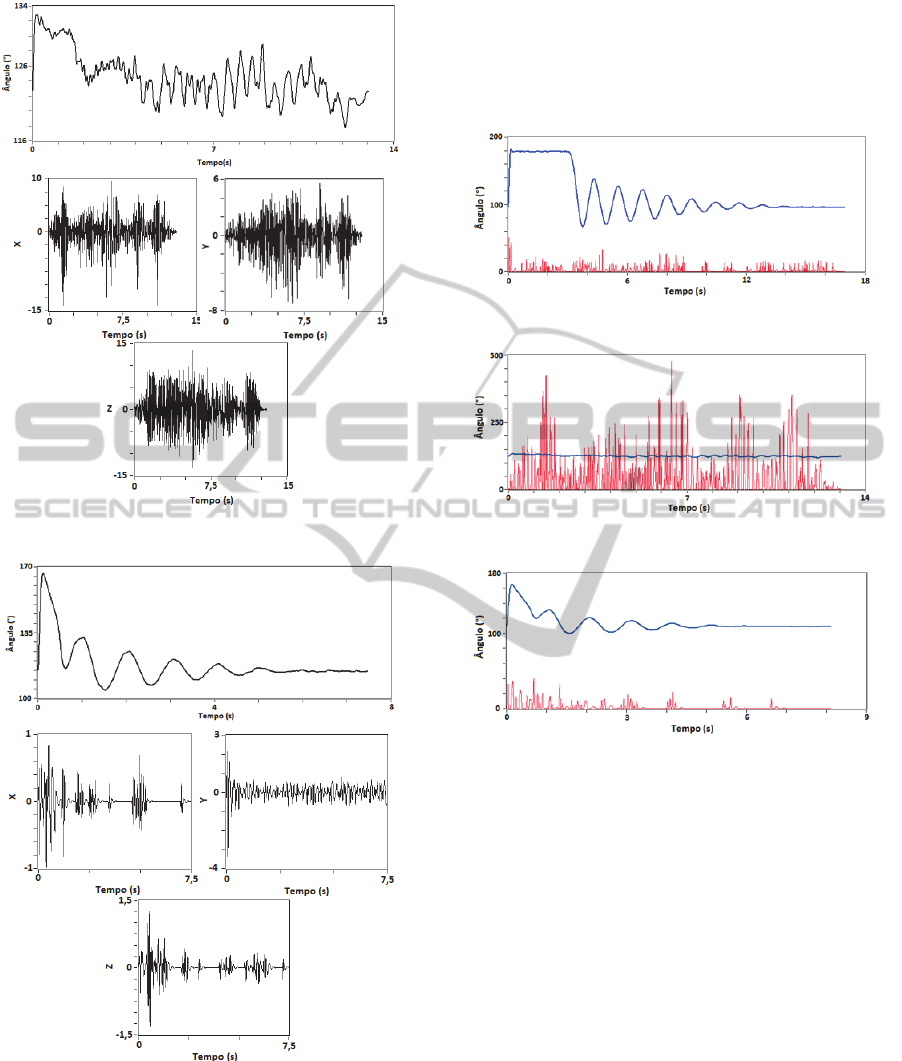
Figure 9: Data before training.
Figure 10: Data after training.
Measuring in three axis are made to improve the
spatial sense compared with the electrogoniometer.
Figures 11, 12 and 13 allow a visual
understanding of these data and make possible the
evaluation the redundance of the sensors when used
in pendulum test.
Besides that, it is possible to notice that instants
after the training, the movement tends to be similar
of a pendulum one, as occurs with the control signal
obtained initially. This means that the spasticity has
decreased significantly.
Figure 11: Angle x Vibration – Control signal.
Figure 12: Angle x Vibration – Before training signal.
Figure 13: Angle x Vibration – After training signal.
5 CONCLUSIONS
Along the study, the feasibility of the accelerometer
use in spasticity quantification was verified, since
the tremor is certainly present during the pendulum
test. Besides, it was possible to obtain RMS values
as parameters to quantify spasticity.
Electrogoniometer, usually used in pendulum
test, maintains its functionality as a redundant and
complementary signal.
However, in severe spasticity, as the
electrogoniometer signal does not allow parameters
calculation, due to irregular signal shape, the use of
signal provided by accelerometer is more
appropriate.
Future works are encouraged by adding new
accelerometers in different positions, proportioning
not only acceleration values, but also, velocity and
position.
CustomBuiltDeviceforSpasticityEvaluationAssociatedtoSpinalCordInjury-ARedundantSignaltoElectrogoniometer
inPendulumTest
125

REFERENCES
Abreu, D. C., Cliquet Jr. A., Rondina, J. M., Cendes, F.,
2009. Electrical stimulation during gait promotes
increase of muscle cross-sectional area in
quadriplegics.
Clinical Orthopaedics and Related
Research,
467, pp. 553-557.
Accelerometer ACH-04-98-05, 1998. Measurement
Specialties: Datasheet. Available in: <
http://www.meas-spec.com/>. Accessed in: March,
2008.
Accelerometer, 1999. Piezo Film Sensors - Technical
Manual. Norristown, PA: Measurement Specialties,
Inc..
ACH-04-08-05 (Multi-Axis) and ACH-04-08-05 Analog
Test PCB. Piezo Film Sensors - Product Guide and
Price List. Norristown, PA: Measurement Specialties,
Inc., 2001.
Badj, T., Vodovnik, L., 1984. Pendulum testing of
spasticity
. Journal of Biomedical Engineering, v.6, pp.
9-16.
Carvalho, D. C., Martins, C. L., Cardoso, S. D., Cliquet
Jr., A., 2006. Improvement of metabolic and
cardiorespiratory responses through treadmill gait
training with neuromuscular electrical stimulation in
quadriplegic subjects.
Artificial Organs, 30, pp. 56-63.
Chuang, L., Wu, C., Lin, K., 2012. Myotonometric
Measurement of Muscular Properties of Hemiparetic
Arms ins Stroke Patients. In: Chong-Tae Kim,
Rehabilitation Medicine, InTech. Rijeka, 1
st
edition.
Dietz, V., 2008. Body weight supported gait training: from
laboratory to clinical setting.
Brain Research Bulletin.
v. 74, pp. 459-463.
Esteves, A. C., Stolt, L. R. O. G., Leite, R. M., Dos Reis,
D. C., Borges Jr, N. G., 2007. Validação de um
eletrogoniômetro Digital. Available in: <
http://www2.rc.unesp.br/eventos/educacao_fisica/bio
mecanica2007/upload/115-10-A-
ELETROGONIOMETRO%20IDENTIFICADO.pdf>.
Accessed in: July, 2012.
Guyton, A. C. M. D, 1997.
Tratado de fisiologia médica,
Guanabara Koogan. Rio de Janeiro, 9
th
edition.
Kirshblum, S. C., Burns, S. P., Biering-Sorensen, F.,
Donovan, W., Graves, D. E., Jha, A., Johansen, M.,
Jones, L., Krassioukov, A., Mulcahey, M. J., Read, M.
S., Waring, W., 2011. International standards for
neurological classification of spinal cord injury.
The
Journal of Spinal Cord Medicine,
v. 34, pp. 535-546.
Leitão, A. V., Musse, C. A. I., Granero, L. H. M.,
Rossetto, R., Pavan, K., Lianza, S., 2006.
Espasticidade: Avaliação Clínica.
Sociedade
Brasileira de Medicina Física e Reabilitação - Projeto
Diretrizes.
Lianza, S., Pavan, K., Lourenço, A. F., Fonseca, A.P.,
Leitão, A. V., Musse, C. A. I., Santos, C. A., Masiero,
D., Quagliato, E., Fonseca Filho, G. A., Granero, L. H.
M., Gianni, M. A. C., Gal, P. L. M., Rosetto, R.,
Belizzi, D., Greve, J. M. D, Sposito, M. M. M., 2001.
Diagnóstico e Tratamento da Espasticidade.
Sociedade
Brasileira de Medicina Física e Reabilitação - Projeto
Diretrizes.
Liu, T., Inoue, Y., Shibata, K., Zheng, R., 2010. Wearable
Sensor System for Human Dynamics Analysis. In:
Annalisa Milella, Donato di Paola, Grazia Cicirelli,
Mechatronic Systems Applications, InTech. Vukovar,
1
st
edition.
Miyazaki, E. G., Rosa, T. da S., Nascimento, A. P. H.,
Oberg, T. D., 2008. Influência da estimulação elétrica
funcional para adequação de tono muscular e controle
motor em hemiplégicos.
INTELLECTUS – Revista
Acadêmica Digital do Grupo POLIS Educacional,
Ano 04, n.05, pp. 2-3.
S700 Joint Angle SHAPE SENSOR. S700/S720 Joint
Angle SHAPE SENSOR - Instruction Manual.
Fredericton, NB: Measurand Inc., 2001.
Salmela, L. F. T., Nadeau, S., Olney, S. J., Brouwer, B,
2002. Pêndulo: um teste simples de medida de
espasticidade.
Acta Fisiátrica, v.9, pp. 63-70.
Stillman, B., McMeeken, J., 1995. A video-based version
of the pendulum test: technique and normal response.
Archives of physical medicine and rehabilitation, v.76,
pp. 166-176.
Teive, H. A. G., Zonta, M., Kumagai, Y., 1998.
Tratamento da espasticidade: uma atualização.
Arquivos de Neuro-Psiquiatria, v.56, n.4, pp. 852-858.
Yakamoto, Y., Jikuya, K., Kusuhara Toshimasa.,
Nakamura, T., Michinishi, H., Okamoto, T., 2012.
Precise Measurement System for Knee Joint Motion
During the Pendulum Test Using Two Linear
Accelerometers. In: Md. Zahurul Haq,
Advanced
Topics in Measurement
, InTech. Rijeka, 1
st
edition.
BIODEVICES2013-InternationalConferenceonBiomedicalElectronicsandDevices
126
