
Business Process Modeling and Implementation
A 3-Year Teaching Experience
Daniela Giordano and Francesco Maiorana
Department of Electrical, Electronic and Computer Engineering, University of Catania, Viale A. Doria, 6, Catania, Italy
Keywords: Business Process Modeling, Workflow Modeling, Petri Nets, Swim Lanes, Novice Errors, MS SharePoint.
Abstract: In this work we describe a three-year teaching experience in an Information Systems course for a
Management Engineering Master degree, where the course's focus was on business process modeling and
on the technical aspects related to process implementation in a commercial software suite. In particular, we
underwent a modeling shift from a Petri Nets description of concurrent processes to a full, business-process
oriented methodology as proposed by Sharp and Mc Dermott (Sharp and McDermott, 2001) (Sharp and
McDermott, 2008). This latter methodology was extended with additional data models, such Entity Life
History, dealing with entities life cycle and dynamics. The students engaged in modeling the business
processes of a real Small Medium Enterprise operating in the local area. The model was implemented using
Microsoft Share Point, which affords a tight integration with databases such as Access or Microsoft SQL
Server. A comparison of the adopted modeling strategies is presented, as well as common student errors in
the design and implementation phase, together with some lessons learnt.
1 INTRODUCTION
Business process modeling is an important topic that
is gaining momentum in modern curricula, both at
the undergraduate and graduate level (Topi et al.,
2010). In a recent review (Bandara et al., 2010) the
authors presents the Business Process Management
(BPM) instruction programs in five universities
around the globe. In their work the author identifies
three major trends in BPM:
1) Methodologies to organize, manage and
measure the organization based on its core
processes;
2) the lean Six-Sigma BPM;
3) The technological trend that focuses on
enabling the organization core process through
BPM platforms emphasizing the technical
aspects of BPM as “a set of new software
technologies that make it easier for IT to
manage and measure the execution of process
workflow and process software applications”
(Harmon and Wolf, 2008).
The authors identify, among the major challenges,
the following ones:
1) difficulties in teaching the technical aspects of
the topic, since both specialized skills and
more time to set up and teach than other
existing courses are required. The higher
workload results, among other things, from
testing in a complex technological environment
in order to offer to the whole class a reliable
platform;
2) only a limited pedagogical research specific to
BPM education is available.
A recent interesting work (Djajalaksana, 2011)
presents the results of a national survey in the United
States on the instructional strategies used related to
teach Information Systems (IS) courses.
This paper aims at contributing to current
pedagogical research in Business Process Modeling
and Management by reporting a teaching experience
carried out in the Information System course of the
Master Degree in Management Engineering, at the
University of Catania. The course was designed at
onset following an approach that seamlessly
integrates two of the three major trends identified in
(Bandara et al., 2010), namely trend 1) and 3); also,
it was based on the use of design precedents,
following an approach that has been extensively
tested in the context of IS courses for Computer
Engineering students (Faro and Giordano, 1998),
(Giordano, 2004). The course was organized around
two main phases: 1) the design phase, with a
methodological approach that aims at integrating the
429
Giordano D. and Maiorana F..
Business Process Modeling and Implementation - A 3-Year Teaching Experience.
DOI: 10.5220/0004387604290436
In Proceedings of the 5th International Conference on Computer Supported Education (CSEDU-2013), pages 429-436
ISBN: 978-989-8565-53-2
Copyright
c
2013 SCITEPRESS (Science and Technology Publications, Lda.)

process view, the data view and the user view; and
2) the implementation phase, that by adopting a
software solution made available on line to the entire
community of students allows for a business
workflow implementation in which the students are
shielded from the details of system installation,
configuration and management.
The paper is organized as follows: section 2
presents the teaching context; section 3 details the
pedagogical approaches; section 4 presents some
comparison of the teaching experience; section 5
draws the conclusions and highlights future work.
2 TEACHING CONTEXT AND
CONTENTS
The course is a 6 credits graduate course in
Information Systems for the Management
Engineering degree, requiring 60 hours of lessons
and classroom activities. The students can register in
the course after a prerequisite undergraduate course
in database design, where they have to complete a
project requiring the design of a conceptual model,
its implementation in a Relational Database
Management System (RDBMS), with the option of
prototyping a web interface that exposes the data.
Their only programming experience is with
Visual Basic for Application (VBA) to manipulate
data inside the Microsoft Access RDBMS. About 60
students enroll each year, with a roughly equal
distribution between males and females. The IS
master course has been centered traditionally on
teaching systems analysis and design methodologies,
for business process modeling (Weaver et al., 2002).
The first time when business workflow analysis and
design was introduced was in the 2007/08 academic
year (a.y.) and used Petri net for workflow modeling
(Van der Aalst and Van Hee, 2004); in the 2008/09
a.y. the swim lane workflow modeling and the
complete design methodology proposed by Sharp
and McDermott in (Sharp and McDermott, 2001)
were introduced and refined in the 2009/10
academic year as proposed in (Sharp, 2008), where a
swim-lane “shows what is done, by whom, in what
sequence”. The swim-lane diagram (Figure 1)
shows:
- Actors vertically aligned at the beginning of
the horizontal line, one actor for each line;
- Tasks, represented as rectangles;
- The flow of actions represented by an arrow
from left to right that joins consecutive tasks.
The handoff, represented by an arrow that
crosses the swim-lines of two actors.
Figure 1: An example of a swim-lane involving two actors
performing two tasks with an handoff.
The swim-lane allows to represent constructs such as
sequence, collaborative task, choice, parallel flow,
conditional parallel flow, temporal constraints.
In all the three editions of the course the objectives,
with particular emphasis on the workflow modeling
part, were:
- Acquire the basic techniques and skills for
business process and workflow modeling with
the ability to work out the scope of each
technique, as well as its strengths and
drawbacks.
- Acquire the capacity to use and to program
workflow modeling and management tools.
Complementary objectives were the development
of critical thinking skills, capability to analyze
problems from different perspectives, draw
conclusions and apply these conclusions in the
design phase; as well as improving communication
and collaboration skills.
The lessons typically started with a presentation
of the key concepts, concepts to be applied as soon
as possible in a case study during interactive
sessions, where the solution was often reached with
the intervention of all the students with the teacher
and tutor mostly involved in a facilitator role, with a
recap phase at the end of the design activity. The
interactivity was simply managed by posing a
question, even complex ones such as "design a
system capable of …", and then let the students
work alone or in group during class activities. After
a reasonable amount of time the instructor asked to
the students to volunteer for presenting their
solution. The solution was discussed in class by
letting the students, in turn, ask questions, propose
different designs, compare different solutions and so
on. Each class ended with small assignment meant
as a reinforcement activity requiring a practical
application of the main concepts and methodology
exposed during class. Examples of these small
assignments are: designing from a use case schema
the E/R model, correcting a swim line, designing a
swim line, correcting and designing an E/R schema
and so on. The small assignments were deliberately
not graded but critically discussed in class. The
CSEDU2013-5thInternationalConferenceonComputerSupportedEducation
430

choice of no grading policy was meant to increase
the students' confidence and lower the fear in public
intervention. The syllabus of the project for the
2007/08 (a.y.) is presented in Table 1. Particular
emphasis was given to the workflow design and
workflow pattern using Petri Nets. During the course
it was requested to the student to read journal and
conference paper such as (Hammer, 1990) and
(Russell, 2006). The syllabus of the course for the
2008/09 (a.y.) is presented in Table 2.
Table 1: Course syllabus for the 1st edition of the course.
Topic N. hours
Business Process reengineering 2
The five level of analysis: mission; strategy and
goal; Business Process; Presentation; application
logic
1
Reference model: Set of definitions to describe
the knowledge domain.
1
Petri Net 6
Petri Net extension: color, time, hierarchical 2
Workflow representation using Petri Net 4
Workflow patterns 4
Total 20
Table 2: Course syllabus for the Workflow modeling in
the 2nd edition of the course (including implementation).
Topic N. hours
Business Process reengineering 2
The five levels of analysis: mission; strategy and
goal; Business Process; Presentation; application
logic
1
Workflow modeling (business process modeling) 6
Use case and use case scenario (presentation) 2
Transaction modeling (application logic) 2
Entity model (data model) 2
Process identification 2
Initial evaluation and metrics 2
Synthesis poster 2
Tour of Share Point Portal Server and Share
Point designer
1
Application and site creation. User and groups 1
List and Document library. Web Pages and Web
Part available in SharePoint Designer.
1
Workflow: conditions and actions available in
Share Point Designer
2
InfoPath and form design 2
Visual Studio .Net. Workflow Testing 2
Total 30
The Synthesis Poster, according to (Sharp and
McDermott, 2008), “takes the main elements of
framing the process – the process scope and
contents, and the case for action, vision, and
differentiator – and puts them on a single piece of
paper. In the 2009/10 academic year the set of
design tools were incremented with dynamic data
behavior by the Entity Life History.
The workflow was implemented and deployed
using Share Point. In the first edition of the course
some minor attention was given to the installation
and configuration of Microsoft Share Point, attention
that was completely eliminated in the subsequent
editions of the course by giving to the students either
an on-line system or a pre-installed and configured
virtual machine. Share Point was also used for
visualizing OLAP cube in the second module of the
course were data-warehousing was treated.
Share Point Portal server was chosen after a
review of the available collaboration and workflow
suites due to: its tight integration with the Microsoft
Office suite, that is the most used set of tools used in
the industry by business manager; its simple usage
powered by the availability of out of the box tools to
perform a vast set of operations with no need to
develop code; its great flexibility in developing
powerful workflows by designing and coding within
the Visual Studio .Net framework.
The tight integration with the Excel spreadsheet
using the Excel Services, as well as the possibility to
synchronize data with Relational Database
Management Systems (RDBMS) such as Microsoft
Access and Microsoft SQL Server allows the
students to implement and integrate quite easily the
design project developed using the methodology.
The availability of a rich set of conditions and
actions in Share Point, even richer in Web-site
design tools (Share Point Designer) used in the
course, as well as third part components (e.g. for
(D'Urso et al., 2009), allow for a fast prototyping
with no or minimal coding intervention in most
cases. In this way students cognitive effort can focus
on the design activity that is at the core of the
course.
At the end of the course lessons the students had
to develop a project requiring to model the business
processes of a real or simulated Small Medium
Enterprise operating in the local area. Many projects,
however, were based on existing small/medium
enterprises and students designed the existing “as is”
scenario and proposed possible improvements
through the “to be” scenario.
In the project the student had to follow the
methodological approach sketched in Figure 2
(Sharp and McDermott, 2001) and (Sharp and
McDermott, 2008), using the design tools mentioned
above, i.e., the project data model, use cases, an use
case scenario, transactions and process metrics with
detailed specific of the enterprise Information
System.
The students had also to produce a working
prototype of the project developed with Share Point
portal server. The project was not the only element
BusinessProcessModelingandImplementation-A3-YearTeachingExperience
431

to make up the final grading of the course, which
was based on the assessment of three assignments:
1) Quality and usability analysis of an enterprise
web site (20%)
2) Written test with open questions concerning the
theoretical aspects of the course (40 %)
3) Project regarding the complete workflow
analysis of a small/medium enterprise,
including a working prototype of the project
developed with Share Point portal server (40
%).
Figure 2: The BPM methodological approach used for the
project.
The model prototype had to be implemented
using Microsoft Share Point with a tight integration
with databases such as Access or Microsoft SQL
Server and spreadsheets such as Excel.
The project was considered as a capstone to
apply the design methodologies in a real world
scenario, improving creative thinking while
developing better solutions for the “to be” process,
critical thinking while comparing solutions from
peers; improving communications skills (verbal and
written), and collaboration skills during teamwork.
The typical number of team members was three,
allowing for a good deal of interaction and point of
views, yet avoiding overcrowded groups that hinder
tasks and responsibility allocation and often lead to a
lesser engagement by some members of the team.
Tasks and responsibilities were self-allocated by
the students and verified by the tutor.
It was stipulated that in the final presentation of
the project, discussion of the various aspects of the
project from the team members was randomly
chosen despite the original work subdivision. In this
manner all the team members have to know all the
details of the whole project. Along the years, the
business domains have been ranging from insurance
companies, to laboratories for clinical analysis, to
banking, to photovoltaic panels production on
demand, to car workshops, to tour agencies, to an
international food industry and so on.
The tutoring activity was quite demanding,
requiring consultation both on a variegated set of
application domains and on some implementation
and deployment details. Figure 3 represents a
disciplined way of thinking about the tutoring
support activity, using the graphical notation of the
horizontal swim lanes adopted in the course. The
key interactions among the main actors are
highlighted as well as the most relevant aspects in
the tutoring process.
The project presentation, performed by the tutor,
is concerned with highlighting the main goals of the
final project, the grading policy and some project
management issues. Then the teams freely choose
the application domain of their work also by
consulting a shared pool of former projects, as in
(Giordano, 2004). The student are also required to
peer review one project of their colleagues. The first
year that the business workflow was introduced in
the course, given the discontinuity with the former
methodology, the support that could be obtained
from the pool of previous projects was limited to
getting a sense of the complexity of the various
business domains and to seeing instances of the
applications of use cases and E/R modelling,
whereas the actual workflow and business processes
were "hidden" in the Data Flow Diagrams, instead of
being explicit in swim-lanes. In the third year of the
course, the "shared memory" of the course provided
a more stable and comprehensive resources pool
reflecting the consolidation of the methodology
adopted for BPM.
At the end of this consultation phase the team
produces a project proposal that is evaluated by the
tutor. If approved, the team starts working on the
project and submits project milestones to the tutor,
who reviews the milestones following a guided
inquiry process. Meetings with the tutor are
scheduled upon teams' request.
The process ends with the final deliverable
preparation, where students produce the entire
design, highlighting each major decision taken and
explaining the reasons behind the decision, possibly
comparing two or more different approaches to the
same problem. After the final deliverable is
approved by the tutor the project is presented and
discussed, together with the working prototype, in
the final presentation in front of the teacher and the
tutor.
The workflow schema in Figure 2 can help in a
CSEDU2013-5thInternationalConferenceonComputerSupportedEducation
432
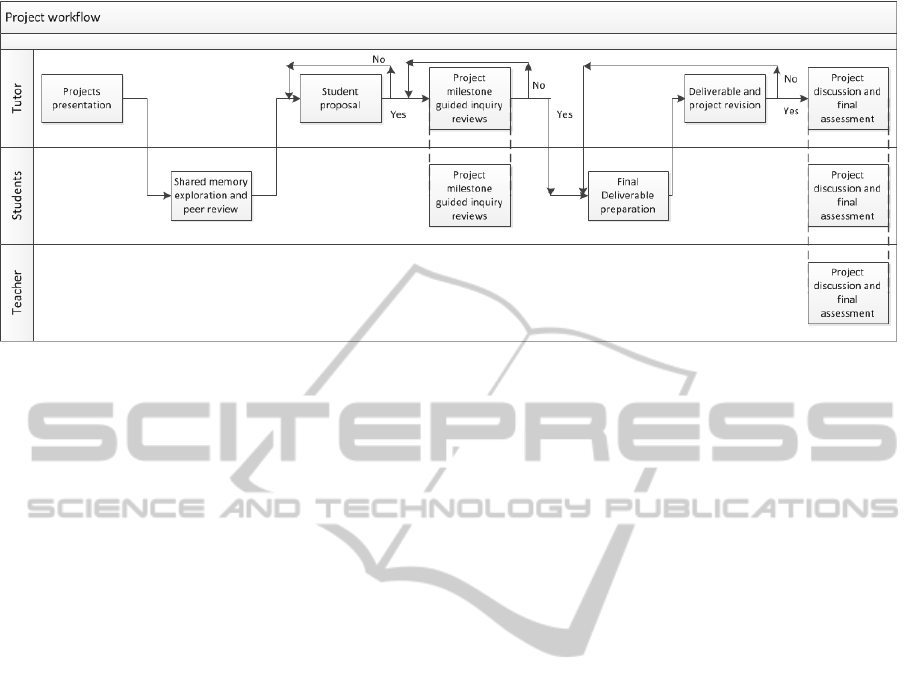
Figure 3: Project management workflow.
better management of the whole project
development phase, by offering a clear view of all
the phases and progresses, and thus facilitating the
communication among all the actors involved,
namely students, tutor and professor, also through
documents exchange.
Work can be found in literature describing the
advantage of using a collaborative system, such as
Share Point, to improve interaction among teacher,
tutor and students such as (Rockinson-Szapkiw,
2011) or to improve content management
(Tallapragada et al., 2012).
The project required 4 to 6 weeks work for
completion after the end of classes.
3 PEDAGOGICAL HIGHLIGHTS
The main pedagogical approaches and instructional
strategies followed during the course are the
following:
1) Use and sharing of previous projects and
experience: students used and reviewed the
projects from the previous academic years
in a "shared memory" fashion (Giordano,
2004). Projects are shared without the final
teacher feedback, thus encouraging critical
analysis.
2) Using interactive lesson focused on
reviewing cases, and on in class
collaborative analysis and design of a
solution for small practical cases;
3) A guided inquiry style of interaction, both
in class and in the tutoring sessions during
project development;
4) Video screen recordings of the technical
implementation procedure inside the Share
Point portal server.
Especially during the tutoring and reviewing
sessions, care was taken to avoid both a "no
intervention" approach and a "solution offering"
approach.
The teacher, in the role of facilitator of
knowledge building, especially with the most
brilliant students, answered the questions with
further questioning, and in general, guided the
students to discovering the solution, by offering
practical small exercises as guidance to solving the
problem, by suggesting to reviewing study materials
and so on.
4 CRITICAL COMPARISON
AND LESSONS LEARNT
The overall appreciation of the course was good as
pointed out from student active participation in the
lessons, effort put in the projects and answers to
informal questions such as “what have you learned
during the course?” The performance of the students
in terms of grades was overall steady, more biased in
the direction of higher grades, despite the increasing
load in terms of concepts and competences they had
to grasp.
In general, allowing the students to be immersed
in a real world scenario, focusing on real problems,
communicating and collaborating with the local
enterprise domain expert and so on, was a definitive
pro in the course.
We also agree with (Rockinson-Szapkiw, 2011)
that, especially for older students with a more
BusinessProcessModelingandImplementation-A3-YearTeachingExperience
433

comprehensive background and better reasoning
skills, allowing them to choose the domain of
application of the business process modeling
methodology, or the “surface agenda”, tied with
their personal story, background and interests,
greatly improves student involvement and
participation in the project.
In this way the teachers and the tutor maintain
the responsibility in choosing the methodologies,
leaving the students to apply it in their preferred
domain.
In particular, concerning an overall assessment
of the quality of learning and of the efficiency of the
pedagogical strategies adopted, taking into account
the changes in methodology introduced in the three
years, it is worth remarking the following points.
‐ Use of a complete design methodology such as
the Sharp and McDermott one has several
advantages compared with the usage of a single
design tool such as Petri Nets. A comparison of
the students usage of swim lane and Petri Nets
design tool for workflow modeling, based on
the frequency of requested tutoring
interventions and on observing the speed by
which the student were able to sketch a
workflow on the fly in front of the tutor seem to
suggest a steeper learning curve for Petri Nets.
One of the reasons why swim lanes, and in
particular the horizontal swim lanes proposed in
the methodology could be easier to learn could
be found in the visual span asymmetry
(McConkie and Rayner, 1975; Pollatsek et al.,
1981): for readers from left to right a visual
span asymmetry consisting of 3-4 characters to
the left of fixation vs.14-15 characters to right
of fixation has been demonstrated. The swim
lanes organization in different levels allows for
an easier top-down design approach focusing in
the overall process in the first level and
increasing the detail in the second and third
level. Overall, swim-lanes are more suited for a
managerial environment; Petri Net are, of
course, more suited for formal proof of
correctness or synchronization.
‐ Using a complete methodology and a plurality
of design tools and representations allows, in
general, for a deeper understanding of the
problem at hand resulting in a better analysis
and design that take advantage from the
interrelationship among the design tools
(Giordano, 2002), which provides means for
cross-verification and improvements of the
design artifact under development. From a
pedagogical standpoint it is a best practice to
present as earlier as possible the application of
all the needed design tools, starting from a small
project and incrementally enlarging it step by
step in order to let the student to deeply
understand, integrate and use all the design
methodologies. However, some limitations to
the efficacy of self-correction of the
methodology through cross-verification can be
noted, as exemplified in the type of errors
detected in the students projects, listed below.
‐ The most common errors detected in the
students' deliverables are the following:
a) Incomplete swim lane because of missing
handoff. The most relevant cases are: a) not
informing the client of a decision, and b)
incomplete management of the revision cycle
of a document or a production phase
b) E/R diagram errors, especially concerning the
correct usage of the association entity and how
to associate an item in a N-N association with
other entities;
c) Inconsistency between different design models,
e.g., information present in the use case
scenario and missing in the E/R diagram;
inconsistency between the ELH and the swim
lane, such as a missing event in the ELH,
presence of an irrelevant event in the ELH,
inconsistency between use case scenario and
swim lane;
d) Incorrect identification of the critical success
factors in business process modeling, and in
particular, confusing process and product
metrics.
The above type of errors, on the one hand, point to
the aspects that deserve special attention and
reiteration in communicating with the students
during the in-class and tutoring interactions; on the
other hand, they reflect the fact that the efficacy of
any analysis and design methodology as a self-
correcting instrument, can be affected by limited
knowledge or practice with more advanced data
modeling concepts and by the higher cognitive load
involved in coordinating representations dealing
with temporal aspects of processes and entities,
respectively.
‐
The use of the shared pool of previous projects,
increased the quality of the final deliverable
over time, especially in the last observed year.
The shared projects database can be used to
evaluate the didactic experience and objectively
measure student improvements. This is in line
with the approach adopted in (Giordano, 2002)
and, more recently, in (Paul, 2012) and
(Tenenberg and Mccartney, 2008) where the
CSEDU2013-5thInternationalConferenceonComputerSupportedEducation
434

authors suggest to look systematically at
students' artifact to derive data that can provide
insights into questions about learning. From a
preliminary analysis of the student projects over
the years we can observe:
o Increased complexity of the analysis and the
design, as measured by the number of
processes, actors, and steps in the processes in
the swim lanes, and by the number of entities
and association entities in the E/R diagram
o Increased degree of associations between the
platform (Share Point Portal Server) and the
underlying databases.
Table III shows some aggregate measures of
these improvements between the 2008/09 and the
2009/10 academic years, computed on a random
sample of 5 projects from each year cohort. The
table reports the average percentage of
improvement, if positive, for the 09/10 academic
year over the previous one.
This preliminary data suggest an overall increase
of the complexity of the analyzed process in the last
year: a larger number of swim lanes both at the
handoff level (Level 1) and the Milestone level
(Level 2); a greater number of steps performed by
less actors, increased number of tables, a smaller
number of use cases explained in more detail, as
indicated by the increase in use case scenarios, an
increased number of transactions and an increased
number of steps implemented in SharePoint.
Use case scenario, according to (Hamer et al.,
2008) “depicts the dialogue between an actor and a
system for a particular scenario”.
The observed increase in overall design
complexity, although based on a limited sampling
aimed at preliminary exploration of the data, is in
line with the effect of "organizational learning"
discussed in (Giordano, 2002) and (Giordano, 2004)
when a shared memory of design artifacts is in
place.
Concerning the technological challenge of
setting up a relatively complex environment, prior
installation of a virtual machine was made available
on line and also distributed using a DVD upon
students' request.
This allowed to eliminate all the steps required
for software installation (operating system,
Microsoft Office, Microsoft SQL server and
Microsoft Share Point Portal Server) and
configuration, and all students could working on the
same initial configuration, thus facilitating
debugging.
Screen video recordings greatly reduced the
tutoring burden over implementation issues,
Table3: Comparison of two academic years projects
cohorts: average number of handoff swim-lanes (L1),
average number of milestone swim lanes (L2), average
number of actors (A), steps (S), tables (T), use cases (UC),
use case scenario (UCS), transactions (T) and Microsoft
Share Point steps (SPS).
Year L1 L2 #A # S #T
#
UC
#
UCS
#T # SPS
09/10 3,0 0,6 5,5 20,7 10,8 5,4 3,6 8,6 7,2
08/09 2,0 0,4 6,4 13,0 10,2 7,8 0,2 3,8 4,8
Increase
(%)
5 50 -14 60 6 -31 n.a. 1 50
allowing the teacher, tutor and students to focus on
the design phase, since the students to perform the
practical operations at their own pace and resolve
most of the technical problem by themselves.
5 CONCLUDING REMARKS
In this work we described a three-year teaching
experience in an Information System master course
for Management Engineering students, with a focus
on business process modeling.
The shift from workflow analysis and design
using Petri Nets to a comprehensive methodology
where Business Processes are modeled according to
swim lanes affords several advantages. Technical
aspects related to process implementation in a
commercial software suite could be tackled by
decreasing the implementation and deployment
detail as much as possible.
As a further study we plan a more thorough
comparison of the different approaches and
methodologies that we have field-tested, by adapting
the analytical evaluation grid provided in (Giordano,
2002) to include swim-lanes and process metrics,
and applying it to analyze larger samples from the
available cohorts of project artifacts.
This analysis will involve relating any detected
misconceptions to evidence on how the students
have coordinated the various analysis and design
notations and to any common feature of the modeled
enterprise/business domain.
The observed increase in overall design
complexity, although based on a limited sampling
aimed at preliminary exploration of the data, is in
line with the effect of "organizational learning"
discussed in (Giordano, 2002, 2004, 2009)
when a shared memory of design artifacts is in
place to reuse past experience.
BusinessProcessModelingandImplementation-A3-YearTeachingExperience
435

REFERENCES
Bandara, W., Chand, D. R., Chircu, A. M., Hintringer, S.,
Karagiannis, D., Recker, J. C., van Rensburg, A.,
Usoff, C. and Welke, R. J., 2010. Business process
management education in academia: Status,
challenges, and recommendations. Communications of
the Association for Information Systems, 27, 743-776.
Djajalaksana, Y. M, 2011. A National Survey of
Instructional Strategies Used to Teach Information
Systems Courses: An Exploratory Investigation.
ProQuest LLC. Available at:
http://www.proquest.com/en-
US/products/dissertations/individuals.shtml.
D'Urso, D., Giordano, D., Maiorana, F., Chiacchio, F.,
2009. Coding softly a SME-targeted information
systems: towards the lean ERP age. In Proc. of the
11th Int. Conf. on The Modern Information
Technology in the Innovation Processes of Industrial
Enterprises (MITIP' 09).
Faro, A. and Giordano, D., 1998. StoryNet: an evolving
network of cases to learn information systems design.
IEE Proceedings Software, 145, 4, 119-127.
Giordano, D., 2002. Evolution of interactive graphical
representations into a design language: a distributed
cognition account. International Journal of Human-
Computer Studies, 57, 4, 317-345.
Giordano, D., 2004. Shared values as anchors of a learning
community: A case study in information systems
design. Journal of Educational Media, 29, 3, 213-227.
Giordano, D., Faro, A., Maiorana, F., Pino, C.,
Spampinato, C., 2009. Feeding back learning
resources repurposing patterns into the
"information loop": Opportunities and challenges. 9th
International Conference on Information Technology
and Applications in Biomedicine,
ITAB 2009, Larnaca.
Hamer, J., Cutts, Q., Jackova, J., Luxton-Reilly, A.,
McCartney, R., Purchase, H., Riedesel, C., Saeli, M.,
Sanders, K. and Sheard, J., 2008. Contributing
student pedagogy. SIGCSE Bull., 40, 4, 194-212.
Hammer, M., 1990. Reengineering Work: Don’t
Automate, Obliterate. Harvard Business Review, 7/8,
104-112.
Harmon, P., and Wolf, C., 2008. The State of Business
Process Management — 2008, BPTrends, available at:
http://www.bptrends.com/surveys_landing.cfm.
McConkie, G. and Rayner, K., 1975. The span of the
effective stimulus during a fixation in reading.
Attention, Perception, & Psychophysics, 17, 6, 578-
586.
Paul, J., 2012. Living in a computing world: a step
towards making knowledge of computing accessible to
every student. ACM Inroads, 3, 2, 78-81.
Pollatsek, A., Bolozky, S., Well, A. D. and Rayner, K.,
1981. Asymmetries in the perceptual span for Israeli
readers. Brain and Language, 14, 1, 174-180.
Rockinson-Szapkiw, A.J., 2011. Improving doctoral
candidates’ persistence in the online dissertation
process In Z. Abas et al. (Eds.), Proceedings of Global
Learn Asia Pacific.
Russell, N., ter Hofstede, AHM. van der Aalst, WMP,
Mulyar, N., 2006. Workflow Control-Flow Patterns: A
Revised View. BPM Center Report BPM-06-22,
BPMcenter.org. 2006. Available at:
http://workflowpatterns.com/documentation/document
s/BPM-06-22.pdf. Accessed September 7, 2012.
Sharp, A. and McDermott, P., 2001. Workflow Modeling:
Tools for Process Improvement and Application
Development, 1st Edition Artech House.
Sharp, A. and McDermott, P., 2008. Workflow Modeling:
Tools for Process Improvement and Application
Development, Artech House, 2nd Edition.
Tallapragada, K., Chewning, J., Kombo, D. and Ludwick,
B., 2012. Making SharePoint® Chemically Aware™.
Journal of Cheminformatics, 4, 1 (2012), 1-7.
Tenenberg, J. and Mccartney, R., 2008. Grounding the
Scholarship of Teaching and Learning in Practice. J.
Educ. Resour. Comput., 8, 2 (2008), 1-3.
Topi, H., Valacich, J. S., Wright, R. T., Kaiser, K. M.,
Nunamaker,J. F., Sipior J. C. and de Vreede, G., 2010.
IS 2010: Curriculum Guidelines for Undergraduate
Degree Programs in Information Systems.
Communications of the Association for Information
Systems 26 (2010), pp. 359-428.
Van der Aalst, W. and Van Hee, K.M., 2004. Workflow
management: models, methods, and systems. Mit
Press.
Weaver, P., Lambrou, N., Walkley, M., 2002. Practical
Business Systems Development Using SSADM. A
complete tutorial guide. 3d Edition, Prentice Hall.
CSEDU2013-5thInternationalConferenceonComputerSupportedEducation
436
