
Mining and Analysis of Apps in Google Play
Shahab Mokarizadeh, Mohammad Tafiqur Rahman and Mihhail Matskin
ICT School, Royal Institute of Technology (KTH), Stockholm, Sweden
Keywords:
Android Apps, Software Repository, Correlation Analysis, Topic Modeling.
Abstract:
In this paper, we focus on analyzing Google Play, the largest Android app store that provides a wide collection
of data on features (ratings, price and number of downloads) and descriptions related to application functional-
ity. The overall objective of this analysis effort is to provide in-depth insight about intrinsic properties of App
repositories in general. This allows us to draw a comprehensive picture of current situation of App market in
order to help application developers to understand customers’ desire and attitude and the trend in the market.
To this end, we suggest an analysis approach which examines the given collection of Apps in two directions. In
the first direction, we measure the correlation between app features while in the second direction we construct
cluster of similar applications and then examine their characteristics in association with features of interest.
The examined dataset are collected from Google Play (in 2012) and Android Market (in 2011). In our analysis
results, we identified a strong correlation between price and number of downloads and similarly between price
and participation. Moreover, by employing a probabilistic topic modeling technique and K-means clustering
method, we find out that the categorization system of Google Play does not respect properly similarity of
applications. We also determined that there is a high competition between App providers producing similar
applications.
1 INTRODUCTION
The increasing popularity of mobile operating sys-
tem enabled devices such as smart-phone and tablets
has boosted the development of a vast variety of mo-
bile applications, known as Apps. App is narrated
as a self-contained software with specific objectives,
requirements and capabilities (Minelli and Lanza,
2013). Apps are offered in specific software repos-
itories referred generally as App stores, where the
largest share holders are Google Play
1
, iPhone App
Store
2
and Blackberry App World
3
. App stores main-
tain generally three category of information: App de-
veloper information, App users point of view (such
as ratings, reviews and tags) and statistical and or-
ganizational information including App category and
number of downloads. The availability of this rich
source of information in a single software repository
provides a unique opportunity to analyze and under-
stand the relations between these sorts of inter-related
data. The analysis result of inter-related data pro-
vides App development industry with insights into the
1
https://play.google.com/store
2
http://www.apple.com/iphone/apps-for-iphone
3
http://appworld.blackberry.com/webstore/
added value of features that can be considered for new
products or incoming release in the presence of infor-
mation overload (Harman et al., 2012).
Among these top three repositories, we opted
Google Play, the largest Android application distribu-
tor, for analysis due to its increasing popularity and
recent fast growth. One reason for this popularity
is the fact that 72% of the products in Google Play
are offered free of cost (Sabatini, 2012). For analysis
purpose, we adopt the software repository mining ap-
proach suggested by Harman et al. (2012) and extend
it based on our requirements. We combine data from
end users, App providers and the repository itself to
build a large corpus of data to analyze the current sit-
uation of Google Play.
The overall flow of analysis steps are depicted in
figure 1 and it consists of three subsequent steps: data
extraction, data parsing and feature extraction and
correlation and cluster analysis. First, we categori-
cally crawl available Apps in the repository and re-
trieve the respective information about each App. pp.
Then, we parse the retrieved information into features
and store them into App profiles. Next we select the
features of interest for analysis and perform correla-
tion and cluster analysis. Finally, we narrate analysis
results to provide a clear vision of relationship among
527
Mokarizadeh S., Rahman M. and Matskin M..
Mining and Analysis of Apps in Google Play.
DOI: 10.5220/0004502005270535
In Proceedings of the 9th International Conference on Web Information Systems and Technologies (BA-2013), pages 527-535
ISBN: 978-989-8565-54-9
Copyright
c
2013 SCITEPRESS (Science and Technology Publications, Lda.)
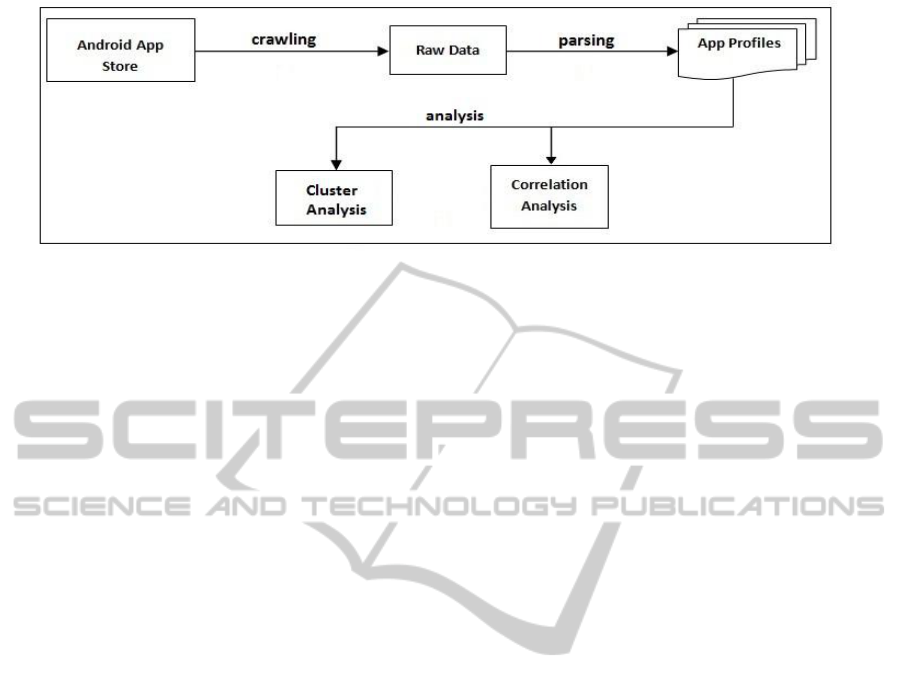
Figure 1: The overall architecture for App analysis.
the areas of interest.
The rest of this paper is organized as follows. In
Section 2 we narrate the exploited approach for App
information retrieval, information parsing and anal-
ysis objectives. Section 3 is devoted to our exper-
imental results and discussions. Section 4 reviews
related work, while conclusions and future work are
presented in Section 5.
2 ANALYSIS ROADMAP
Our analysis approach is divided into three phases:
data extraction, data parsing and correlation and clus-
ter analysis steps. We explain each of these phases in
the following paragraphs.
In the first step, we employ a web crawler to first
collect a list of all available categories. Then we ex-
ploit the regularity observed in URL of App webpages
to traverse from the category list to the associated
pages embodying App information. The collected in-
formation in this way is regarded as raw data since
they are in HTML format.
In the second step, we parse the collected raw
data in order to extract App features and store them
into App profile in a structured way. The extracted
features include App descriptions, developer infor-
mation, version, updating date, category, number of
downloads, App size, user rating, number of partici-
pants in rating, price, user reviews and security poli-
cies.
Next, we conduct analysis over extracted features
in two directions: Correlation Analysis and Cluster
Analysis.
2.1 Correlation Analysis
In the first direction, we study the pair-wise corre-
lation between different App features (rating, par-
ticipation in rating, number of downloads, price
and size). More precisely, we measure statis-
tical correlation between 10 pairs across all cat-
egories. Examples of such examined pairs are
hprice, ratingi, hprice, number o f downloadsi and
hrating, number o f downloadsi. This approach of
analysis turns out to be useful for revealing intrinsic
properties when it is applied to software repositories
(Harman et al., 2012) and it allows to draw a general
picture of the current situation of Google Play in or-
der to help the developer to understand the market,
customers desire and their attitude. We use Spearman
Rank correlation method to determine how strongly
two features are correlated based on the given sta-
tistical data extracted from App profiles. The corre-
lation of two examined features ranges from (-1) to
(+1), where (-1) and (+1) represent perfect negative
and perfect positive association of ranks respectively
and (0) indicates no association between them.
2.2 Cluster Analysis
In the second direction, we first identify clusters of
similar Apps and then examine the association be-
tween characteristics of these clusters and some fea-
tures of interest. For instance, we would like to know
if applications placed in the same category are also
functionally similar or whether App developers tend
to develop Apps from the same category. In order
to find answers for these queries, we construct clus-
ters of similar applications where the similarity is de-
rived from latent topic models (Blei, 2012) extracted
from application description. Probabilistic topic mod-
els are suites of statistical methods exploited to dis-
close the hidden thematic structure (i.e., latent top-
ics). These techniques have been successfully ex-
ploited to discover topics and trends from online jour-
nals, news, articles and consumer reviews (Yang et al.,
2011; Dokoohaki and Matskin, 2012). Using topic
modeling, we draw out the latent topics from appli-
cation textual description. The extracted latent top-
ics tend to provide a reasonable thematic information
WEBIST2013-9thInternationalConferenceonWebInformationSystemsandTechnologies
528
about application capabilities.
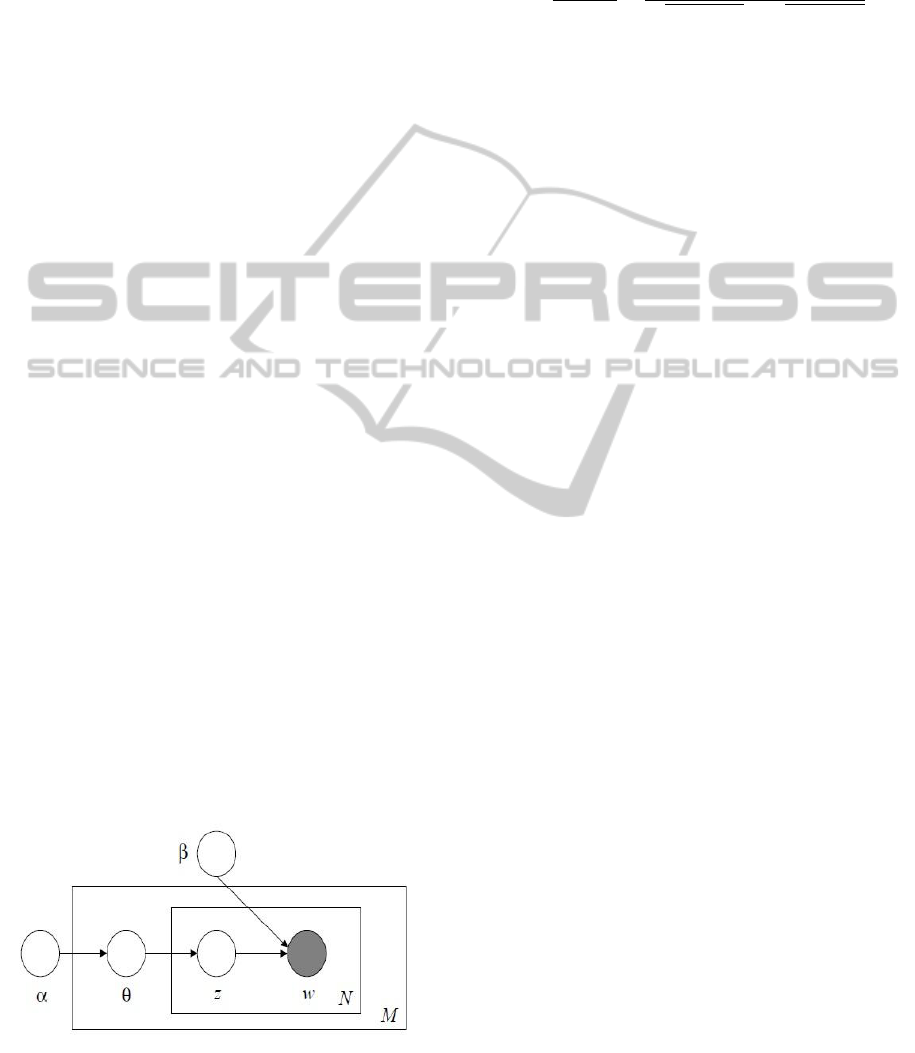
In order to identify topics models, we use Latent
Dirichlet Allocation (LDA) (Blei et al., 2003) vari-
ation of generative topic modeling technique. LDA
models each application description as a mixture of
topics, which are characterized by distributions over
words constituting the examined document (Camelin
et al., 2011). The implicit assumption behind LDA is
that a document can exhibit multiple topics. The LDA
process on document generation is graphically illus-
trated in figure 2, where plates represent iterations
(the larger plate denotes iteration over a collection of
documents while the small plate represents a single
document from which topics and words are chosen)
and circles denote Dirichlet parameters (Blei et al.,
2003). For each of (N) documents from the collection
of (M) documents, the process firstly picks up a vector
(θ) of potentially appearing topics. Next, a topic (z) is
drawn from the chosen vector for each of the words in
that document and finally, a word (w) is drawn from
the multinomial probability distribution for the cho-
sen topic (Hu, 2009).
We apply LDA to the description feature of each
App which contains textual materials narrating ap-
plication functionality. The output is a set of top-
ics where each topic is represented by a collection
of words. As an illustrative example, the topics de-
termined from the description of Discovery Channel
App are presented in table 1. Accordingly, this App
is associated to four topics (141, 85, 41 and 88) with
different weights (0.138, 0.138, 0.103 and 0.069 re-
spectively). Each topic in turn is represented by 10
distinct words.
After finding latent topics, we group Apps into
clusters based on the similarity between their topic
models. We recruit K-means bisecting clustering
technique, where the given collection is initially di-
vided into two groups, then one of these groups is
chosen and bisected further. This process continuous
until a desired number of clusters is found (Hatagami
and Matsuka, 2009). In our case, the clustering ob-
Figure 2: The graphical model for latent Dirichlet allocation
(Blei et al., 2003) where α (dimensionality vector) and β
(word probability) are the Dirichlet parameter for word and
topic distributions.
jective function is to optimize (maximize) topic sim-
ilarity between applications in each clusters. We use
cosine similarity metric denoted below to measure the
similarity between two Apps:
cos(θ) =
A • B
kAkkBk
=
∑
n
i=1
A
i
× B
i
p
∑
n
i=1
(A
i
)
2
×
p
∑
n
i=1
(B
i
)
2
(1)
In above, A and B are denoting topics while A
i
and B
i
are referring to words in these topics respectively.
3 EXPERIMENTAL RESULTS
3.1 Dataset
We perform the correlation analysis over two differ-
ent datasets while treating both datasets in the same
way. The first dataset is crawled from Google Play
in November 2012 and accommodates 21,065 Apps
from 24 categories. Admittedly, the collection size is
relatively small compared to hundreds of thousands
Android Apps globally available. This limitation was
enforced by the localization strategy of Google that
restricts access to Apps in Google Play based on the
geographical position of the origin of the request. We
refer to this dataset as Small dataset in the rest of this
paper.
The second dataset is provided by Frank et al.
(2012) crawled from Android Market (the older ver-
sion of Google Play). As they did not face the lo-
calization policy of Google by that time (2011), they
collected information of 450,933 Android Apps. We
refer to this dataset as Large dataset in the rest of this
paper. The quantity of Apps in Small dataset accounts
for only 4.67% of those captured by Large dataset.
Unlike Small dataset, which contains all accessi-
ble information and features of Apps, the collected in-
formation in the Large dataset is restricted to smaller
number of features, namely rating, price and partici-
pation in rating. The distribution of Apps over each
category for Large and Small datasets are presented
in figure 3 and figure 4 respectively.
As it can be observed figure 4, Personalization
is the largest category, which covers around 6.42%
(1,351 Apps) of the entire collection in Small dataset.
Examples of the personalized Apps accommodated in
this category are: Album Art Live Wallpaper, Real
Fingerprint Scanner Lock, Raysof Light and Zip-
perHD Go Launcher EX Locker. In contrast, Li-
braries and Demo category is the smallest group em-
bodying only 492 Apps in Small dataset. We iden-
tified that most of the applications (9,378 cases) are
MiningandAnalysisofAppsinGooglePlay
529
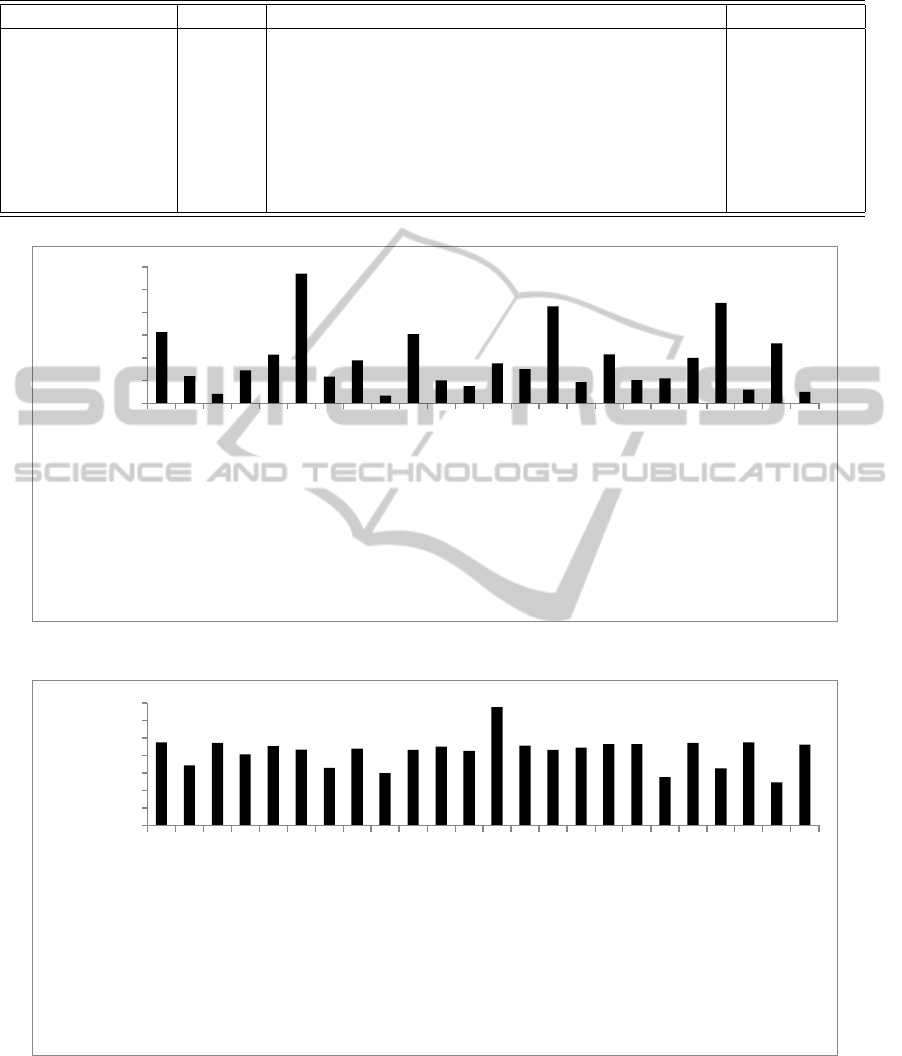
Table 1: Example of the topics identified from App descriptions obtained using LDA technique.
AppName TopicID Topic Words Topic Weights
Discovery Channel
141
85
41
88
videos app youtube watch download photos enjoy
content official easily
TV watch shows channels channel live media
favorite series network
quotes life famous world knot quote people popular
collection tie
news latest local sports stories breaking articles
video coverage entertainment
0.138
0.138
0.103
0.069
31224
12048
4045
14461
21291
57061
11837
18802
3356
30447
10072
7654
17503
15084
42642
9298
21521
10275
10965
19955
44068
6084
26264
4976
0
10000
20000
30000
40000
50000
60000
Books & Reference
Business
Comics
Communication
Education
Entertainment
Finance
Health & Fitness
Library & Demo
Life Style
Media & Video
Medical
Music & Audio
News & Magazines
Personalization
Photography
Productivity
Shopping
Social
Sports
Tools
Transportation
Travel & Local
Weather
Number of App
App Category
Figure 3: Quantity of Apps in each category for the Large dataset.
948
689
947
814
906
870
658
881
596
862
899
852
1351
911
862
890
926
931
554
943
652
949
492
921
0
200
400
600
800
1000
1200
1400
Lifestyle
New&Magazine
Productivity
Finance
Photography
Business
Transportation
Health & Fitness
Shopping
Medical
Book &…
Social
Personalization
Media & Video
Sports
Travel & Local
Education
Entertainment
Comics
Music & Audio
Weather
Tools
Library & Demo
Communication
Number of App
App Category
Figure 4: Quantity of Apps in each category for the Small dataset.
classified under Everyone group, which means that
these Apps do not host any user generated content
or they do not allow users to communicate with each
other or they must not ask users for their location.
Frank et al. (2012) showed that the assessment of
App’s reputation is not reliable if it is only based on
the average of user ratings because average rating it-
self is an unreliable measure. So they suggested to
combine the quantity of participated users in ratings
with the average of ratings in order to obtain a fair
WEBIST2013-9thInternationalConferenceonWebInformationSystemsandTechnologies
530
1120
270
692
959
1362
1699
1813
1588
1586
1285
1375
945
844
709
557
535
418
375
309
231
415
174
158
132
95
102
73
81
64
43
74
23
22
17
13
21
7
6
1
1
113
0
500
1000
1500
2000
5
4.8
4.6
4.4
4.2
4
3.8
3.6
3.4
3.2
3
2.8
2.6
2.4
2.2
2
1.8
1.6
1.4
1.2
1
Number of Apps
Ratings
Figure 6: Distribution of user ratings provided over Apps for the Small dataset.
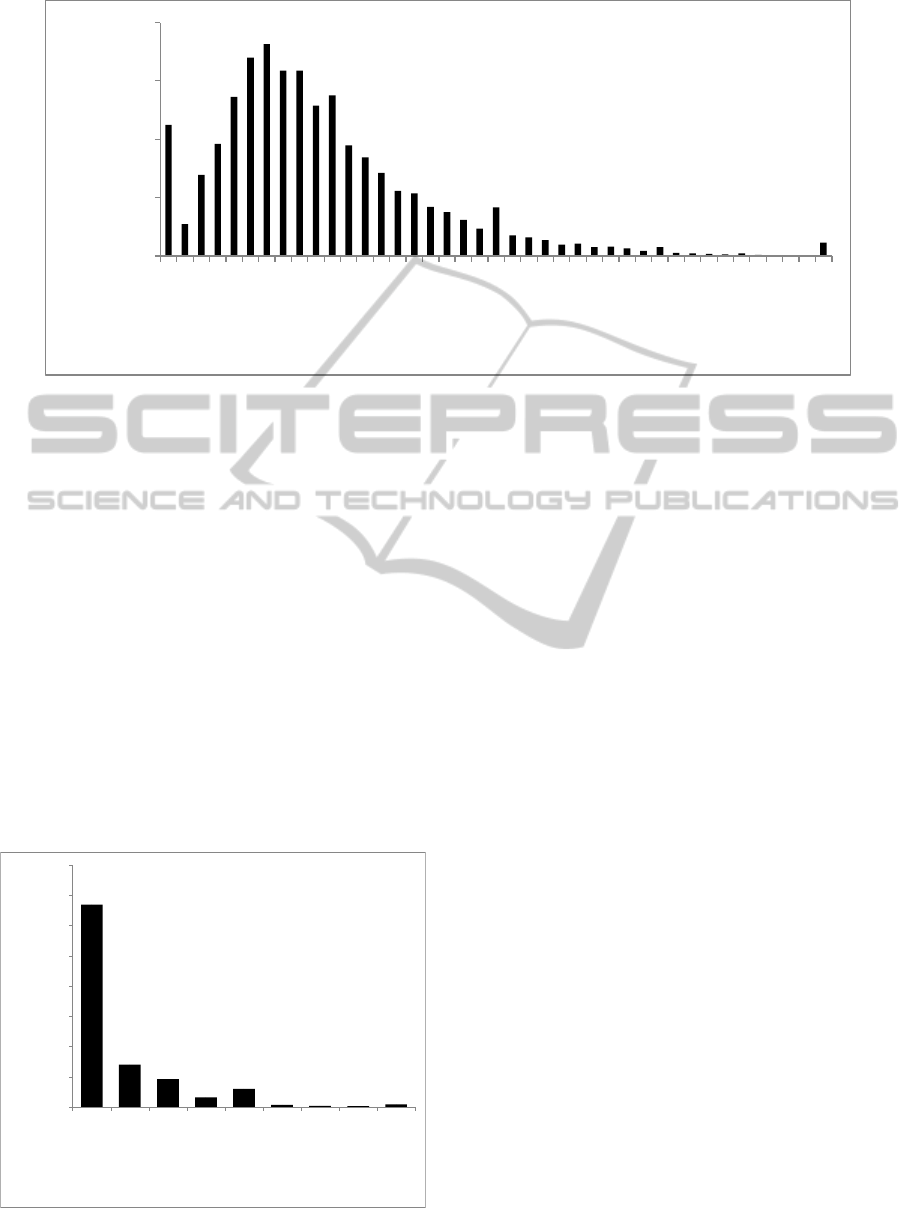
measure about popularity of an App. According to
figure 5, vast majority of Apps (13,384 cases) in the
Small dataset are rated by 1 to 300 users. This in-
dicates that the users have very low intention to rate
an App after experiencing it. We also found that more
than 50% of Android Apps in Google Play are offered
as free (56.5% are free and 43.5% are paid Apps). The
overall statistics on App size reveals that the size of
popular Apps is generally smaller than 30,000 kb. As
can be seen in figure 6, the average rating of 4.4 (out
of 5.0) scores the peak (1,813) while the majority of
the Apps have rating in the range of 3.8 to 4.8.
3.2 Results
3.2.1 Correlation Analysis Results
With regard to Small dataset, we did not find any cor-
13384
2818
1847
647
1202
155
77
60
177
0
2000
4000
6000
8000
10000
12000
14000
16000
1-300
301-1k
1k-3k
3k-5k
5k-30k
30k-50k
50k-70k
70k-100k
100k+
Number of App
Total Participation
Figure 5: User participation in app rating for the Small
dataset.
relation between rating and none of number of down-
loads, participation and size. This suggests that App
users rarely provide ratings for the exploited Apps.
We also observed the same pattern of correlation be-
tween size and rating, price, number of downloads
and participation revealing the fact that users are not
size sensitive.
At the same time, we found a strong
(negative) correlation between pairs
of hprice, number o f downloadsi and
hprice, participationi. This is due to the fact
that if price goes up, then number of downloads
goes down and consequently less number of users
will participate in App rating. This conveys that
customers are more attracted more to free apps
than paid ones for each category. The correlation
measures for pairs hprice, number o f downloadsi
and hprice, participationi account for −0.6757 and
−0.4810 respectively.
Furthermore, we identified a strong
(positive) correlation for the pair of
hnumber o f download, participationi for all
categories where the correlation measure for most
of the categories is above 0.9, as can be seen in
figure 7. This indicates that provided ratings are
mainly coming from users who have downloaded
(and likely used) them. We also measured the
percentage of average similarity between applications
that are classified under the same category. Figure 9
illustrates the results of inside category similarity for
eight categories as representative categories denoting
a general trend in the whole collection. Accordingly,
applications in News and Magazines category are
most similar to each other (by average similarity of
44.77%) while applications classified under Lifestyle
category are denoting the least similarity to each
MiningandAnalysisofAppsinGooglePlay
531
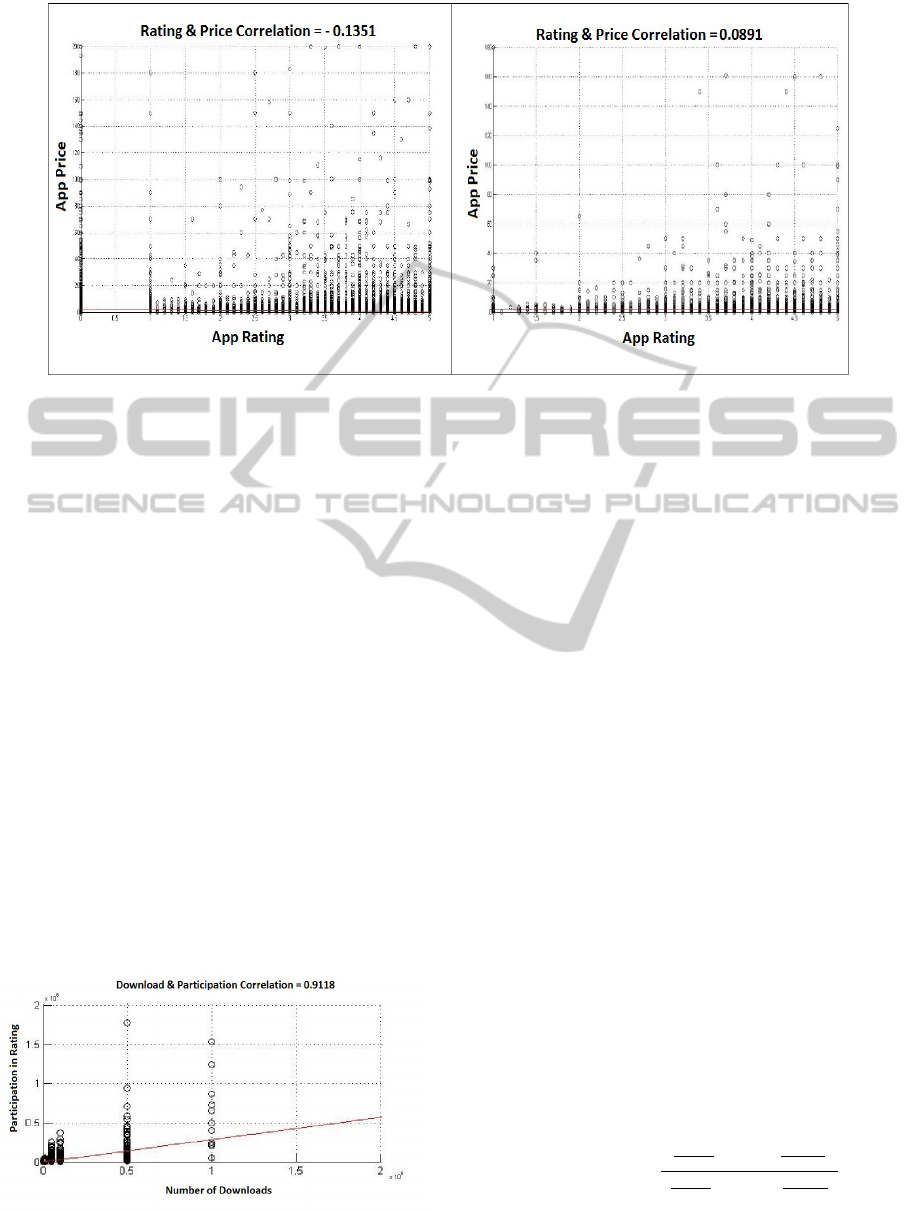
Figure 8: Price and Rating correlation between the Large dataset (left) and the Small dataset (right).
other (by average similarity of 5.33%). Hence, we
can conclude that the provided taxonomy system in
Google Play is not considering the similarity of Apps
placed in the same category appropriately and this
needs to be reworked.
Turning to the correlation analysis of Large
dataset, we observed quite similar correlation trend
for hparticpation, pricei and hparticipation, ratingi.
However, we detected minor differences in correla-
tion coefficients for hprice, ratingi. While we found
almost no correlation (+0.0891) between these fea-
tures in Small dataset, we obtained negative correla-
tion (-0.1351) between same features in Large dataset.
At the same time, as can be seen in figure 8 the de-
picted graph of correlation measures for both datasets
across different ratings are quite similar. Therefore,
we can conclude that if Small dataset is expanded to
accommodate more Apps, we could have obtained the
same correlation results as Large dataset.
3.2.2 Cluster Analysis Results
As pointed out earlier in Section 2.2, the cluster of
Figure 7: Representation of strong positive correlation be-
tween Download and Participation for the Small dataset.
similar Apps are constructed based on the similarity
between topic models extracted from App descrip-
tions. For similarity measure, we use the cosine
similarity presented in equation 1. For identifying
topic models we utilized MALLET toolkit (McCal-
lum, 2012). We trained MALLET with 20,409 prop-
erly constructed App profiles. As there is no certain
rule for the number of topics (i.e., the size of the set)
that can be extracted, we exploited Newman (New-
man, 2011) heuristics for estimating the proper quan-
tity of topics. According to his guideline, 200 is a
suitable topic quantity for 10,000 to 100,000 docu-
ments where each topic is made up with 10 distinct
words. This means that each App can be represented
by a combination of small number of these 200 topics.
Each topic is also associated with a weight obtained
from its distribution.
The clustering is done using Cluto toolkit (Zhao
et al., 2005). To this end, we used the identified
topics and their weights to generate an input matrix
for Cluto. In order to determine a proper number of
clusters, we performed clustering with different clus-
ter sizes and measured the quality of clustering ef-
forts. The quality of a clustering effort is measured
using: internal similarity(ISim) that measures how
closely related are objects inside a cluster and external
similarity(ESim) that measures how distinct or well-
separated a cluster is from other clusters. We consider
the harmonic average of these metrics (F-Measure) as
quality measure of a clustering effort:
F − Measure = 2 ∗
(
∑
ISim
n
) ∗ (1 −
∑
ESim
n
)
(
∑
ISim
n
) + (1 −
∑
ESim
n
)
(2)
In above n denotes the total number of clusters.
We summarized the results of several clustering ef-
WEBIST2013-9thInternationalConferenceonWebInformationSystemsandTechnologies
532
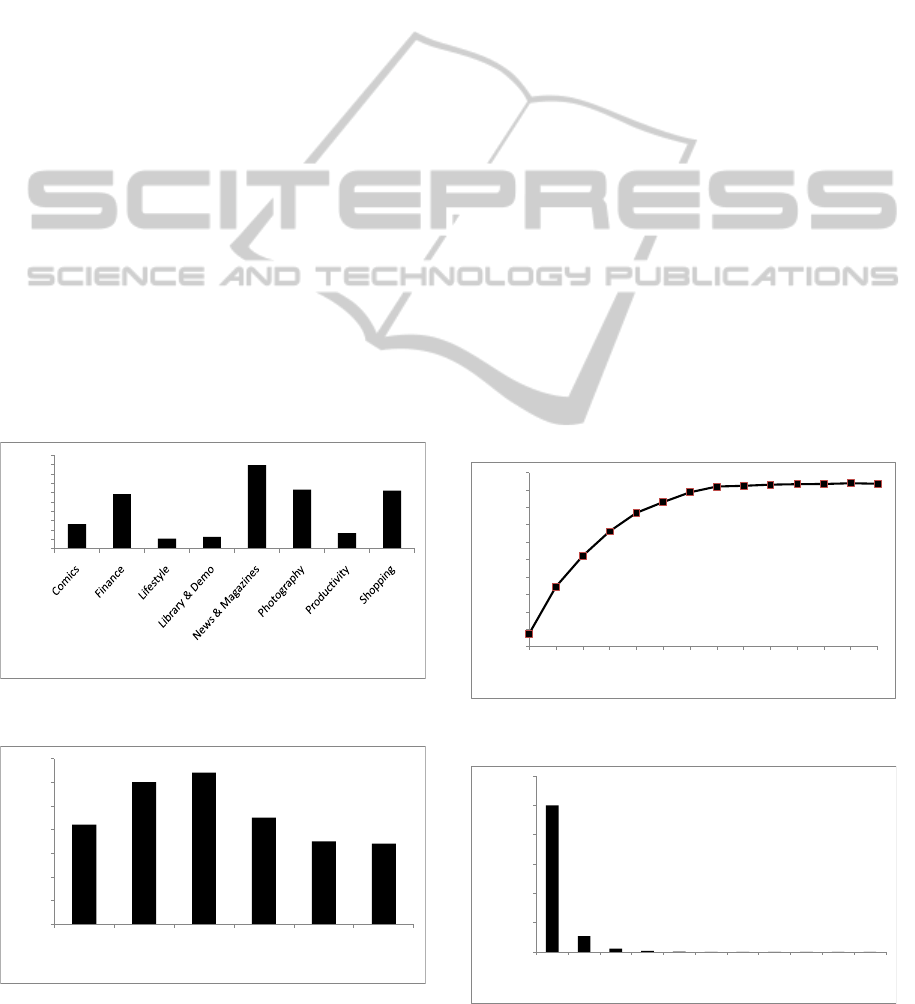
forts in figure 11. Accordingly, it can be seen that
cluster size of 280 provides the best performance as it
exhibits the highest F-Measure value.
We examined characteristics of these 280 con-
structed clusters. Accordingly, the highly rated clus-
ters are from Phone Calling and then Music themes
with average rating of 4.85 and 4.8 respectively. The
top participated clusters are related to group of appli-
cations providing latest updates for different phones,
and then to SMS based applications with the average
participation of 628.33 and 463.3. We also plotted
the quantity of distinct App developers in each clus-
ter and summarized the results in figure 10. Accord-
ingly, it can be seen that a cluster of similar applica-
tions is developed by at least 10 different providers.
While few clusters are embodying more than 120 dif-
ferent providers, in average each cluster of similar
applications are representing 20 to 40 different App
developers. This reveals a high competition between
providers producing similar applications.
Our analysis over the Small dataset reveals that
around 90% of App developers provide application
only from one category, while only small fractions of
developers, less than 10%, produce Apps associated
to two or more categories as can be concluded from
figure 12. Moreover, as already illustrated in figure
9, not all applications placed in a same category are
necessarily similar where similarity is derived from
13.11
29.31
5.33
6.19
44.77
31.67
8.4
31.16
0
5
10
15
20
25
30
35
40
45
50
App Average Similarity [%]
App Category
Figure 9: Similarity percentage for apps in few categories
for Small dataset.
42
60
64
45
35
34
0
10
20
30
40
50
60
70
1--10
11--20
21--40
41--80
81--120
121--243
Number of Clusters
Number of Developers
Figure 10: Distribution of number of app developers in de-
termined clusters.
affinity between topic models extracted from applica-
tion textual description. This seminal finding suggests
that if only user’s past experience with certain App
developers is considered for providing recommenda-
tion, more likely the user does not receive recommen-
dation for similar Apps.
4 RELATED WORK
Main focus of the research on smart phone appli-
cations is security and permission issues. Although
service providers are actively taking steps to secure
their repositories from suspicious Apps, researches
are still concentrating on different views. Frank et
al.Frank et al. (2012) investigated permission request
pattern by differentiating Android applications into
low-reputation and high-reputation categories, where
they have used rating and number of reviews to build
their reputation metric. Enck et al. (2011) focused
on the top downloaded Apps in order to find the per-
vasive use or misuse of personal or phone identifier
while Felt et al. (2011) studied Android applications
to determine developers behavior upon App privilege
setting and found the intention of following least priv-
ilege setting by the developers. They identified that
around one-third of the total App that they examined
are over-privileged among which more than 50% re-
quest one extra permission where 6% request more
0.33757
0.47289
0.56113
0.63182
0.68521
0.71593
0.74379
0.76037
0.76254
0.76572
0.76727
0.7676
0.76981
0.76849
0.3
0.35
0.4
0.45
0.5
0.55
0.6
0.65
0.7
0.75
0.8
20
40
60
80
100
120
140
170
200
220
240
260
280
300
F Measure
Number Of Cluster
Figure 11: Performance of clustering algorithm across dif-
ferent cluster size.
9999
1096
236
87
26
6
3
4
1
1
1
0
2000
4000
6000
8000
10000
12000
1
2
3
4
5
6
7
8
9
12
16
Number of Developer
Number of Category
Figure 12: Developer Contribution over App category.
MiningandAnalysisofAppsinGooglePlay
533

than four redundant permissions. Chia et al. (2012)
analyzed the most permission requesting Apps across
three categories: free Apps, Apps with mature content
and Apps with similar name to popular ones. They
identified that the popular Apps request permission
more than the average.
De et al. (2010) targeted application recommen-
dation problem. They developed an open source rec-
ommendation system by utilizing the Web mining
technique over implicit ratings. Other researches fo-
cus on software repository mining to retrieve infor-
mation from different sources that are available in
unstructured textual format such as emails, source
codes, documentations (Hassan, 2008). Zhong and
Michahelles (2013) examined the distribution of sales
and downloads in Google Play. They concluded that
Google Play is a superstar market dominated mostly
by popular Apps. They identified that these superstar
Apps are making up the vast majority of downloaded
or purchased applications and at the same time receiv-
ing higher user ratings. Harman et al. (2012) ap-
plied this mining technique to Blackberry App store
by considering it as a software repository and claimed
their research as the first work in the literature. They
analyzed the relationship among apps of Blackberry
App store where the relationship is developed be-
tween mined features and non-technical information.
They focused only on three features (rating, price and
download) to provide insights to the developers where
free apps are overlooked. Our research goal is the ex-
tension to their works but we have analyzed all the
possible relationships among different features of An-
droid apps, which can help developers to understand
the current scenario of Google Play. Furthermore, we
have figured out the technical dissimilarity among the
apps in same category that precedes us to cluster them
into technically similar groups.
5 CONCLUSIONS AND FUTURE
WORK
In this paper we suggested an analysis approach
suitable for examining intrinsic properties of App
repositories in general. As a case study, we fo-
cused on analyzing Google Play, the largest An-
droid app store. The overall objective of this anal-
ysis effort is to provide in-depth insight about in-
trinsic properties of such app repositories. Using
this approach, we identified a strong negative cor-
relation between hprice, number o f downloadsi and
hprice, participationi and a strong positive correla-
tion between hnumber o f download, participationi.
Moreover, by employing a probabilistic topic mod-
eling technique and K-means clustering method, we
found out that categorization system of Google Play
does not respect properly similarity of applications.
We also identified that there is a high competition be-
tween App providers producing similar applications.
As our future work, we are aiming for incorpo-
rating other features of applications, such as reviews,
collected from other commercial repositories and an-
alyze their correlation with already examined features
(such as ratings) of the apps. Moreover, we aim to de-
velop a recommendation system exploiting the iden-
tified correlation features to recommend applications.
REFERENCES
Blei, D. M. (2012). Probabilistic topic models. Commun.
ACM, 55(4):77–84.
Blei, D. M., Ng, A. Y., and Jordan, M. I. (2003). La-
tent dirichlet allocation. J. Mach. Learn. Res., 3:993–
1022.
Camelin, N., Detienne, B., Huet, S., Quadri, D., and
Lef
`
evre, F. (2011). Unsupervised concept annotation
using latent dirichlet allocation and segmental meth-
ods. In Proceedings of the First Workshop on Unsu-
pervised Learning in NLP, pages 72–81. Association
for Computational Linguistics.
Dokoohaki, N. and Matskin, M. (2012). Mining divergent
opinion trust networks through latent dirichlet alloca-
tion. In 2012 IEEE/ACM International Conference
on Advances in Social Networks Analysis and Mining,
pages 879–886. IEEE Computer Society.
Harman, M., Jia, Y., and Zhang, Y. (2012). App store min-
ing and analysis: Msr for app stores. In Proceedings
of the 9th Working Conference on Mining Software
Repositories (MSR ’12), pages 108–111. IEEE.
Hassan, A. E. (2008). The road ahead for mining software
repositories. In Frontiers of Software Maintenance,
2008, pages 48–57. FoSM.
Hatagami, Y. and Matsuka, T. (2009). Text mining with
an augmented version of the bisecting k-means algo-
rithm. In Proceedings of the 16th International Con-
ference on Neural Information Processing: Part II,
pages 352–359. Springer-Verlag.
Hu, D. J. (2009). Latent dirichlet allocation for text, images
and music. Citeseer.
McCallum, A. K. (2012). Mallet: A machine learning
for language toolkit. http://mallet.cs.umass.edu, Ac-
cessed: 30/06/2012.
Minelli, R. and Lanza, M. (2013). Software analytics for
mobile applications - insights & lessons learned. In
17th IEEE European Conference on Software Mainte-
nance and Reengineering (CSMR 2013). IEEE Com-
puter Society Press. To Appear.
Newman, D. (2011). How to do your own topic model-
ing. Collaborative Learning Center, Yale University,
New Haven (2011). http://ydc2.yale.edu/node/362/
attachment.
WEBIST2013-9thInternationalConferenceonWebInformationSystemsandTechnologies
534

Sabatini, M. (2012). Google play (android market) vs apple
app store 2012. http://www.androidauthority.com/,
Accessed: 05/01/2013.
Yang, T., Torget, A. J., and R., M. (2011). Topic mod-
eling on historical newspapers. In Proceedings of
the 5th ACL-HLT Workshop on Language Technology
for Cultural Heritage, Social Sciences, and Human-
ities, pages 96–104. Association for Computational
Linguistics.
Zhao, Y., Karypis, G., and Fayyad, U. (2005). Hierarchi-
cal clustering algorithms for document datasets. Data
Min. Knowl. Discov., 10(2):141–168.
MiningandAnalysisofAppsinGooglePlay
535
