
Multi-viewpoint Visibility Coverage Estimation for 3D Environment
Perception
Volumetric Representation as a Gateway to High Resolution Data
Marek Ososinski and Fr
´
ed
´
eric Labrosse
Department of Computer Science, Aberystwyth University, Aberystwyth, SY23 3DB, U.K.
Keywords:
Visibility Coverage Estimation, Multi Viewpoint, 3D Environment Perception, Volumetric Representation,
Art Gallery Problem.
Abstract:
Estimation of visibility is a crucial element of coverage estimation of large, complex environments. This non-
probabilistic problem is often tackled in a 2D context. We present an algorithm that can estimate the visibility
of a high resolution scene from a low resolution 3D representation. An octree based voxel representation
provides a dataset that is easy to process. Voxel occupancy properties ensure a good approximation of visibilty
at high resolution. Our system is capable of producing a reasonable solution to the viewpoint placement issue
of the Art gallery problem.
1 INTRODUCTION
Environments are often represented as maps or plans.
These 2D metric projections are adequate in capturing
the main dimensions of the environment in question,
however, they fail to capture the 3D geometry of the
objects within the space. To capture the full geometry
of the environment a 3D representation is required.
Such representation can be created using terrestrial
laser scanning. However, a single laser scan is often
not enough to represent the whole environment. In
such case multiple scans are acquired and registered
together to form a complete laser scan. High resolu-
tion laser scanning is a lengthy process, the required
time is directly related to the number of scans (view-
points). We propose a method that is able to estimate
the position of the required viewpoints. Our method
is based on a completeness of a high resolution scan
based on a low resolution 3D representation of the en-
vironment.
Multi-viewpoint visibility estimation is part of a
larger area of environment perception, which is of-
ten divided into low level perception, high level spa-
tial awareness and scene understanding. A multitude
of techniques exist that aid environment perception.
3D environments can be reconstructed using monoc-
ular and stereo cameras as well as range sensors. The
monocular multi view systems such as (Furukawa and
Ponce, 2010; Furukawa et al., 2010) rely on identify-
ing small rectangular patches within images and us-
ing the relative positions within multiple images to
estimate 3D spatial relationships. The resulting patch
model is converted to a mesh. The recreation of the
environment is limited to perception, modeling the
environment does not provide any understanding of
it. Other multi-view stereo system (Hernandez et al.,
2007) use a deeper understanding of the scene by
foreground-background segmentation and graph-cut
techniques to extract 3D models. This is however lim-
ited to singular objects. Some methods use volumet-
ric representation to detect occlusions (Zhang et al.,
2011) that allow Simultaneous localisation and map-
ping systems such as (Roussillon et al., 2011), which
uses landmark detection and odometry information
to generate terrain model, and (Endres et al., 2012),
which uses SIFT based attitude estimation to regis-
ter together range images. The localisation methods
often limit the understanding of the scene to detecting
position of the camera/robot. They provide awareness
of a single position within a given space, rather than
information about that space.
All the aforementioned techniques are modeling
the world by attempting to understand it. Some with
more success than others, they provide an insight into
the world increasing the detail of our perception. The
Art gallery problem on the other hand is attempting to
provide an insight into the environment itself. The Art
gallery problem is addressing the issue of placing the
least amount of viewpoints within any given space to
achieve the complete visibility coverage of that space.
462
Ososinski M. and Labrosse F..
Multi-viewpoint Visibility Coverage Estimation for 3D Environment Perception - Volumetric Representation as a Gateway to High Resolution Data.
DOI: 10.5220/0004693504620469
In Proceedings of the 9th International Conference on Computer Vision Theory and Applications (VISAPP-2014), pages 462-469
ISBN: 978-989-758-004-8
Copyright
c
2014 SCITEPRESS (Science and Technology Publications, Lda.)
This non probabilistic problem requires a certain de-
gree of spatial awareness derived from understanding
occlussions within the given space.
The basic Art gallery problem was solved
(Chvatal, 1975) and proven (Fisk, 1978). Since then
countless variations have been explored. Most of the
approaches attempt to solve the problem using 2D
polygons, often extending the problem to include re-
flex vertices (Iwerks and Mitchell, 2012). Others al-
low inconsistencies within the polygons such as holes
(Hoffmann et al., 1991) or edge variations (Cano
et al., 2013), however rarely expanding into the 3D
(Trucco et al., 1997). Use of the maximum cardinality
of the dataset as a starting point and incremental op-
timisation of their position leading to the elimination
of the obsolete viewpoints has been explored (Bottino
and Laurentini, 2011). This approach is viable for 2D
datasets but maximum cardinality of real-world 3D
datasets would provide an impractically large set of
potential viewpoints. A piecewise solution reducing
a concave polygon into a set of convex polygons has
been used (Cano et al., 2013). A method relying on
heuristic placement of potential viewpoints was pre-
sented in (Amit et al., 2010). A union of a set of
viewpoints positioned close to the vertices and a set
of viewpoints positioned in centers of mass of decon-
structed convex polygons was used. This initial place-
ment allows an efficient reduction of obsolete view-
points. An incremental multi-agent system capable
of repositioning the agents positioned near vertices
can be used to improve the performance (Obermeyer
et al., 2011).
Our method provides a way of estimating 3D vis-
ibility coverage using a data driven approach. Unlike
the mathematical geometry driven methods it is de-
signed to work with real world data which complex-
ity, even after reduction makes many other methods
impractical.
The rest of the paper is structured as follows: Sec-
tion 2 describes our method for visibility coverage es-
timation, Section 3 describes the algorithm for view-
point position detection and Sections 4 and 5 provide
further evaluation and discussion of our method.
2 ENVIRONMENT MODELING
The common way of representing 3D objects is the
use of vertices. These points in space can be stored
as pointclouds or joined together using edges to cre-
ate meshes. The data stored in such a way does not
retain the information about spatial distribution of the
data. This causes difficulties in reasoning about the
environment. An alternative way of representing the
data is volumetric representation. This relies on rep-
resenting the data on a regular grid in 3D space. We
use an octree based occupancy grid OctoMap (Hor-
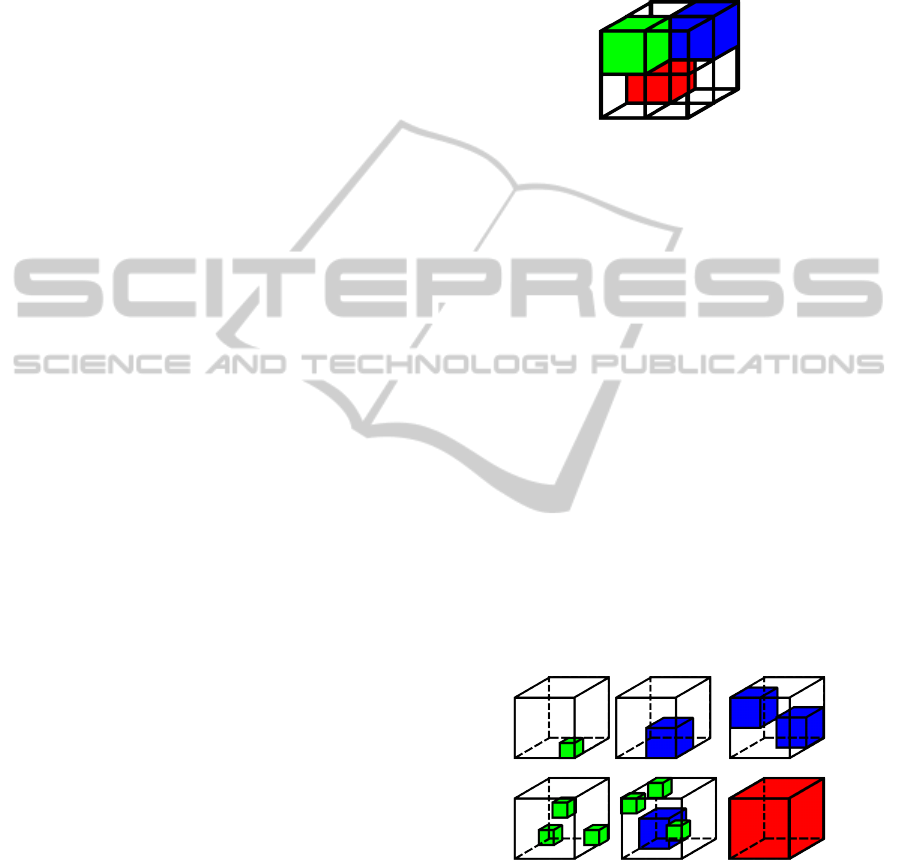
nung et al., 2013). Figure 1 shows multiple scales of
an octree based voxel representation.
Figure 1: Octree based voxel representation. Each voxel
represents 8 voxels on a lower level of an octree.
Such representation retains the spatial informa-
tion, however it compromises the colour/intensity in-
formation. Our method relies on the distribution of
occupancy within the 3D space. Information such as
colour and intensity is ignored.
2.1 Voxel Interpretation
Voxels are volumes of space delimited by a regular
grid. Each voxel has a resolution defined as the length
of the edge of a cube delimiting the space. The main
significant property of a voxel is occupancy: a voxel
can either be empty or occupied. The empty voxel
guarantees that all the voxels contained within the
bounds of that voxel are empty. This means that the
space delimited by the bounds of an empty voxel is
free of any obstructions. It is an important property
as it allows the assumption that the space delimited
by an empty voxel will remain empty at a higher res-
olution of an octree.
Figure 2: Possible data distribution within a voxel.
As shown in Figure 2 an occupied voxel can be
partially empty. When working with real world data
voxels are rarely completely full. Voxel occupancy
has an interesting property, if the voxel is occupied,
at least one voxel contained within the volume of the
current voxel is occupied. Using octree based repre-
sentation means that if at least one out of eight vox-
els contained within the current voxel is occupied, the
current voxel is occupied.
Multi-viewpointVisibilityCoverageEstimationfor3DEnvironmentPerception-VolumetricRepresentationasaGateway
toHighResolutionData
463
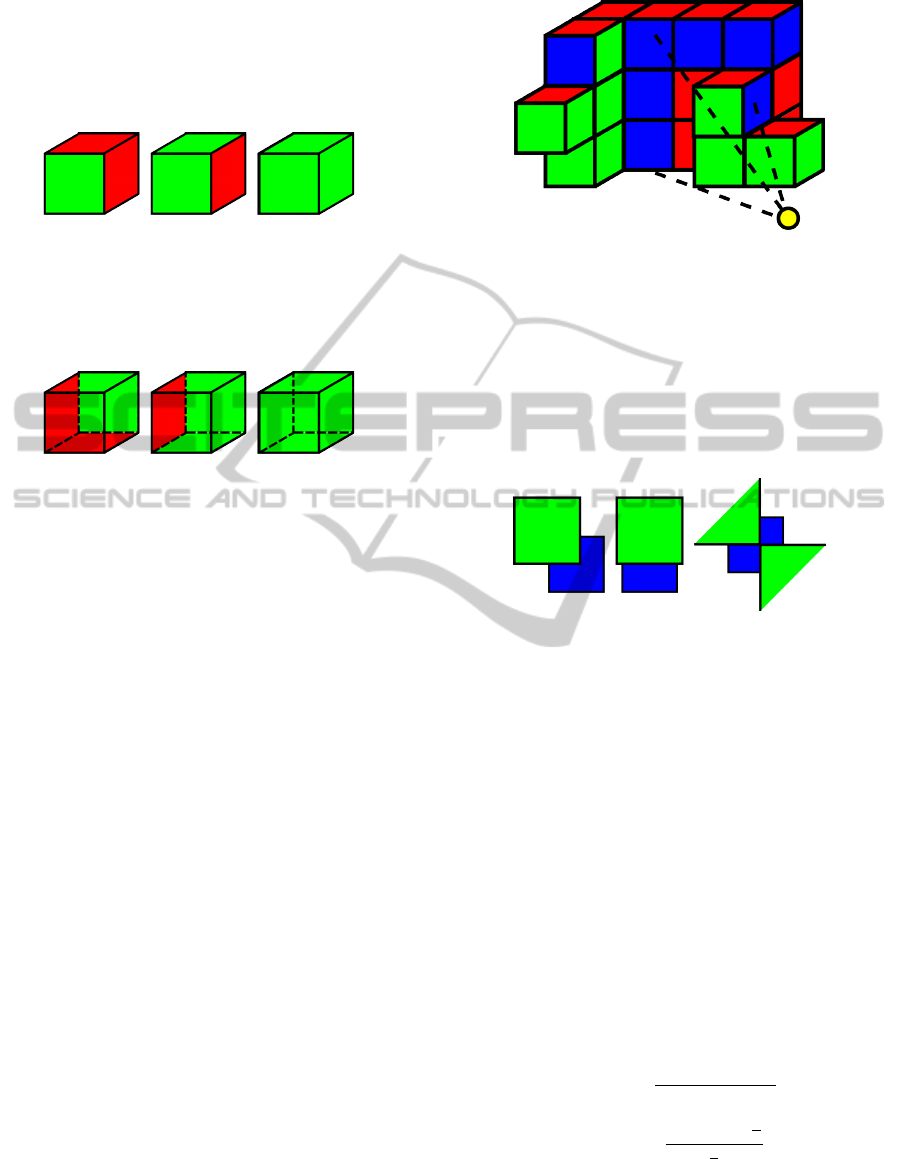
These properties require further consideration
while trying to estimate the visibility of a voxel from
a given viewpoint. If a voxel was a rigid cube at most
3 out of its 6 faces would be visible from any view-
point, see Figure 3.
Figure 3: Visible faces of a voxel in green. One, two and
three visible faces.
We know that an occupied voxel can be partially
empty, which leads to potential visibility of the inner
faces of the voxel, see Figure 4.
Figure 4: Visible inner faces of a voxel in green. One, two
and three visible faces.
Each voxel has the potential to be both full and
empty at the same time. The properties of occupancy
in a multi scale environment support the hypothesis
that any given voxel is partially empty. To account for
the empty space while estimating the visibility each
face is treated as a separate entity, as if the voxel they
are a part of was transparent.
2.2 Visibility Estimation
The visibility of a voxel is estimated in two stages.
The perception stage checks whether a voxel is visible
from the given viewpoint. The awareness stage is an
estimation of how well the voxel can be seen.
2.2.1 Voxel Perception
Thanks to the regular grid and unified voxel size
there is a limited number of interactions between vox-
els viewed from a fixed viewpoint. The occlusions
caused by the voxels closer to the viewpoint can cause
some faces not to be visible or to be partially visible.
This leads to three classes of visibility: full visibility,
partial visibility and no visibility, see Figure 5.
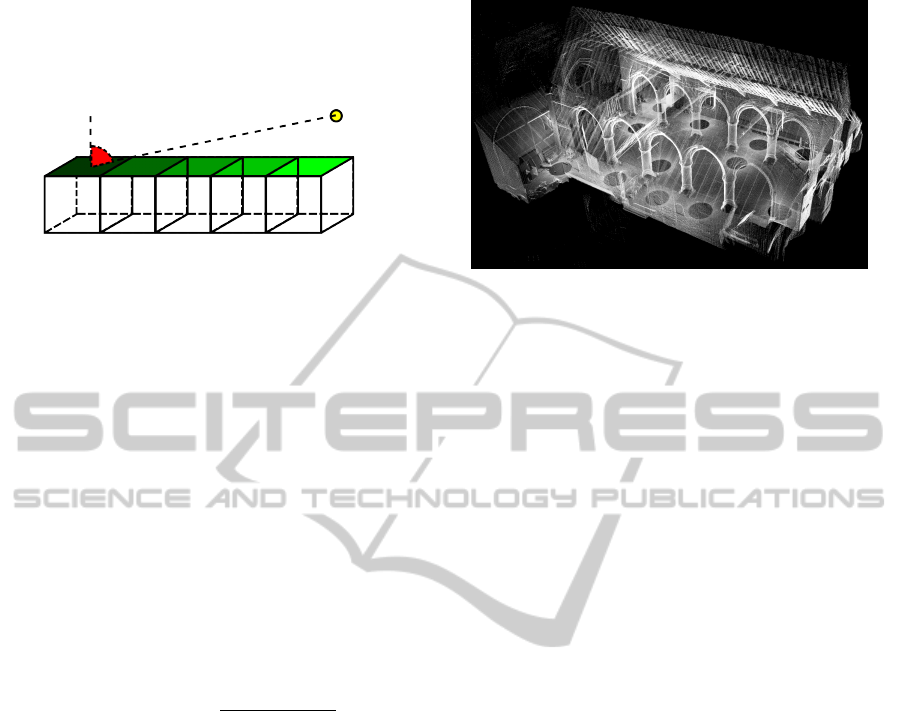
A corner is considered visible if the ray cast from
the viewpoint towards the corner terminates on one of
the four voxels adjacent to that corner. The approxi-
mation is caused by an undefined termination location
of ray cast algorithm (Amanatides and Woo, 1987) in
this situation.
A face of a voxel can be classified as fully visible
only when all its four corners are visible. A face is
Figure 5: Example face visibility from the yellow view-
point. Green – fully visible, Blue – partially visible, Red
– not visible
classified as partially visible if at least one corner is
visible, but not all corners are visible from the given
viewpoint, see Figure 6. A face is not visible if no cor-
ners are visible from the given viewpoint. In a rare oc-
casion that part of the face would be visible from the
viewpoint, but no corners are visible that face would
be considered not visible.
Figure 6: Partially visible faces. Three, two and two visible
corners.
2.2.2 Visibility Value
Visibility value is a value ranging from 0 to 1, where 0
means not visible and 1 means perfect conditions for
visibility, partially relies on the voxel perception clas-
sification. The partially visible face will get a value of
V = 0.3. Only the fully visible faces have their visi-
bility value computed as in Equation 3 where V is vis-
ibility, D is the normalised distance between a view-
point v
p
and a face f , d is the distance between the
viewpoint v
p
and the center of the face f of a voxel,
R
min
is the minimum range of the data acquisition de-
vice, R
max
is the maximum range of the data acquisi-
tion device, A is the normalised angle of incidence, θ
is the angle of incidence of the ray cast from the view-
point v
p
onto face f of the voxel expressed in radians.
D(v
p
, f ) =
d(v
p
, f )− R
min
R
max
(1)
A(v
p
, f ) =
θ(v
p
, f )−
π
2
π
2
(2)
V (v
p
, f ) = 0.5 + 0.3×D(v
p
, f )+0.2 × A(v
p
, f ) (3)
The visibility is composed of a perception class
constant (0.3 for partially visible faces and 0.5 for
VISAPP2014-InternationalConferenceonComputerVisionTheoryandApplications
464
fully visible faces) and, in case of fully visible faces,
weighted normalised distance between the viewpoint
v
p
and face f and a weighted normalised angle of in-
cidence, see Figure 7.
Figure 7: Visibility is affected by both distance and angle
of incidence.
The constants were empirically chosen to repre-
sent the significance of a given component of the vis-
ibility computation. 0.3 was chosen for partially visi-
ble faces to allow a small input to the visibility value.
0.5 was chosen for full visibility as the ability to see a
face plays a major role in visibility computation and is
more important than distance and angle of incidence.
The combined influence of distance and angle of in-
cidence carry the same weight as the full visibility.
The distance is more important out of the pair as it
influences the potential resolution, however the angle
of incidence follows shortly. This led to the assign-
ment of weights 0.3 for distance component and 0.2
for angle of incidence.
Global visibility is defined as a normalised sum of
the maximum visibilities of the faces:
^
v
p
∈S
G
v
(S, F) =
∑
f ∈F
max(V (v
p
, f ))
|F|
(4)
Equation 4 describes the global visibility G
v
(S, F)
as a sum of the maximum visibility V of a face f from
any viewpoint v
p
belonging to a set of all selected
viewpoints S normalised by the number of faces |F|.
3 MULTI-VIEWPOINT SYSTEM
To detect the position of the viewpoints a low reso-
lution representation of the environment is required.
Such representation can be acquired using one of
the methods described in Section 1 or other mapping
tools. We use a decimated laser scan as a base for gen-
eration of the volumetric representation, see Figure 8,
to guarantee the high resolution ground truth.
3.1 Environment Representation
The 3D representation is converted to an octree based
volumetric representation of resolution 0.1 m. Such
voxel representation approximates most geometric
Figure 8: The laser scan of the environment used for testing.
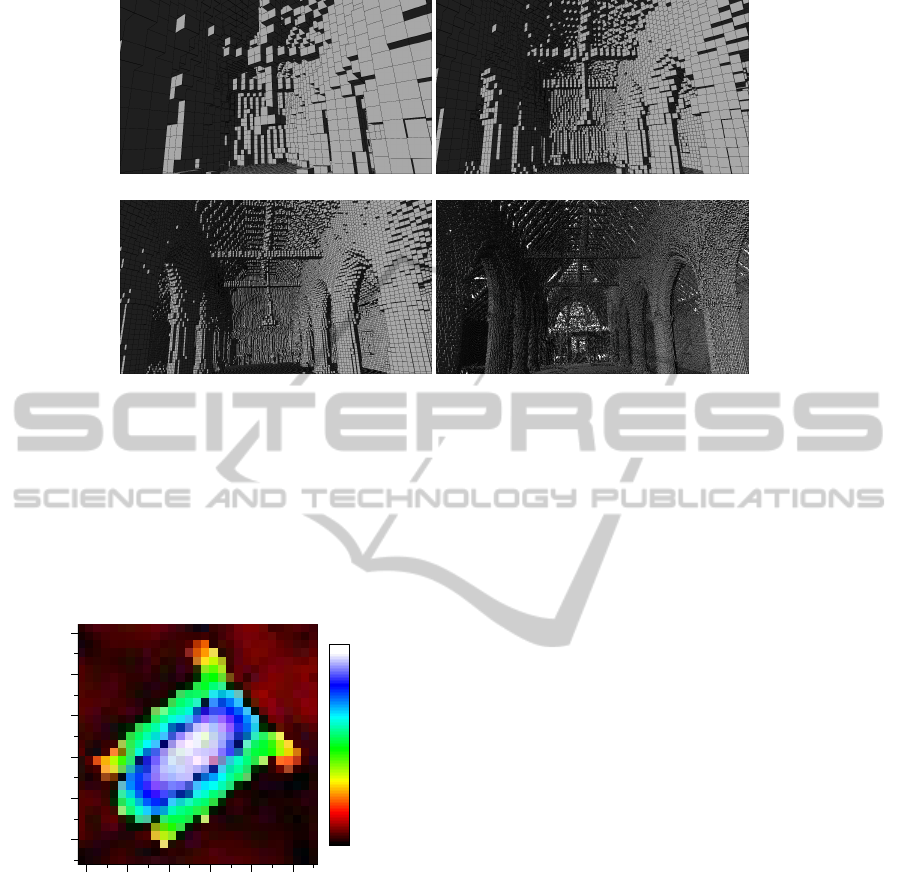
complexities, while keeping the number of voxels
manageable, see Figure 9(c). At this resolution, the
cross beams on the roof, arcades and the windows
are still recognisable. Smaller resolutions would give
more accurate results, but acquisition of higher reso-
lution data starts to become impractical. The lower
the resolution the larger the obstacles become. This
inflation of occupied space means that intricate de-
tail will not be directly evaluated. The detail is ac-
counted for in the visibility estimation by the use of
voxel transparency.
3.2 Viewpoint Position Estimation
The next step is estimation of a plane on which an
acquisition device operates. Because terrestrial laser
scanners are operated from a tripod a 2D plane delim-
iting the potential position of the scanner can be ap-
proximated. A uniform grid (1 m resolution) is then
created and overlayed on the plane.
At this stage each of the potential positions on the
grid is assigned a total count of compatible voxels.
A voxel is considered compatible if a ray cast from
the viewpoints in direction of its centre terminates on
that voxel. This is a less accurate way of estimating
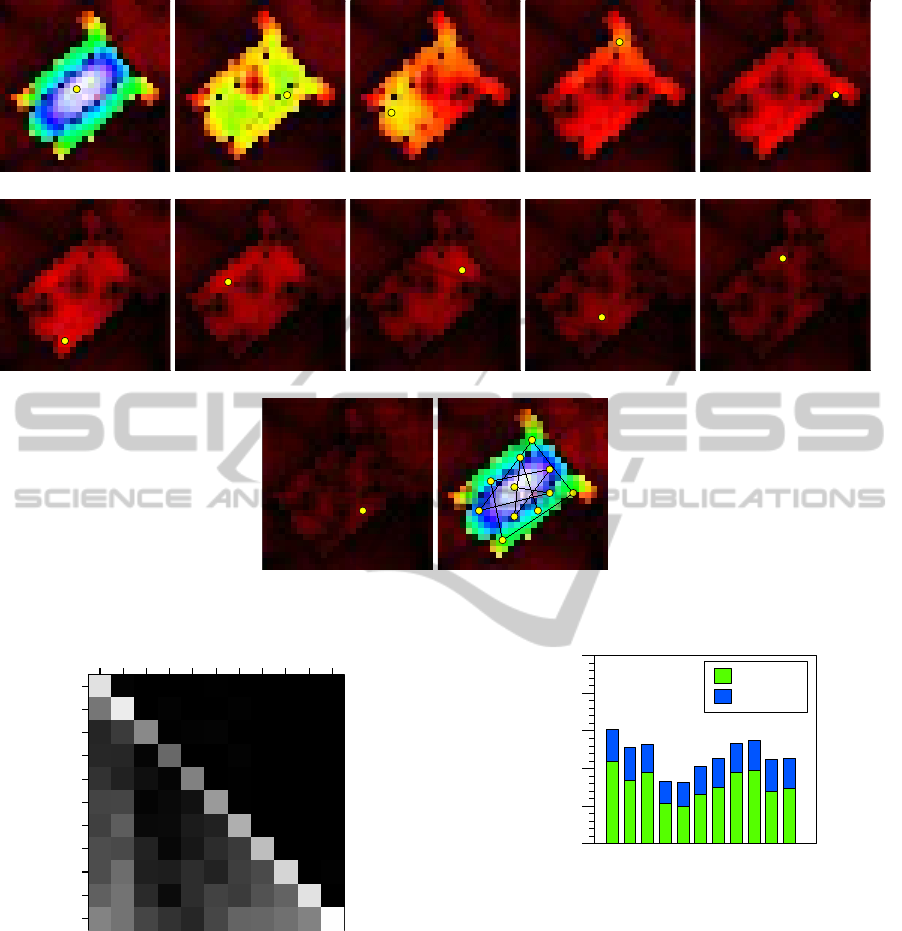
potential visibility of a given viewpoint. Figure 10
presents the sum of compatibility of the voxels for a
given viewpoint. The dark red areas represent low
compatibility, whereas blue into white areas repre-
sent high compatibility. After the position with maxi-
mum number of compatible voxels has been selected,
those voxels are removed from the set of all voxels.
The process is then repeated until either the set of
all voxels reaches 0 or the number of detected view-
points reaches the limit of allowed viewpoints, see
Figure 11(a)–11(k). In the provided example a limit
of 11 viewpoints has been reached. To increase the
visibility each of the potential viewpoints can be con-
verted to a set of viewpoints positioned in close prox-
imity of the potential viewpoint allowing for more
Multi-viewpointVisibilityCoverageEstimationfor3DEnvironmentPerception-VolumetricRepresentationasaGateway
toHighResolutionData
465
(a) 0.4 m resolution (b) 0.2 m resolution
(c) 0.1 m resolution (d) 0.01 m resolution
Figure 9: Data at different scales.
variation within the dataset. The presented heuristic
is greedy and tries to maximise the amount of com-
patible voxels. This heuristic is fairly expensive as it
relies on the creation of a grid of potential viewpoints
and evaluation of each of the viewpoints. We are plan-
ning to explore different heuristics as well as random
placement of the viewpoints in the future.
y
−5
0
5
10
15
20
x
−5 0 5 10 15 20
Figure 10: Voxel compatibility on the potential viewpoint
position plane.
3.3 Viewpoint Reduction
The last step is the reduction of the number of view-
points based on global visibility estimation, see Sec-
tion 2.2. The reduction potential is defined as the
global visibility coverage of the viewpoints in the set
of potential viewpoints P excluding the set of view-
points considered for reduction T . Global visibil-
ity estimate is computed using Equation 4, where
S = P − T . Elimination of multiple viewpoints might
be more beneficial than elimination of a single view-
point during a single iteration. During a single itera-
tion sets of two viewpoints are considered for elimi-
nation alongside the potential viewpoints.
Figure 12 shows the reduction potential of permu-
tations of viewpoints within the set of potential view-
points P. Both x and y axes signify a viewpoint num-
ber, the diagonal starting at position 1,1 shows the re-
duction potential of a single viewpoint, whereas other
values signify multi-viewpoint reduction. Viewpoint
11 has the highest reduction potential, closely fol-
lowed by viewpoint 2 and viewpoint 1. In the exam-
ple none of the viewpoints is obsolete, therefore none
of them will be removed. This method is designed
to provide a pareto-optimal solution with lowest data
loss during viewpoint elimination. The system can be
configured to perform viewpoint elimination until a
maximum allowed number of viewpoints is reached.
4 EVALUATION
Visibility coverage estimation has been performed at
both working resolution (0.1 m) and testing resolution
(0.01 m). Figure 13 shows the visibility coverage for
viewpoints from the example in Section 3. In all cases
the visibility at higher resolution is higher. This ten-
dency is caused by the reduction of object inflation
causing occlusions to appear larger than in reality.
The stable increase in visibility means that the
method slightly underestimates the visibility on a
higher resolution. This behaviour is not undesir-
able when detecting viewpoints for use with terrestrial
laser scanning as it leads to a higher overlap between
scans. The visual comparison shows little to no signs
of reduction in visibility coverage between the low
VISAPP2014-InternationalConferenceonComputerVisionTheoryandApplications
466
(a) (b) (c) (d) (e)
(f) (g) (h) (i) (j)
(k) (l) all viewpoints
Figure 11: Consecutive viewpoint detection points.
1
2
3
4
5
6
7
8
9
10
11
1 2 3 4 5 6 7 8 9 1011
Figure 12: The reduction potential of a given set of view-
points.
and high resolution representations. Figure 14 shows
the visualisation of the global visibility coverage of
a given viewpoint seen from a fixed position within
the dataset. This coupled with an increase in global
visibility makes the algorithm robust in a multitude of
environments.
0.1m
0.01m
visibility coverage
0
0.1
0.2
0.3
0.4
0.5
Viewpoints
Figure 13: Global scene visibility coverage from a given
viewpoint.
5 CONCLUSIONS
We have presented a robust method of estimating vis-
ibility within a 3D environment based on multi-scale
properties of voxel occupancy. Due to reliance on a
octree based data structure the accuracy of the method
is linked to the accuracy of the initial data. If the data
is very noisy or contains many ghost artefacts the ac-
curacy of the method could be lowered. This can be
improved by noise reduction methods.
The method provides a slight underestimation of
the actual visibility from a given viewpoint. This is
Multi-viewpointVisibilityCoverageEstimationfor3DEnvironmentPerception-VolumetricRepresentationasaGateway
toHighResolutionData
467
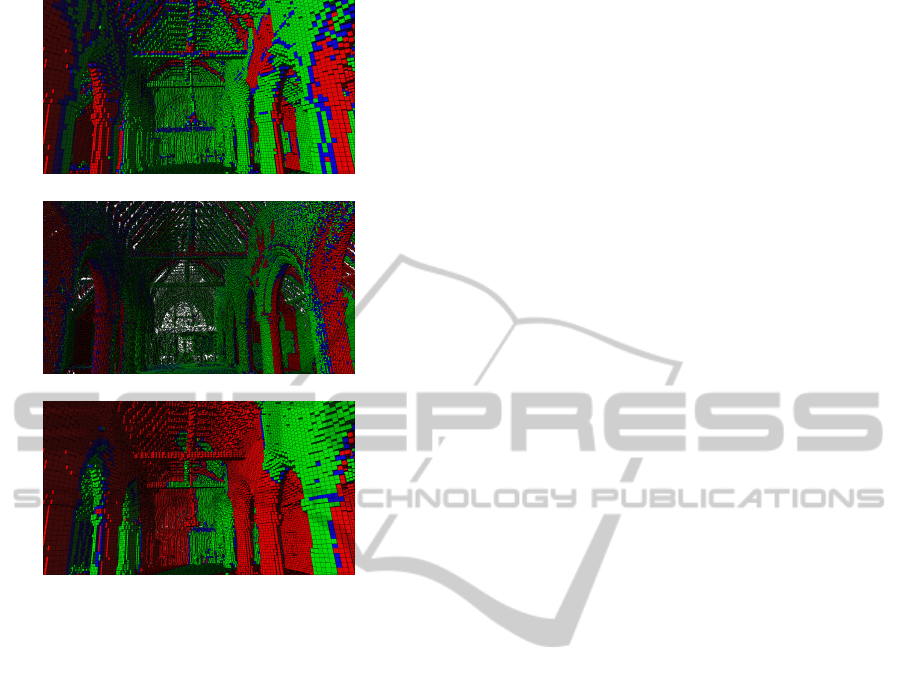
(a) Viewpoint 1 @ 0.1m
(b) Viewpoint 1 @ 0.01m
(c) Viewpoint 7 @ 0.1m
Figure 14: Visibility coverage.
mostly due to partial voxel occupancy. Such under-
estimation leads to more overlap between viewpoints
which is a desirable side effect when considering laser
scanning or security applications. Proposed method
of viewpoint position detection in a multi-agent sys-
tem is capable of providing reasonable results. The
current heuristic of detecting an initial set of potential
viewpoints is however computationally expensive and
should be improved. In the future we plan to explore
different approaches for generating the initial set of
potential viewpoints as well as testing out the method
in a wider range of real world environments.
ACKNOWLEDGEMENTS
The authors would like to thank Royal Commission
on the Ancient and Historical Monuments of Wales
for help in acquiring and understanding of the datasets
used within the project.
This research project is funded by Knowledge
Economy Skills Scholarships (KESS), which is
part-funded by the European Social Fund (ESF)
through the European Union’s Convergence Pro-
gramme (West Wales and the Valleys), administered
by the Welsh Government.
REFERENCES
Amanatides, J. and Woo, A. (1987). A fast voxel traversal
algorithm for ray tracing. In Eurographics 87, pages
3–10.
Amit, Y., Mitchell, J. S. B., and Packer, E. (2010). Lo-
cating guards for visibility coverage of polygons.
International Journal of Computational Geometry,
20(5):601–630.
Bottino, A. and Laurentini, A. (2011). A nearly optimal
algorithm for covering the interior of an art gallery.
Pattern Recognition, 44(5):1048–1056.
Cano, J., Tth, C. D., and Urrutia, J. (2013). A tight
bound for point guards in piecewise convex art gal-
leries. International Journal of Computational Geom-
etry, 46(8):945–958.
Chvatal, V. (1975). A combinatorial theorem in plane ge-
ometry. Journal of Combinatorial Theory Series B,
18:39–41.
Endres, F., Hess, J., Engelhard, N., Sturm, J., Cremers, D.,
and Burgard, W. (2012). An evaluation of the rgb-d
slam system. In IEEE International Conference on-
Robotics and Automation (ICRA), pages 1691–1696.
Fisk, S. (1978). A short proof of chvtal’s watchman the-
orem. Journal of Combinatorial Theory, Series B,
24(3):374.
Furukawa, Y., Curless, B., Seitz, S. M., and Szeliski, R.
(2010). Towards internet-scale multi-view stereo. In
IEEE Conference on Computer Vision and Pattern
Recognition.
Furukawa, Y. and Ponce, J. (2010). Accurate, dense, and
robust multi-view stereopsis. IEEE Trans. on Pattern
Analysis and Machine Intelligence, 32(8):1362–1376.
Hernandez, C., Vogiatzis, G., and Cipolla, R. (2007). Prob-
abilistic visibility for multi-view stereo. In IEEE Con-
ference on Computer Vision and Pattern Recognition,
pages 1–8.
Hoffmann, F., Kaufmann, M., and Kriegel, K. (1991). The
art gallery theorem for polygons with holes. In 32nd
Annual Symposium on Foundations of Computer Sci-
ence, pages 39–48.
Hornung, A., Wurm, K. M., Bennewitz, M., Stachniss, C.,
and Burgard, W. (2013). OctoMap: An efficient prob-
abilistic 3D mapping framework based on octrees. Au-
tonomous Robots.
Iwerks, J. and Mitchell, J. S. (2012). The art gallery theorem
for simple polygons in terms of the number of reflex
and convex vertices. Information Processing Letters,
112(20):778–782.
Obermeyer, K. J., Ganguli, A., and Bullo, F. (2011). Multi-
agent deployment for visibility coverage in polygonal
environments with holes. International Journal of Ro-
bust and Nonlinear Control, 21(12):1467–1492.
Roussillon, C., Gonzalez, A., Sol
`
a, J., Codol, J. M.,
Mansard, N., Lacroix, S., and Devy, M. (2011). RT-
SLAM: a generic and real-time visual SLAM imple-
mentation. In International Conference on Computer
Vision Systems (ICVS), Sophia Antipolis, France.
Trucco, E., Umasuthan, M., Wallace, A., and Roberto,
V. (1997). Model-based planning of optimal sen-
VISAPP2014-InternationalConferenceonComputerVisionTheoryandApplications
468

sor placements for inspection. IEEE Transactions on
Robotics and Automation, 13(2):182–194.
Zhang, L.-X., Pei, M.-T., and Jia, Y.-D. (2011). Mul-
tiview visibility estimation for image-based model-
ing. Journal of Computer Science and Technology,
26(6):1000–1010.
Multi-viewpointVisibilityCoverageEstimationfor3DEnvironmentPerception-VolumetricRepresentationasaGateway
toHighResolutionData
469
