
A Perceptive Insight into Cities Patterns by Visualizing Urban Economies
Luca Piovano
1
, Alberto Andr´eu
2
, Iris Galloso
1
and Claudio Feij´oo
2
1
Virtual Reality Group, CeDInt, Universidad Pol´ıtecnica de Madrid, Campus de Montegancedo,
Pozuelo de Alarc´on, Madrid, Spain
2
Techno-economics Group, CeDInt, Universidad Pol´ıtecnica de Madrid, Campus de Montegancedo,
Pozuelo de Alarc´on, Madrid, Spain
Keywords:
Information Visualization, Economics, Graphs, Association Discovery Rules.
Abstract:
Urban economic activities are an essential facet in defining city identity. Traditional approaches rely very
often on the most theoretical and quantitative features of the studies, excluding de-facto a direct association
between those findings and the tangible subject of the analysis. To fill the gap, the Big Data era and information
visualization methodologies could help analysts, stakeholders and general audience to gain a new insight on
the field. In this paper, we want to provide some food for thought about new opportunities arising in visual
urban economies as well as present some visual results on possible scenarios.
1 INTRODUCTION
Cities are complex systems where the global picture
of the urban dynamics is given by the sum of several
evolving and intermingled networks. As living enti-
ties, they present non-static features as well as strong
and varied interactions among their main actors: peo-
ple create social interactions, give functionalities to
the architecture, benefit from services and infrastruc-
tures and connect different areas of the urban fabric.
In this context, managing to understand what a city is,
as well as how it could evolve, should be carried out
by innovative and interdisciplinary approaches, com-
prising, and not limited to, networks / graph theory,
complex system science (Miller and Page, 2009) and
agent-based computational modelling.
The development of better urban theories and sim-
ulation models rely heavily on the availability of suit-
able datasets at the city level. The incoming Big Data
era seems to promise an unprecedented amount of op-
portunities to deeply understand and describe the Big
Picture of cities. Conversely to the past, the evo-
lution of the open data movement and the increas-
ing penetration of ICT in everyday activities (e.g.
smart phones, e-transactions, Internet social networks
or smart card technologies) allow to produce, collect
and have at disposal a vast amount of such spatial
and temporal data, almost in real-time. Disciplines
such as smart cities (Hollands, 2008; Nam and Pardo,
2011; Batty et al., 2012) and city science (Laube et al.,
1998; Solecki et al., 2013) have then emerged to take
in charge the exploitation of such resources and thus
steer the whole urban planning process towards an
heavily data- and evidence-based approach.
1.1 Urban Economies and Data
One of the pillars in defining urban identities is to un-
derstand its economic activities. In that sense, cities
show a high concentration of consumers, workers and
businesses in a ’restricted’ area and have the potential
to produce externalities and increasing returns (Eu-
ropean Union, 2011). The economic crisis begun in
2008 heavily stressed the traditional urban system and
created problems to all its structural components. Ac-
cordingly, new urban policies to sustain growth, em-
ployment and social progress in general have been de-
vised to tackle, and in the future to prevent or mit-
igate, such kind of problems. Policy makers have
paid their attention on agglomeration economies af-
ter some decades, especially focusing on how a num-
ber of different resources and locations with a high
density of several activities come into play on cities
dynamics and influence each other (Scott, 2009). De-
spite the current chance to have a relative easy access
to major economic data for measuring the health of
the urban economy, current researches cannot explain
thoroughly how they interplay on the underlying ur-
ban fabric. Ultimately it relapses into making diffi-
cult to put in practice effective policies. What it is
222
Piovano L., Andréu A., Galloso I. and Feijóo C..
A Perceptive Insight into Cities Patterns by Visualizing Urban Economies.
DOI: 10.5220/0004855102220227
In Proceedings of the 5th International Conference on Information Visualization Theory and Applications (IVAPP-2014), pages 222-227
ISBN: 978-989-758-005-5
Copyright
c
2014 SCITEPRESS (Science and Technology Publications, Lda.)

still missing is the capability to produce and exploit
real-time knowledge at a fine grain - in geographical
terms at the neighbourhoodscale; from a people point
of view, at the single dweller level. This is partially
justifiable when considering that such economic data
are usually not openly accessible, even if its digital
trace could be recorded easily. A straightforward ex-
ample could be gathering credit card transactions, for
instance both at shops and on e-commerce sites: as
they belong to either banks or other private financial
entities, the likelihood to access to such gold mine
of information is inversely proportional to the inter-
estingness of its content. On the other hand, even in
presence of open data, urban policies suffers from the
lack of data-driven modelling and practice, thus limit-
ing its effectiveness and comprehension of urban dy-
namics.
Nevertheless, very recent works show that, by us-
ing such non-traditional sources of data, it is possible
to catch fascinating and not-trivial facets of the urban
landscape. For instance, in (Krumme et al., 2013),
the authors could access electronic records of indi-
vidual economic transactions from both North Amer-
ican and European financial institutions to predict pat-
terns of customers’ habits in their shopping activi-
ties in the course of time. By using similar data, an
interactive visualization manages to inspect the eco-
nomic impact of the http://mwcimpact.com/Mobile
World Congress 2012 on the city of Barcelona. This
objective was achieved by visually comparing his-
torical data from the week before and during the
MWC 2012 so that differences in the purchase dy-
namics of the city along that week could emerge.
On the other hand, another visual project, namely
http://senseable.mit.edu/bbva/Spring Spree, was con-
ceived to examine spatio-temporal transactions cate-
gorized by the type of sale (e.g. fashion, restaurants)
during the week of Easter 2011 in order to detect dis-
tinctive patterns emerging across Spain.
1.2 The Role of Visualization
The last aforementioned examples introduce a couple
of important elements to reflect on. First of all, the
Big Data opportunities could turn into the Big Data
nightmare if policies to handle them are not imple-
mented conveniently. Indeed, current approachesusu-
ally do not scale up to face such volume and variety
of information (at a reasonable velocity), thus deter-
mining underused and wasted opportunities.
Then, another awkward point coming up when
dealing with economic studies is its (perceived?) in-
trinsic abstraction in the formulation of problems and
methodologies to work them out. Indeed, models and
formulas usually used in this field are lacking in per-
ceptible concreteness and immediacy. In particular,
this means that their outcomes are neither easily com-
municable nor understandable outside the (few) mem-
bers of the economic ’clique’. Moreover, while talk-
ing about urban economic facts, the risk is somehow
to miss the context in which the economic analysis
is performed and therefore, to reveal the impact on
the real urban environment. We are plenty aware that
classical charts (e.g. bar, pie and scatter-plot charts)
have been extensively used in this field, especially to
portray temporal trends of indicators and indexes. But
they usually do not associate that evidence to the geo-
graphical context they refer to. For instance, in (Mul-
brandon, 2013), a whole dissection of American in-
comes is presented through both classical and more
sophisticated visualizations. Despite that, there is a
lack of visual feedback at the geographical level (but
for some choropleth maps at US scale).
In this context, a smart approach to solve both
problems could rely on information visualization and
visual analysis disciplines. Indeed, they can provide a
strong support to economists and stakeholders in gen-
eral to highlight efficiently the development of urban
economies. The strength of such approaches is to ex-
ploit perceptual mechanisms of the human sight to en-
force cognitive process of learning, as well as provide
powerfultools in dynamically revealingpatterns, rela-
tionships, clusters, unknownfacts and outliers (Shnei-
derman, 1996). In recent years, the same paradigm
has been extensively and successfully applied to re-
veal cities facts and dynamics under different points
of view. So, for instance, different kinds of mobil-
ity (e.g. people and transport systems (Girardin et al.,
2008; Roth et al., 2011)) have been studied accord-
ing to a number of digital traces they leave (e.g. cell
phones, social networks activities and photographies
(Reades et al., 2009; Jankowski et al., 2010)). In this
sense, visual economies are the next facet of the urban
environment gemstone to look at.
1.3 Our Objectives
Within this context, the main contribution of this work
could be summarized with the following points: i)
to provide an introduction to both opportunities and
problems when dealing with urban data and planning
processes (mainly discussed in Sections 1.1 and 1.2);
ii) to suggest engagingabstract, economic studies also
from the perspective of the geography of the cities, in
order to visually relate economic evidences and facts
to their urban context (we will talk about it in Sections
2 and 3); iii) to show some practical examples about
our work on visualizing urban economies applied to
APerceptiveInsightintoCitiesPatternsbyVisualizingUrbanEconomies
223

the city of Madrid and its surroundings (discussed in
Sections 3.2 and 3.3) and provide inspiration for fur-
ther works and applications.
2 THE METHODOLOGY
The enquiry we are addressing broadly deals with
characterizing urban mobility patterns under eco-
nomic reasons. In other words, we are looking for
tell-tale insights on how dwellers-customers are ex-
ploiting urban infrastructures and, in turn, how this
will be reflected on the geography of the city. To this
end, we mainly rely on association discovery rules
(ADRs) or association rule learning (ARL) (Agrawal
et al., 1993). Even if they are not real economic indi-
cators, they have been extensively used in economic-
related fields (e.g. market basket analysis) for both
their simplicity and strength in searching for regulari-
ties and repetitive patterns among variables in large
databases. Furthermore, through this methodology
we can learn about spatial patterns in consumption be-
haviour even when traditional information (e.g. cus-
tomers’ preferences, habits and socio-economic de-
tails) is missing, incomplete or unreliable. Indeed,
collecting data from retail activities as in our case (see
Section 3.1) means to tackle the problem under a dif-
ferent perspective and, in this sense, ADRs are a help-
ful tool to accomplish this specific goal.
2.1 Association Discovery Rules
ADRs are techniques belonging to the data mining
domain whose goal is to find regularities and affini-
ties (rules) among entries of a dataset D. Each entry
is a collection of items: for instance, with respect to
the case studies in Sections 3.2 and 3.3, items could
be city sectors or business categories. Formally, a rule
is written as X → Y, where X (the antecedent or head)
and Y (the consequent or body) are disjoint subsets of
such items. Intuitively, the rule could be interpreted
as the trend showed by items in Y to appear with a
certain probability whenever items in X occur too. In
order to discover the most relevant rules occurring in
a dataset, we introduce some values measuring their
statistical interestingness (Tan et al., 2004) and briefly
explained in the next subsections.
2.1.1 Support
The support is defined as the proportion of examples
for which X and Y are simultaneously true, that is:
supp(X → Y) = |X ∩Y|/|D|,
where the |.| notation is the cardinality operator and ∩
represents the simultaneous occurrence of the events
in the two sets. In other words, this straightforward
measure is an estimation of the frequency to find X
and Y coupled in the dataset. Trivially, the above
equation can be applied to the single set X too and in-
terpreted as the likelihood to infer relationships when
the causes are known.
2.1.2 Confidence and Expected Confidence
The strength of a rule is called its confidence and pro-
vides the proportion of examples for which the head
X appears among those for which the body Y is true.
Mathematically speaking, this is expressed as:
conf(X → Y) =
supp(X → Y)
supp(X)
=
|X ∩Y|
|X|
In probabilistic terms, it can be interpreted as an esti-
mate of the conditional probability P(Y|X).
On the other hand, the expected confidence es-
timates the likelihood a consequent would appear
among the dataset items independently of the an-
tecedent of the rule, that is:
conf(Y) = supp(Y) = |Y|
In other words, the last measure is used to see how
frequently an observation could be inferred regardless
the causes having originated it.
2.1.3 Lift
The lift expresses the ratio of the support of the two
observed sets to the supports of the sets considered
separately. In other words:
lift(X → Y) =
supp(X → Y)
supp(X) ∗ supp(Y)
=
|X ∩Y|
|X| ∗ |Y|
The lift is a comparative evaluation of the likelihood
of observed sets with respect to the expected supports
of X andY under the statistical independenceassump-
tion. Its goal is to ponder the profit in applying that
rule, since it expresses how many times it is more
likely to derive a consequent from its antecedent than
without considering such statistical dependency.
To find how much interesting could be considered
a rule, we will consider a trade-off between its sup-
port (because it means it appears several times) and
lift (because the higher this value, the stronger the rule
when compared to other ones in which only either X
or Y is present). Tables 1 and 2 show some example
in applying such rules.
IVAPP2014-InternationalConferenceonInformationVisualizationTheoryandApplications
224

Table 1: First 10 results of applying ADR to a specific postal
code, namely 01. For a sake of uniformity, postal codes are
written according the colour they are depicted in Figure 1
(see the digital version).
Rule li ft supp conf conf Count
01 → 09 3.41 1% 14.74% 4.32% 28043
01 → 06 3.14 1.14% 16.73% 5.34% 31823
01 → 46 2.57 0.25% 3.68% 1.44% 7010
01 → 16 2.27 0.21% 3.08% 1.36% 5868
01 → 10 2.22 0.44% 6.44% 2.9% 12251
01 → 36 2.18 0.36% 5.27% 2.42% 10022
01 → 02 2.16 0.28% 4.05% 1.87% 7698
01 → 04 2.09 0.59% 8.59% 4.12% 16348
01 → 28 2.03 0.24% 3.59% 1.77% 6821
01 → 03 1.88 0.38% 5.61% 2.98% 10678
Table 2: ADRs applied to a specific business category
(number 3). In this case, the second and third rules (in blue)
are the best ones because they show a good trade-off be-
tween support and lift values (unlike those in purple).
Rule li ft supp conf conf Count
3 → 8 4.51 0.93% 15.77% 3.5% 25839
3 → 9 3.79 2.03% 34.57% 9.12% 56637
3 → 1 3.72 2.04% 34.7% 9.32% 56858
3 → 4 2.82 1.25% 21.27% 7.53% 34847
3 → 7 2.01 0.97% 16.5% 8.21% 27026
3 → 10 1.94 0.48% 8.22% 4.24% 13469
3 → 14 1.8 2.14% 36.5% 20.31% 59798
3 → 13 1.75 2.29% 39.03% 22.28% 63944
3 → 2 1.33 0.84% 14.2%4 10.74% 23331
3 → 15 0.95 0.49% 8.37% 8.77% 13711
3 → 5 0.78 1.93% 32.93% 42.07% 53955
2.2 Competition Index
For the scenario described in Section 3.3, we define a
further indicator - the competition index - estimating
the density of purchases performed in a given area as:
c
b
=
∑
{region}
∑
b
trans
b
act
b
,
where: the sums are performed over the whole sets
of geographical regions and categories of economic
activity; operators trans and act count, respectively,
the number of transactions performed and how many
businesses of type b there are in a given region.
3 VISUAL URBAN ECONOMIES
3.1 Data and Tools
The credit card transactions database used in this
work has been created by coupling open data from
statistical institutes with information obtained by pri-
vate financial entities. Aggregated data in their whole
reflect the most significant statistical trends (e.g. over-
all volume of purchases and money spent; main cus-
tomer flows and shopping patterns; distribution of
transactions across city sectors) of the reference city.
While writing this paper, no access to anonymous in-
formation at single customer transactions level has
been performed. We limit our analysis to a representa-
tive subset of data of purchasing activities performed
in Madrid throughout a couple of months. However,
for the purposes of this study, this suffices to show
interesting patterns and visualisation opportunities.
The dataset has been analysed by using R and SAS
scripts. Graphs have been drawn by using Gephi soft-
ware. Geographical information for the Madrid re-
gion come from http://www.madrid.org/nomecalles/
Nomecalles website and analysed using GIS tools
such as QGIS.
3.2 Scenario 1: Customers’ Flows
The first scenario will answer to the following ques-
tion: where do people go shopping in Madrid city as
they haveto do multiple purchases along the day? The
analysis has been performed by considering postal
codes as the geographical units and by limiting at 150
minutes the maximum time between two consecutive
purchases performed by the same customer. The re-
sults of such analysis are shown in Figure 1, where
we factually visualize an origin-destination matrix in
which city sectors are disposed in a circular pattern.
The ADR analysis shown in Table 1 addresses the
same zone, namely zone 01, of the city highlighted
in the figure and just considers the flows originating
from there. Arcs connecting sectors represent a bi-
directional flow: the thicker the link, the bigger the
flow volume between two end-points (usually the re-
lationships are asymmetric). Arcs’ colours encode the
end-point arising the greatest number of transactions.
According to this, the chord diagram puts in evidence
that the rules 01 → 09 and 01 → 06 are predominant
among all the flows from and to zone 01, as also stated
in Table 1 by looking at the supp column. More-
over, it shows that direction 06 → 01 generates more
economic traffic than the opposite one. A graphical
meaning could be assigned to conf and
conf indica-
tors too, being respectively, the ratio between the rule
link and its segment of origin and the length of the
segment of destination.
The same information could be mapped accord-
ing to the geographical coordinates of each zone as
in Figure 2. In this case, the graph of the city illus-
trates how connected is an urban unit with respect to
APerceptiveInsightintoCitiesPatternsbyVisualizingUrbanEconomies
225

the others given its purchases patterns. The connex-
ions are depicted proportionally to the lift index, so
that it is possible to perceive which areas of the city
are strongly connected for shopping purposes. Since
we are talking about networks, some other measures
could be used to evaluate the shopping graph. In our
case, nodes have been partitioned into clusters of sim-
ilar purchases behaviours, while their size reveals the
respective betweenness index, that is how much im-
portant a node is to connect any other couple of them.
Figure 1: Customers’ dynamics mapped by a chord dia-
gram: each segment represents a sector of the city, arranged
in clockwise order from the very centre - sector 28013 in
light-blue - till the most peripheral ones, in pink.
Figure 2: The shopping graph with Madrid postal codes.
3.3 Scenario 2: Territorial Analysis
We designed this scenario as a proof of concept to
help a businessman finding the best place(s) to set his
own activity. First of all, a territorial analysis should
be performed to classify areas according to their ’at-
tractiveness’ in hosting a business activity of the given
type, say type 3. A way to estimate such parameter is
given by the competition index introduced in Section
2.2. In absence of other constraints, this will give a
quantitative evaluation of the local turnover: the gen-
eral idea is to detect zones where the total number of
activities similar to that of type 3 is (relatively) low
and the profit margin high. To visualize the results of
this analysis, we could use a choropleth map, as the
one depicted in Figure 3, where the whole region of
Madrid is shown. The lighter the colour, the less the
competition. For instance, one of the best cities found
in the given example corresponds to Fuenlabrada, in
the south of the region. A step further could be per-
formed in order to find within that city the most suit-
able sites. On a map it is possible to place all the
businesses of type 3 to have a look at their geograph-
ical distribution. One straightforward strategy would
infer to place our activity almost far away from all the
others. Instead, a smarter approach could be to ex-
ploit ADR analysis (shown in Table 2) on our transac-
tion datasets in order to discover strong relationships
among the targeted business and activities of differ-
ent categories. The idea is about taking advantage of
typical users’ patterns to extend the range of poten-
tial customers. This way, we could create a heatmap
(see Figure 4) to have a visual insight of the candidate
sites: the best areas, shown in orange-red tones, are
those ones having a high concentration of activities
connected to our target.
4 CONCLUSIONS
In this paper, we discussed visualizing economic ev-
idence in order to understand urban patterns. Eco-
nomic activities are usually presented in abstract
forms, where all the focus is tended towards show-
ing off numbers and models. As a consequence, a di-
rect association between the theoretical findings and
the tangible subject of the analysis is often missed.
Visual economies could be an efficient way to over-
come this problem because of the perceptive insight
revealing the (geographical) impact of economic ac-
tivities descriptors. Moreover, such visual approaches
have the potential to make economic datasets accessi-
ble to a broader group of potential users, including
financial entities, policy makers and customers. In
turn this could provide advantages to improve both
business strategies and decision-making policies (es-
pecially when coupled with other mobility datasets,
such as telephone cells records) as well as increase
IVAPP2014-InternationalConferenceonInformationVisualizationTheoryandApplications
226
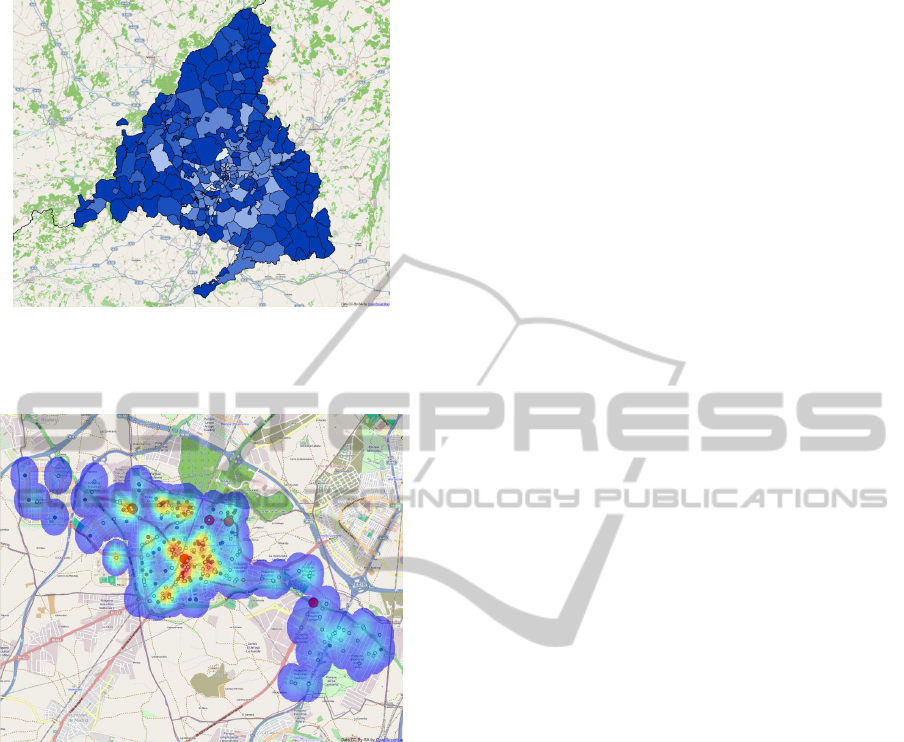
Figure 3: Choropleth map of the region of Madrid repre-
senting the competition index for business category 3: The
darker the blue, the stronger the competition in that area
(and therefore possibly smaller the chances to succeed).
Figure 4: Heatmap on the map of Fuelanbrada (Madrid)
showing the most suitable sites where to place a business of
type 3: the more suitable areas are those coloured in yellow-
red shades.
end-users’ awareness. To illustrate our point of view,
we depicted an analysis based on ADRs techniques
and presented a couple of scenarios to show some
practical, visual examples, which could hopefully in-
spire further advances and applications, especially in
the context of city science.
REFERENCES
Agrawal, R., Imieli´nski, T., and Swami, A. (1993). Min-
ing Association Rules Between Sets of Items in Large
Databases. In Proc. of the 1993 ACM SIGMOD Int.
Conf. on Management of Data, volume 22, pages 207–
216, New York, USA. ACM.
Batty, M., Axhausen, K., Giannotti, F., Pozdnoukhov, A.,
Bazzani, A., Wachowicz, M., Ouzounis, G., and Por-
tugali, Y. (2012). Smart cities of the future. European
Physical Journal Special Topics, 214(1):481–518.
European Union (2011). Cities of tomorrow - Challenges,
visions, ways forward. Technical report, European
Commission - Directorate General for Regional Pol-
icy.
Girardin, F., Calabrese, F., Fiore, F. D., Ratti, C., and Blat, J.
(2008). Digital footprinting: Uncovering tourists with
user-generated content. Pervasive Computing, IEEE,
7(4):36–43.
Hollands, R. G. (2008). Will the real smart city please stand
up? City, 12(3):303–320.
Jankowski, P., Andrienko, N., Andrienko, G., and Kisile-
vich, S. (2010). Discovering landmark preferences
and movement patterns from photo postings. Trans-
actions in GIS, 14(6):833–852.
Krumme, C., Llorente, A., Cebrian, M., Pentland, A., and
Moro, E. (2013). The predictability of consumer visi-
tation patterns. Scientific Reports - Nature, 3.
Laube, F., Kenworthy, J., and Zeibots, M. (1998). Towards
a science of cities: city observation and formulation
of a city theory. In Proceedings Siedlungsstruktren,
r¨aumliche Mobilit¨at und Verkehr: Auf dem Weg zur
Nachhaltigkeit in Stradtregionen.
Miller, J. H. and Page, S. E. (2009). Complex Adaptive
Systems: An Introduction to Computational Models of
Social Life: An Introduction to Computational Models
of Social Life. Princeton University Press.
Mulbrandon, C. (2013). An Illustrated Guide to Income in
the United States. Worthy Shorts.
Nam, T. and Pardo, T. A. (2011). Conceptualizing Smart
City with Dimensions of Technology, People, and In-
stitutions. In Proceedings of the 12th Annual Inter-
national Digital Government Research Conference:
Digital Government Innovation in Challenging Times,
pages 282–291. ACM.
Reades, J., Calabrese, F., and Ratti, C. (2009). Eigenplaces:
analysing cities using the space-time structure of the
mobile phone network. Environment and Planning B:
Planning and Design, 36(5):824–836.
Roth, C., Kang, S. M., Batty, M., and Barth´elemy, M.
(2011). Structure of urban movements: polycentric
activity and entangled hierarchical flows. PLoS One,
6(1):e15923.
Scott, A. J. (2009). World Development Report 2009: re-
shaping economic geography. Journal of Economic
Geography, 9(4):583–586.
Shneiderman, B. (1996). The eyes have it: A task by data
type taxonomy for information visualizations. In Pro-
ceedings of IEEE Symposium on Visual Languages
1996, pages 336–343. IEEE.
Solecki, W., Seto, K. C., and Marcotullio, P. J. (2013).
It’s time for an urbanization science. Environ-
ment: Science and Policy for Sustainable Develop-
ment, 55(1):12–17.
Tan, P.-N., Kumar, V., and Srivastava, J. (2004). Selecting
the Right Objective Measure for Association Analy-
sis. Information System, 29(4):293–313.
APerceptiveInsightintoCitiesPatternsbyVisualizingUrbanEconomies
227
